
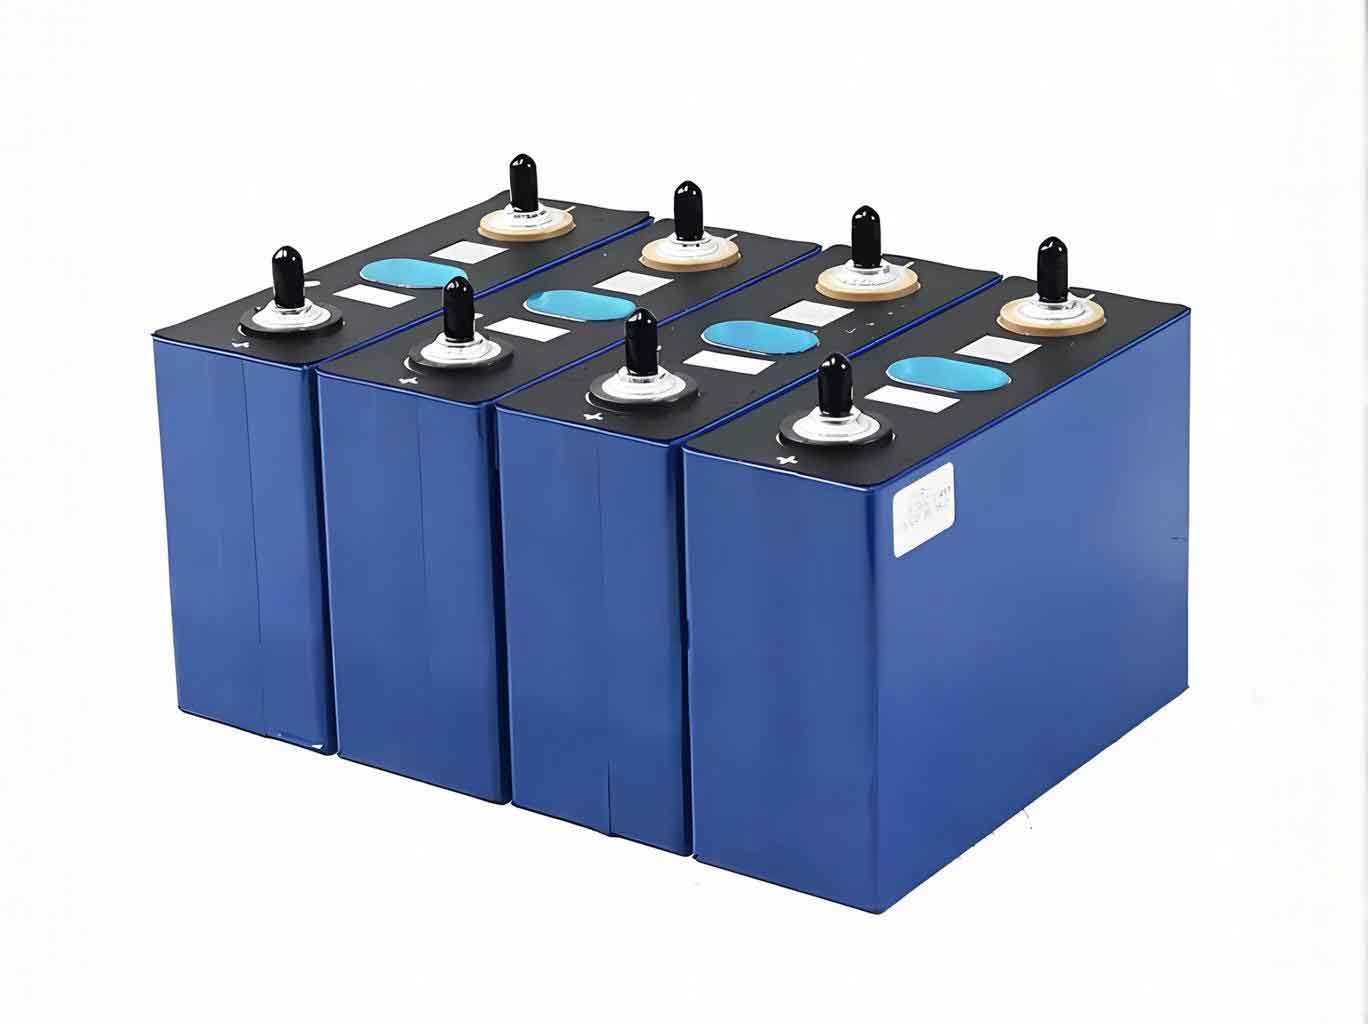
The lithium iron phosphate (LiFePO4, LFP) cathode material has become a cornerstone of the electric vehicle (EV) and energy storage industries due to its safety, stability, and cost-effectiveness. This article examines the production processes, market dynamics, challenges, and strategic recommendations for the LFP industry.
Production Processes of LFP Cathode Materials
The synthesis of lithium iron phosphate battery cathode materials primarily involves solid-phase and liquid-phase methods. The solid-phase method, which accounts for over 80% of commercial production, includes the following key reactions:
Ammonium Process (Mainstream):
$$ \text{FeSO}_4 + \text{H}_2\text{O}_2 \rightarrow \text{Fe}_2(\text{SO}_4)_3 + \text{H}_2\text{O} $$
$$ \text{Fe}_2(\text{SO}_4)_3 + \text{NH}_4\text{H}_2\text{PO}_4 \rightarrow \text{FePO}_4 + (\text{NH}_4)_2\text{SO}_4 $$
Sodium Process:
$$ \text{FeSO}_4 + \text{NaOH} + \text{H}_3\text{PO}_4 \rightarrow \text{FePO}_4 + \text{Na}_2\text{SO}_4 $$
| Method | Energy Consumption (kWh/t) | Purity (%) | Cost (USD/t) |
|---|---|---|---|
| Solid-phase (Ammonium) | 2,800 | 98.5 | 6,200 |
| Solid-phase (Sodium) | 3,100 | 99.2 | 7,400 |
| Liquid-phase | 3,500 | 99.8 | 8,900 |
Market Dynamics of Lithium Iron Phosphate Battery Industry
China dominates the global lithium iron phosphate battery market, with production capacity reaching 3.88 million tons in 2023. The competitive landscape shows significant concentration:
| Rank | Company | Output (kton) | Market Share (%) |
|---|---|---|---|
| 1 | Hunan Yuneng | 510 | 31.0 |
| 2 | BYD | 230 | 14.0 |
| 3 | Wanrun New Energy | 165 | 10.0 |
The price volatility of lithium iron phosphate battery materials has been extreme, driven by lithium carbonate fluctuations:
$$ \text{LFP Price} = 2.2 \times \text{Li}_2\text{CO}_3 \text{ Price} + 1,200 \text{ (USD/t, } R^2 = 0.92\text{)} $$
Challenges in Lithium Iron Phosphate Battery Supply Chain
1. Overcapacity: Current global LFP capacity (5.53 million tons) far exceeds projected 2025 demand (2.8 million tons), leading to utilization rates below 50%.
2. Lithium Price Volatility: Lithium carbonate prices fluctuated from $6,000/t (2020) to $85,000/t (2022), then collapsed to $14,000/t (2023).
3. Technological Disruption: Emerging alternatives threaten LFP dominance:
$$ \text{LMFP Energy Density} = 1.15 \times \text{LFP Energy Density} $$
$$ \text{Sodium-ion Cost} = 0.7 \times \text{LFP Cost (at Li}_2\text{CO}_3 > \$25,000/t\text{)} $$
Strategic Recommendations for Lithium Iron Phosphate Battery Industry
1. Vertical Integration: Establish closed-loop production systems:
$$ \text{Integrated Cost} = 0.65 \times \text{Current LFP Production Cost} $$
| Integration Level | Cost Reduction (%) |
|---|---|
| Phosphate Rock → LFP | 28 |
| Lithium Mine → LFP | 34 |
2. Geographical Diversification: Southeast Asia and Africa offer 30-40% lower production costs for lithium iron phosphate battery manufacturing.
3. Financial Hedging: Implement futures strategies to manage lithium price risk:
$$ \text{Hedge Ratio} = \frac{\text{LFP Exposure}}{\text{Li}_2\text{CO}_3 \text{ Futures Liquidity}} \times 100\% $$
The lithium iron phosphate battery sector must adapt to evolving market conditions through technological innovation, supply chain optimization, and strategic global positioning. As the backbone of energy storage systems, LFP will continue to dominate stationary storage applications while facing intensified competition in EV markets.