
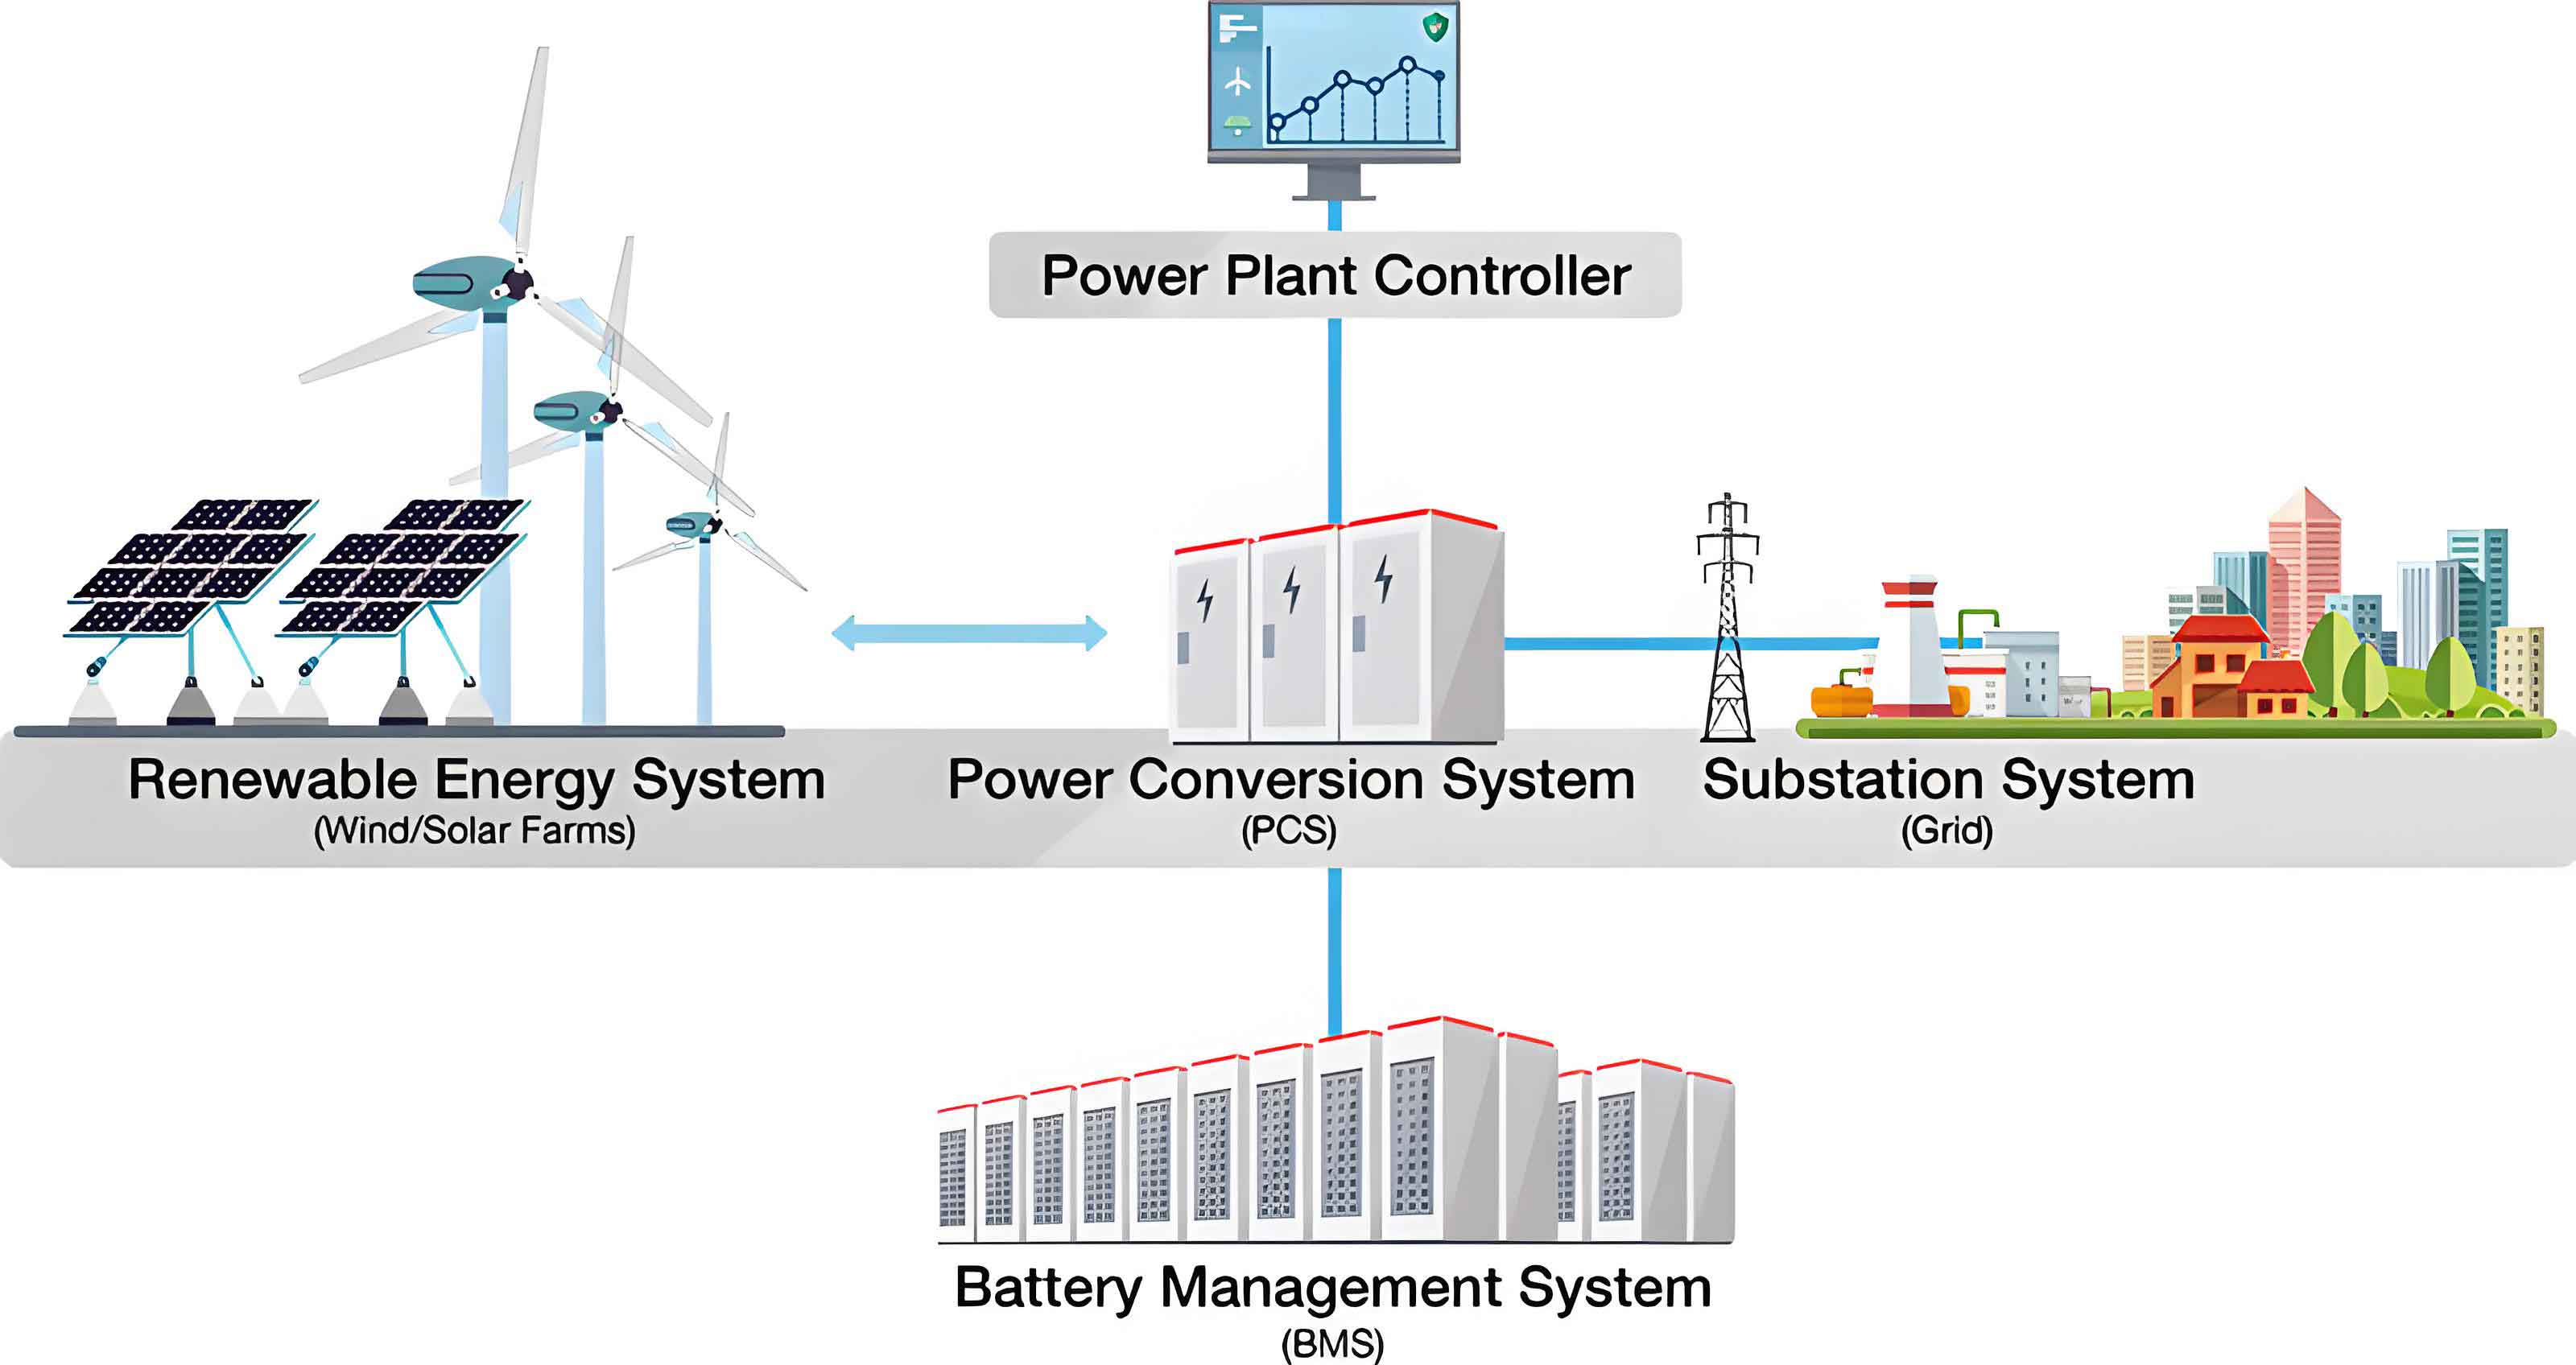
The evolution of modern power grids and renewable energy integration has fundamentally increased the reliance on large-scale Battery Energy Storage Systems (BESS). These systems are pivotal for load leveling, frequency regulation, and providing backup power. However, a critical challenge undermining their reliability and longevity is cell-to-cell inconsistency within battery packs. In distributed BESS architectures, where numerous battery modules operate across varied environmental and electrical conditions, these inconsistencies are exacerbated. Factors such as manufacturing tolerances, uneven thermal environments, disparate aging rates, and differences in State of Charge (SOC) or State of Health (SOH) lead to performance divergence among individual cells. This divergence not only diminishes the overall usable capacity and power output of the battery energy storage system but also accelerates the degradation of weaker cells, potentially triggering thermal runaway and catastrophic failure. Therefore, accurate and timely recognition of consistency states is paramount for predictive maintenance, safety assurance, and optimizing the operational strategy of the battery energy storage system.
Traditional methods for assessing battery pack consistency often rely on analyzing a single modality of data, such as voltage trajectories during charge/discharge cycles or impedance spectroscopy. While insightful, these approaches have inherent limitations. Voltage-based methods can be insensitive to early-stage internal changes like lithium plating or minor electrolyte decomposition. Impedance-based techniques, though powerful, are difficult to implement in real-time within operational battery energy storage systems. Furthermore, these methods primarily capture electrochemical inconsistencies but may miss physical manifestations such as localized heating, casing deformation (swelling), or electrolyte leakage, which are direct indicators of severe inconsistency and safety hazards. This single-feature reliance creates a gap in achieving a holistic, real-time view of the battery energy storage system’s health, leading to suboptimal recognition accuracy and delayed fault intervention.
To address these shortcomings, this paper proposes a novel consistency state recognition technology for distributed Battery Energy Storage Systems based on the YOLOv7 (You Only Look Once version 7) object detection algorithm. The core innovation lies in the synergistic fusion of multi-modal data—electrochemical operational data and physical image data—processed and analyzed through a deep learning framework. Operational data (voltage, current, temperature) provides the internal electrical and thermal state, while image data from thermal and visual cameras captures external physical anomalies like hot spots and swelling. By leveraging YOLOv7’s efficient architecture for multi-scale feature extraction and enhancement via a feature pyramid network, the proposed method can diagnose and classify various consistency states—normal, localized overheating, casing deformation, and performance degradation/leakage—with high precision. This integrated approach offers a more comprehensive, real-time, and automated solution for monitoring the health of distributed battery energy storage systems.
Methodology
Multi-Modal Data Fusion for Distributed Battery Energy Storage Systems
The foundation of accurate state recognition is robust data acquisition. For a comprehensive assessment of a battery energy storage system, we deploy a sensor network comprising high-precision voltage/current transducers, temperature sensors (e.g., thermocouples or distributed fiber optic sensing), and imaging devices. The imaging suite includes infrared (IR) thermal cameras to capture temperature distribution and visible-light (RGB) cameras to monitor physical geometry and surface conditions. This setup generates two primary data streams: time-series operational data and two-dimensional image data.
Raw sensor data is inherently noisy. To enhance data quality, we apply distinct filtering techniques suited to each data type. For the time-series operational data $x(t)$ (e.g., cell voltages, currents), a moving average filter is employed:
$$
X_i = \frac{1}{n} \sum_{e=0}^{n-1} x(t – e)
$$
where $X_i$ is the filtered operational data point, $n$ is the filter window size, and $e$ is the offset within the window. This smoothing reduces high-frequency noise from measurement circuits.
For the 2D image data $I(i, j)$ (thermal or RGB), a 2D Gaussian filter is applied to reduce spatial noise and slight blurring, which can improve subsequent feature extraction:
$$
Y(i, j) = \sum_{a=-A}^{A} \sum_{b=-B}^{B} w(a, b) \cdot I(i+a, j+b)
$$
where $Y(i, j)$ is the filtered image pixel value, $w(a, b)$ is the Gaussian kernel function, and $A$, $B$ define the kernel dimensions. This step is crucial for obtaining clear thermal gradients and physical contours from the battery energy storage system components.
The core step is the fusion of these heterogeneous, filtered data streams. Direct concatenation is ineffective due to differing dimensionalities and scales. A weighted fusion strategy is adopted to combine the most salient information from each modality into a unified data representation $G_d$:
$$
G_d = \delta_x \cdot X + \delta_y \cdot Y(i, j)
$$
where $\delta_x$ and $\delta_y$ are the weighting coefficients for operational and image data, respectively, with $\delta_x + \delta_y = 1$. These weights can be adaptive or fixed based on the reliability of each data source; for instance, $\delta_x$ might be set higher (e.g., 0.55) to emphasize the primary electrical state, while $\delta_y$ (e.g., 0.45) incorporates critical visual cues. This fused data tensor $G_d$ serves as the enriched input for the subsequent deep learning model, providing a more complete picture of the battery energy storage system’s condition than any single modality could offer.
Consistency State Diagnosis Using the YOLOv7 Architecture
The fused multi-modal data $G_d$ is fed into the YOLOv7 network for consistency state diagnosis. YOLOv7 is chosen for its excellent balance of speed and accuracy in object detection tasks, which we adapt for “state detection” within the battery energy storage system data. The process begins with feature extraction through the network’s backbone, typically composed of convolutional (Conv) and pooling layers.
The convolutional layer operation for extracting preliminary features $Y_j$ can be represented as:
$$
Y_j = \sum_{m=0}^{M-1} \sum_{n=0}^{N-1} \sum_{p=0}^{P-1} W_{mnp} \cdot G_{d} + b_j
$$
where $W_{mnp}$ are the convolutional kernel weights, $M$, $N$, $P$ relate to input/output channels and kernel count, and $b_j$ is the bias term. Subsequent pooling layers ($C_h$) and non-linear activations further process these features. The resulting high-level feature representation $T_z$, encapsulating patterns related to inconsistency, is extracted:
$$
T_z = Q(C_h(w_c \cdot Y_j + b_c) + b_q)
$$
Here, $w_c$ and $b_c$ are pooling layer parameters, $Q(\cdot)$ represents the final feature output layer, and $b_q$ is its bias.
To effectively detect consistency states that manifest at different scales (e.g., a small hot spot vs. overall pack swelling), the extracted features $T_z$ are passed through a Feature Pyramid Network (FPN) module within YOLOv7. The FPN enhances multi-scale feature representation $T_z^*$ by combining features from different network depths:
$$
T_z^* = \sum_{z=1}^{Z} \left( F_a(F_b) \times T_z \right) \lambda_z
$$
where $F_a$ and $F_b$ are functions and parameters of the residual learning branches in the FPN, $\lambda_z$ is a scaling or attention coefficient for feature map $z$, and $Z$ is the total number of feature levels. This enhancement allows the model to be sensitive to both local fine-grained anomalies and global state changes within the battery energy storage system.
The enhanced features $T_z^*$ are then processed by the detection head. The head outputs bounding boxes (or, in our adaptation, state regions) and class probabilities for the detected states. The training of this network is driven by a composite loss function $L_s$ that measures the discrepancy between predictions and ground truth labels. A critical component for accurate localization in our context is an adaptation of the Complete Intersection over Union (CIoU) loss, which considers overlap area, center point distance, and aspect ratio:
$$
v_s = \frac{4}{\pi^2} \left( \arctan\left(\frac{a_c}{h_c}\right) – \arctan\left(\frac{a_p}{h_p}\right) \right)^2
$$
$$
L_s = 1 – r_s + \frac{d_s^2}{c_s^2} + \alpha_s v_s
$$
In this formulation, $r_s$ is the Intersection over Union (IoU) between the predicted state region and the ground truth, $d_s$ is the distance between their center points, $c_s$ is the diagonal length of the smallest enclosing box, and $v_s$ measures aspect ratio consistency. The term $\alpha_s$ is a weighting parameter. Minimizing $L_s$ during training forces the network to make precise classifications and localizations of consistency-related anomalies in the battery energy storage system data.
Finally, the network performs a classification of the battery’s real-time state $F_l$ based on the processed features and the learned decision boundaries. This can be conceptualized as a function of the enhanced features and the learned parameters:
$$
F_l = \sum_{g=1}^{r} \left[ \prod_{k=1}^{q} \beta_z \phi(d_k) + m_g \left(1 – \beta_z \phi(d_k)\right) \right] – \prod_{g=1}^{r} \left[ \beta_z \phi(d_k) L_s \right]
$$
where $\beta_z$ is a normalization factor, $\phi(\cdot)$ is a state function, $d_k$ are the battery state parameters, $m_g$ are neighborhood parameters, and $r$, $q$ relate to iterations and parameter counts. If $F_l$ exceeds a predefined threshold $\tau$, the battery is diagnosed as being in an “inconsistent state”; otherwise, it is classified as “normal.” This threshold $\tau$ is determined empirically during validation to balance sensitivity and false alarm rates for the battery energy storage system.
Recognition of Specific Consistency States
Diagnosing an inconsistent state is only the first step. The subsequent and crucial step is to identify the specific type of inconsistency present in the battery energy storage system. This is achieved by computing a quantitative Consistency State Value $Z_l$, which is derived from the enhanced feature maps $T_z^*$.
A key metric calculated is the temperature field contrast $H_z$, which quantifies the severity of thermal non-uniformity—a direct indicator of several failure modes. It is computed from the probability distribution $p(T_z^*)$ of thermal features across the image:
$$
H_z = -\sum_{z=1}^{Z} p(T_z^*) \log_2 p(T_z^*)
$$
A higher $H_z$ indicates greater disorder or unevenness in the temperature distribution. The final Consistency State Value $Z_l$ is a weighted composite score:
$$
Z_l = \gamma_z \frac{H_z}{F_l} + P_l
$$
where $\gamma_z$ is a weighting coefficient specific to the battery type or configuration within the energy storage system, and $P_l$ is a bias term accounting for baseline performance deviations.
Based on the calculated $Z_l$ value, the specific consistency state of the battery energy storage system is identified according to predefined intervals, each corresponding to a distinct physical condition:
| State Value Range ($Z_l$) | Identified Consistency State | Description & Rationale |
|---|---|---|
| (0.00, 0.50] | Normal State | All cell parameters (voltage, temperature) are within safe operating limits. The maximum allowable temperature difference between cells is within 5°C (per IEC 62619), which corresponds to a normalized value of 0.50 for the defined working range (-20°C to 55°C). |
| (0.50, 0.70] | Localized Overheating State | A localized temperature rise exceeding 15°C is detected (referencing UL 1973 thermal runaway propagation tests). This elevated thermal gradient, normalized and added to the base safety margin, triggers an alert. |
| (0.70, 0.90] | Casing Deformation (Swelling) State | Internal pressure buildup (e.g., >0.3 MPa from lithium plating or gas generation, as noted in standards like SAE J2928) causes visible casing deformation. This corresponds to a significant loss in volumetric energy density, normalized to a high state value. |
| (0.90, 1.00] | Performance Degradation / Leakage State | Severe inconsistency leading to critical failure modes such as electrolyte leakage, drastic capacity fade, or imminent internal short circuit. This represents the most hazardous operational state for the battery energy storage system. |
This quantitative, threshold-based recognition framework enables automated, precise, and actionable classification of faults within the distributed battery energy storage system.
Experimental Validation and Results
To validate the proposed methodology, experiments were conducted on a real-world 900 kW lithium-ion Battery Energy Storage System. The system structure comprised 10 parallel battery strings, with each string containing 100 individual cells connected in series.
The specifications for a representative single cell within this battery energy storage system are summarized below:
| Parameter | Value |
|---|---|
| Nominal Voltage | 3.2 V |
| Rated Capacity | 280 Ah |
| Maximum Continuous Discharge Rate | 0.5C |
| Recommended Charge Rate | 0.2C |
| Cycle Life (to 80% capacity) | >8000 cycles |
| Internal Resistance | ~20 mΩ |
| Operating Temperature Range | -20°C to 55°C |
This configuration resulted in a string voltage of 320V and a string capacity of approximately 89.6 kWh. The key parameters for the implemented YOLOv7 model are listed in the following table:
| Hyperparameter / Setting | Value |
|---|---|
| Input Image/Data Size | 640 × 640 pixels |
| Backbone Convolutional Layers | 4 (Customized CSPDarknet) |
| Feature Map Dimension | 160×160×128 |
| Pooling Kernel Size | 2×2 |
| Initial Learning Rate | 0.01 |
| Training Batch Size | 32 |
| Number of Training Epochs | 300 |
| Confidence Threshold for Detection | 0.50 |
The proposed method was compared against two established techniques from recent literature: a Charging Curve Conversion-based method (denoted as Comparative Method 1) and an Electrochemical Impedance Spectroscopy (EIS)-based method (denoted as Comparative Method 2). These represent state-of-the-art approaches relying on single-modal electrochemical data.
The primary metric for evaluation was the Intersection over Union (IoU) score between the identified anomalous state region (e.g., predicted hot spot or swelling area) and the ground truth region labeled by experts. IoU is a standard metric in object detection, with values closer to 1.0 indicating perfect alignment and higher recognition precision. Additionally, the overall recognition rate (accuracy) for different state types was calculated.
The loss function curve during the training of our YOLOv7-based model is shown below, indicating stable convergence:
$$ L_s \text{ started at approximately } 7.4 \text{ and decreased rapidly, stabilizing around } 2.8 \text{ after 120 epochs, which was selected as the optimal stopping point.} $$
The recognition results for the four consistency states across multiple test runs are summarized in the following aggregated performance table. The proposed method demonstrated a consistently high recognition rate.
| Consistency State | Average Recognition Rate (Proposed Method) | Average Recognition Rate (Comp. Method 1) | Average Recognition Rate (Comp. Method 2) |
|---|---|---|---|
| Normal State | 0.99 | 0.92 | 0.88 |
| Localized Overheating | 0.98 | 0.81 | 0.76 |
| Casing Deformation | 0.97 | 0.75 | 0.70 |
| Performance Degradation/Leakage | 0.96 | 0.72 | 0.68 |
| Overall Average | 0.98 | 0.80 | 0.76 |
The superior performance of the proposed method is directly attributable to its multi-modal data fusion strategy. While Comparative Method 1 (charging curve) struggles with faults not strongly reflected in voltage profiles during specific cycles, and Comparative Method 2 (EIS) is not suited for real-time, continuous monitoring, our approach integrates real-time thermal and visual cues. This allows it to detect physical anomalies like swelling or localized heating that purely electrical methods might miss until a much later stage, thereby achieving a higher overall recognition rate for the battery energy storage system’s health.
The quantitative comparison of localization precision, as measured by the IoU metric over 40 independent experimental trials, conclusively demonstrates the advantage of the proposed framework. The plot of IoU values shows that our method maintains a consistently high IoU, with a mean value of 0.97. In contrast, Comparative Method 1 achieved a mean IoU of 0.84, and Comparative Method 2 achieved 0.79. The enhanced feature extraction and multi-scale processing capabilities of YOLOv7, applied to the fused data, enable precise segmentation and identification of inconsistency regions, leading to this significant improvement in recognition accuracy for the battery energy storage system.
$$ \text{Mean IoU}_{\text{Proposed}} = 0.97, \quad \text{Mean IoU}_{\text{Comp1}} = 0.84, \quad \text{Mean IoU}_{\text{Comp2}} = 0.79 $$
Conclusion
This paper presented a novel and effective consistency state recognition technology for distributed Battery Energy Storage Systems (BESS) by integrating multi-modal data fusion with the advanced YOLOv7 deep learning architecture. The method addresses a critical gap in existing approaches by simultaneously analyzing electrochemical operational data and physical image data, providing a holistic view of system health. The weighted fusion of filtered voltage/current/temperature signals with thermal and visual images creates a rich input dataset. The YOLOv7 network, with its efficient backbone and feature pyramid enhancement, excels at extracting and combining multi-scale features relevant to various failure modes. The defined composite loss function ensures accurate state localization and classification.
The experimental validation on a 900 kW lithium-ion BESS demonstrated the method’s superior performance. It achieved an overall consistency state recognition rate of 98% and a mean Intersection over Union (IoU) score of 0.97, significantly outperforming traditional single-modal methods based on charging curves or electrochemical impedance. The technology successfully identifies and distinguishes between key consistency states: normal operation, localized overheating, casing deformation, and performance degradation/leakage.
In practical application, this technology enables real-time, automated monitoring of distributed battery energy storage systems. It facilitates early warning of potential faults, allows for predictive maintenance scheduling, and helps prevent the propagation of inconsistencies that could lead to safety hazards or system failure. By improving the reliability and safety of BESS operations, this work contributes to the broader integration of renewable energy and the stability of modern smart grids. Future work may focus on extending the method to prognosticate the remaining useful life under inconsistent conditions and adapting the model for edge-computing deployment within battery management systems (BMS) for fully autonomous operation.