
As large-scale photovoltaic power stations are increasingly integrated into the power grid, the dynamic behavior of solar inverters during grid faults becomes critical for system stability. Solar inverters must exhibit low-voltage ride-through (LVRT) and high-voltage ride-through (HVRT) capabilities to support the grid during disturbances. Accurate models and parameters of solar inverters are essential for transient stability analysis and grid planning. However, manufacturers often provide black-box electromagnetic simulation models without disclosing internal control structures. To address this, we propose a systematic testing and parameter identification method for solar inverter fault models under both symmetrical and asymmetrical voltage sags and swells. By designing a comprehensive fault set covering voltage disturbances from 20% to 130% of nominal voltage with 1% step resolution, we extract the control characteristics of a commercial solar inverter model provided by a manufacturer. Using least-squares fitting, we identify the parameters of the PSD‑BPA electromechanical transient model. The identified model is validated through time-domain simulations, demonstrating high accuracy. This work supports utilities in obtaining reliable solar inverter models for system studies.
This paper is organized as follows. Section 1 describes the solar inverter model including the photovoltaic array, inverter steady-state and fault ride-through control. Section 2 presents the symmetrical and asymmetrical fault testing methodology and the resulting datasets. Section 3 details the parameter identification process and provides the identified control strategies in mathematical form. Section 4 concludes the study.
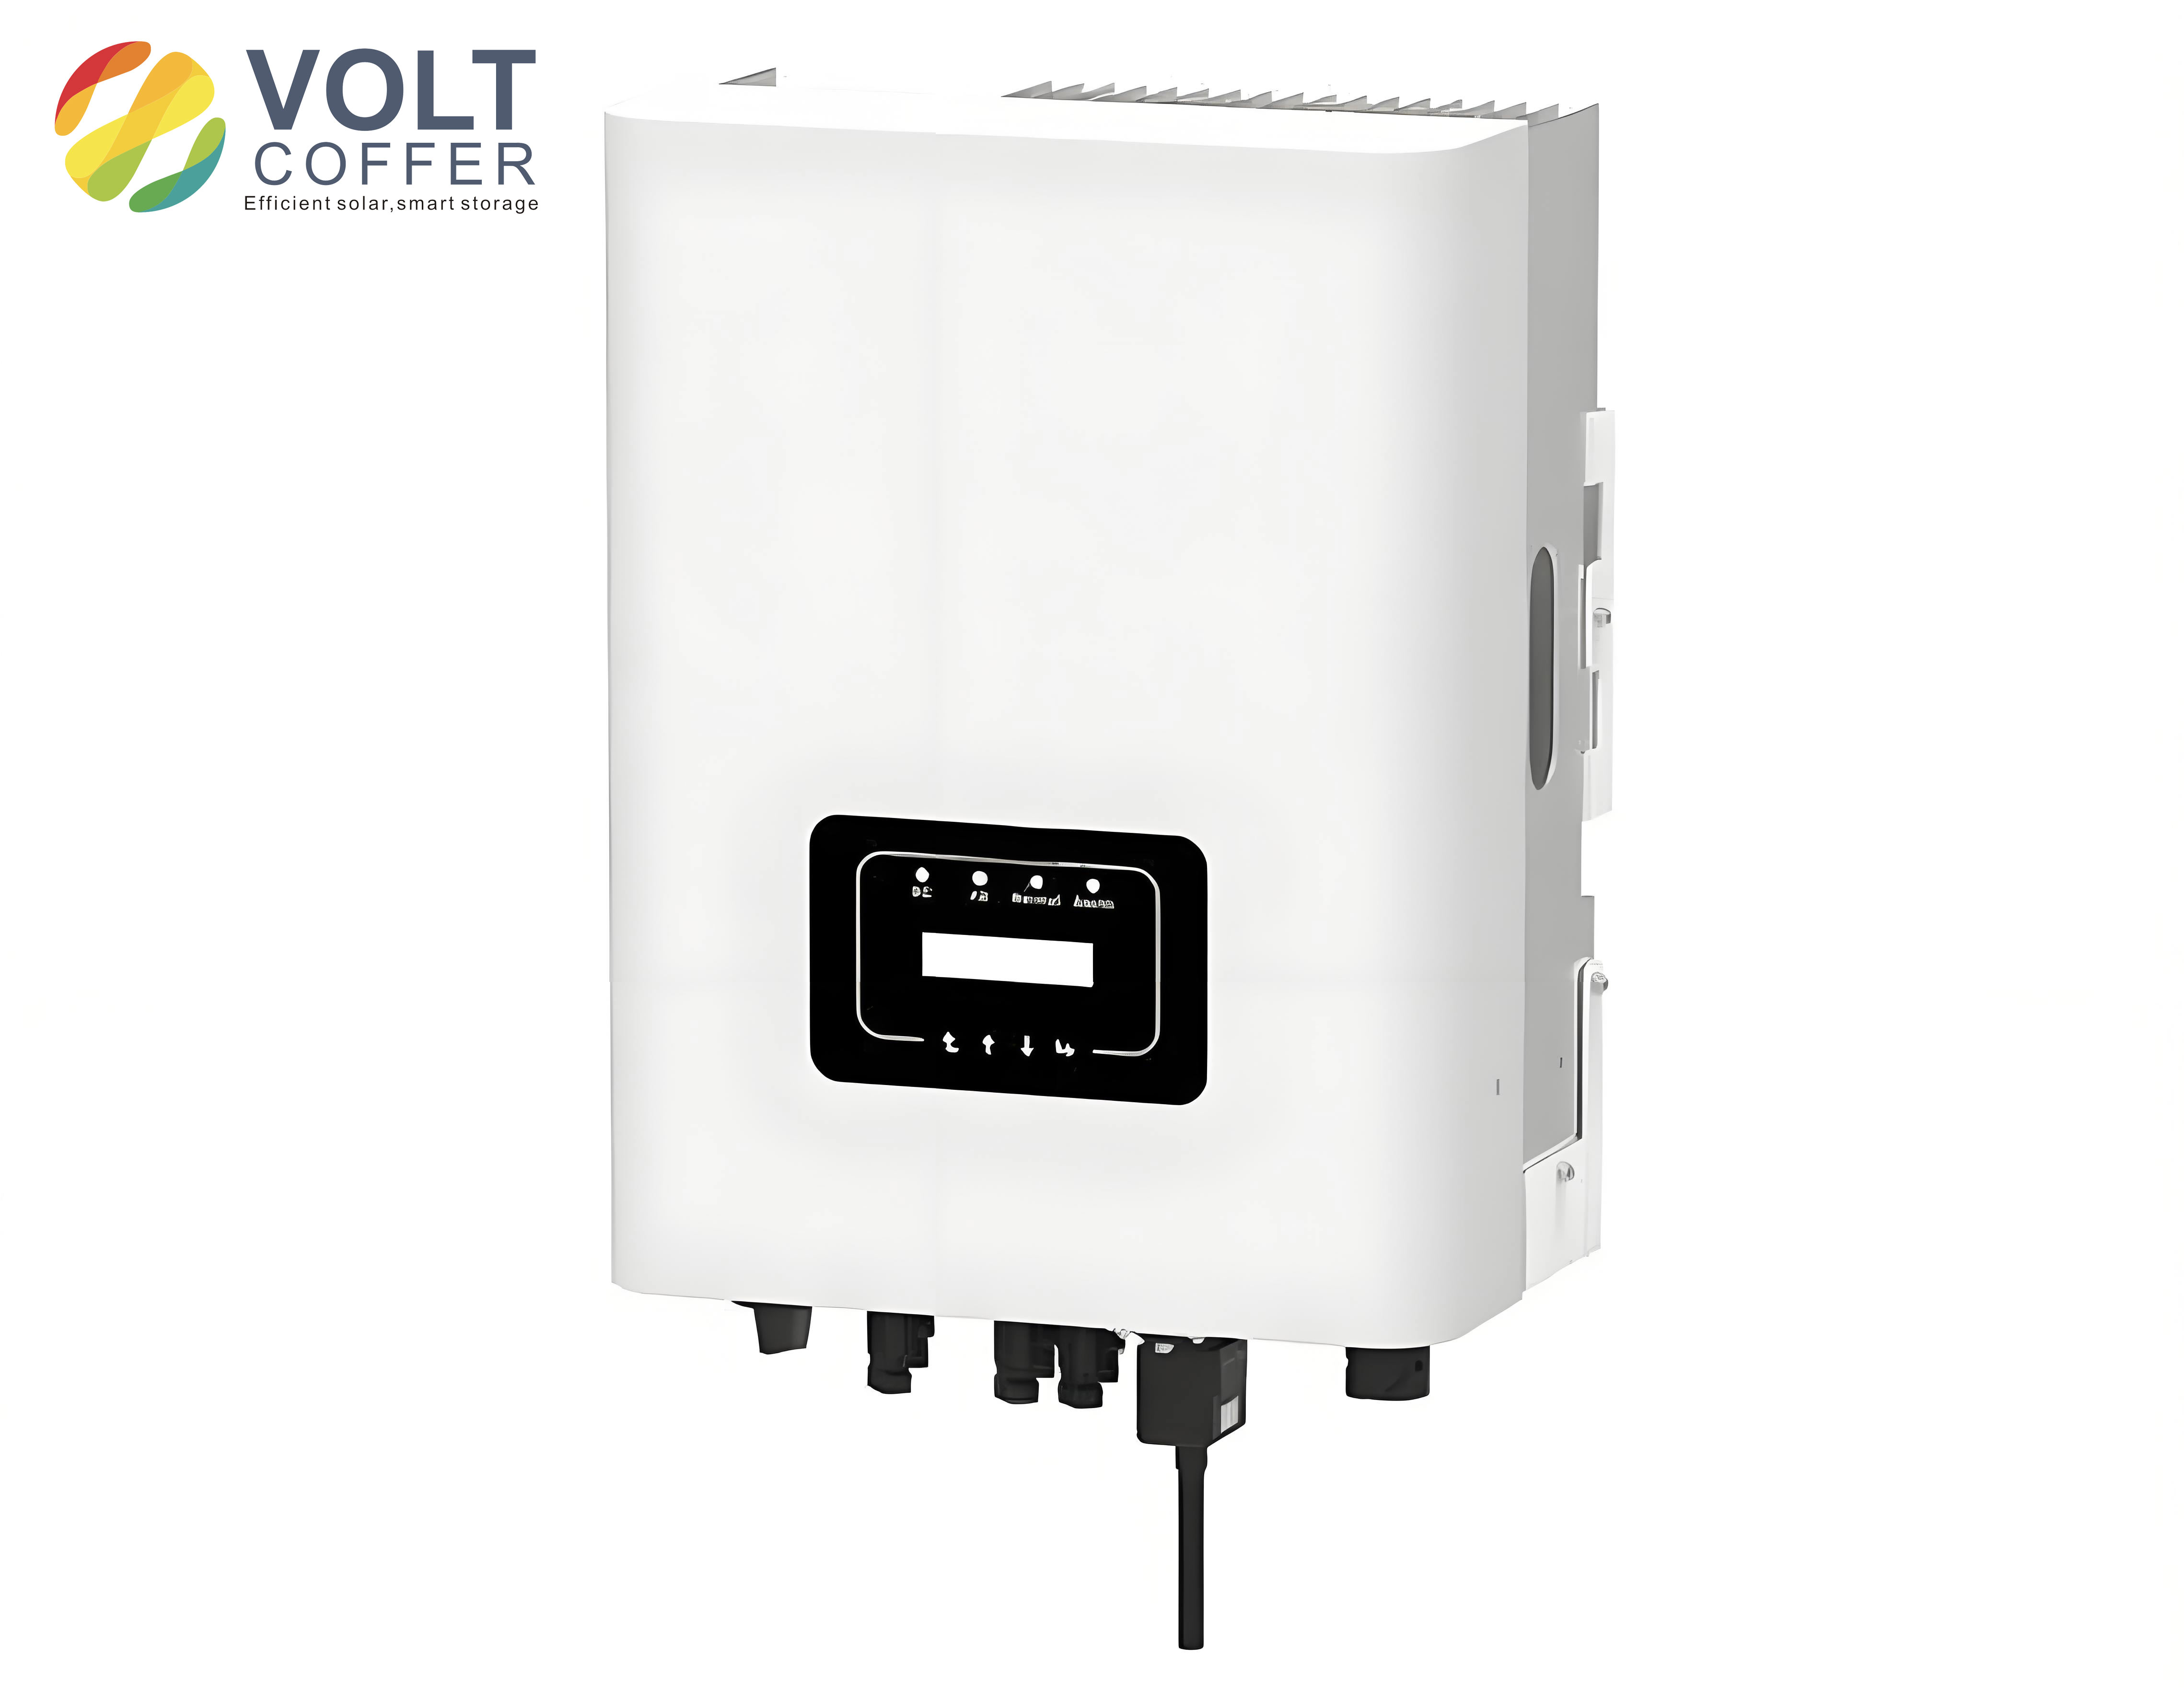
1 Solar Inverter Model for Voltage Ride-Through
The electromechanical transient model of a grid-connected solar inverter in PSD‑BPA consists of several modules: photovoltaic array model, inverter steady-state active/reactive power control, current limitation, fault ride-through control (LVRT and HVRT), and protection system. This study focuses on the fault ride-through power control. The photovoltaic array is modeled using a single-diode equivalent circuit with engineering simplifications. The output current of a single photovoltaic cell under standard test conditions (temperature \(T_{\text{ref}} = 15^\circ\text{C}\), irradiance \(S_{\text{ref}} = 1000\ \text{W/m}^2\)) is given by:
$$
I_L = I_{\text{sc}} \left[ 1 – C_1 \left( \exp\left( \frac{V}{C_2 V_{\text{oc}}} \right) – 1 \right) \right]
$$
where the parameters \(C_1\) and \(C_2\) are defined as:
$$
C_1 = \left( 1 – \frac{I_m}{I_{\text{sc}}} \right) \exp\left( -\frac{V_m}{C_2 V_{\text{oc}}} \right)
$$
$$
C_2 = \left( \frac{V_m}{V_{\text{oc}}} – 1 \right) \left[ \ln\left( 1 – \frac{I_m}{I_{\text{sc}}} \right) \right]^{-1}
$$
For the array, series and parallel connections are accounted for by scaling factors \(N_{\text{se}}\) (series cells) and \(N_{\text{sh}}\) (parallel strings). The inverter control model includes normal operation and fault ride-through modes. During voltage sags, the active power control follows three phases: Phase A (during the sag), Phase B (post‑sag hold), and Phase C (power recovery). The corresponding control flags in PSD‑BPA are summarized in Table 1.
| Phase | Flag | Control Mode | Command |
|---|---|---|---|
| A (dip period) | IP_FLG = 0 | Specify current value | \(I_{P,\text{ref}} = K_V V_t + K_I I_{P0} + I_{\text{PSET}}\) |
| IP_FLG = 1 | Initial current percentage | \(I_{P,\text{ref}} = K_I I_{P0} + I_{\text{PSET}}\) | |
| IP_FLG = 2 | Specify power value | \(P_{\text{ref}} = K_P P_0 + P_{\text{SET}}\) | |
| IP_FLG = 3 | Initial power percentage | \(P_{\text{ref}} = K_P P_0 + P_{\text{SET}}\) | |
| B (hold period) | IP_FLG2 = 0 | Specify current value | \(I_{P,\text{ref}} = \min(K_I I_{P0} + I_{\text{PSET}}, I_{P0})\) |
| IP_FLG2 = 1 | Initial current percentage | Same as above | |
| IP_FLG2 = 2 | Specify power value | \(P_{\text{ref}} = \min(K_P P_0 + P_{\text{SET}}, P_0)\) | |
| IP_FLG2 = 3 | Initial power percentage | Same as above | |
| C (recovery) | IP_FLG3 = 0 | Immediate recovery | – |
| IP_FLG3 = 1 | Fixed slope ramp | Slope rate | |
| IP_FLG3 = 2 | Parabolic recovery | Time constant | |
| IP_FLG3 = 3 | Slope ramp with time | Time constant |
Similarly, the reactive power control during voltage ride-through consists of three phases: D (during sag), E (post-sag hold), and F (recovery). The strategies are listed in Table 2.
| Phase | Flag | Control Mode | Command |
|---|---|---|---|
| D (dip period) | IQ_FLG1 = 0 | Calculate current from voltage drop | \(I_{Q,\text{ref}} = K_V (V_{\text{SET}} – V_t) + K_I I_{Q0} + I_{\text{QSET}}\) |
| IQ_FLG1 = 1 | Specify curve | – | |
| IQ_FLG1 = 2 | Specify reactive power | \(Q_{\text{ref}} = K_Q Q_0 + Q_{\text{SET}}\) | |
| IQ_FLG1 = 3 | Initial reactive current | \(I_{Q,\text{ref}} = K_V (V_{\text{SET}} – V_t) + K_I I_{Q0} + I_{\text{QSET}}\) | |
| E (hold period) | IQ_FLG2 = 0 | Specify reactive current | \(I_{Q,\text{ref}} = \min(K_I I_{Q0} + I_{\text{QSET}}, I_{Q0})\) |
| IQ_FLG2 = 1 | Hold constant | Keep last value | |
| IQ_FLG2 = 2 | Exponential recovery | Time constant | |
| F (recovery) | IQ_FLG3 = 0 | Immediate recovery | Return to pre‑fault value |
| IQ_FLG3 = 1 | Hold value for a duration | Duration | |
| IQ_FLG3 = 2 | Exponential recovery | Time constant | |
| IQ_FLG3 = 3 | Slope ramp | Slope rate |
2 Symmetrical and Asymmetrical Fault Testing
To identify the parameters of the solar inverter fault control model, we performed extensive tests on a commercial solar inverter model provided by a manufacturer using a Matlab/Simulink electromagnetic simulation platform. Both symmetrical (three‑phase) and asymmetrical (phase‑to‑phase) faults were applied at various depths. The voltage magnitude at the point of common coupling (PCC) was swept from 0.071 p.u. to 1.28 p.u. in steps of approximately 0.01 p.u. For each voltage level, we recorded the steady‑state active power, reactive power, active current, and reactive current. Two operating conditions were considered: high power (initial active power near rated) and low power (initial active power at 20% of rated). All quantities are per‑unit based on the inverter rated capacity.
Table 3 presents the dataset obtained under symmetrical faults for the high‑power scenario. The first column is the positive‑sequence voltage amplitude, followed by active power, reactive power, active current, and reactive current.
| Positive Sequence Voltage (p.u.) | Active Power (p.u.) | Reactive Power (p.u.) | Active Current (p.u.) | Reactive Current (p.u.) |
|---|---|---|---|---|
| 0.072 | 0.072 | 0.072 | 0.072 | 0.072 |
| 0.266 | 0.0004 | 0.0020 | 0.282 | 0.0075 |
| 0.402 | 0.0002 | 0.0046 | 0.351 | 0.0114 |
| 0.628 | 0.0002 | 0.0073 | 0.338 | 0.0117 |
| 0.903 | 0.0002 | 0.9834 | 0.121 | 1.0885 |
| 1.188 | 0.0003 | 0.9857 | -0.047 | 0.8295 |
| 1.278 | 0.0006 | 0.9843 | -0.226 | 0.4341 |
Table 4 gives symmetrical fault data for the low‑power scenario.
| Positive Sequence Voltage (p.u.) | Active Power (p.u.) | Reactive Power (p.u.) | Active Current (p.u.) | Reactive Current (p.u.) |
|---|---|---|---|---|
| 0.072 | 0.0023 | 0.0086 | 0.082 | 0.1197 |
| 0.266 | 0.0003 | 0.0025 | 0.285 | 0.0093 |
| 0.402 | 0.0002 | 0.0050 | 0.351 | 0.0125 |
| 0.628 | 0.0002 | 0.0073 | 0.338 | 0.0116 |
| 0.901 | 0.0002 | 0.1984 | 0.124 | 0.2203 |
| 1.187 | 0.0004 | 0.1979 | -0.040 | 0.1667 |
| 1.277 | 0.0005 | 0.1984 | -0.222 | 0.1554 |
Table 5 shows asymmetrical (phase‑to‑phase) fault data for the high‑power case.
| Positive Sequence Voltage (p.u.) | Active Power (p.u.) | Reactive Power (p.u.) | Active Current (p.u.) | Reactive Current (p.u.) |
|---|---|---|---|---|
| 0.363 | 0.3294 | -0.0493 | 0.191 | -0.1358 |
| 0.496 | 0.2634 | -0.0293 | 0.263 | -0.0590 |
| 0.595 | 0.2139 | -0.0156 | 0.316 | -0.0262 |
| 0.749 | 0.1316 | 0.0002 | 0.268 | 0.0003 |
| 0.936 | 0.0336 | 0.9853 | 0.121 | 1.0524 |
| 1.130 | 0.0656 | 0.9827 | 0.062 | 0.8696 |
| 1.189 | 0.0946 | 0.9774 | -0.040 | 0.8219 |
Table 6 provides the asymmetrical fault data for the low‑power case.
| Positive Sequence Voltage (p.u.) | Active Power (p.u.) | Reactive Power (p.u.) | Active Current (p.u.) | Reactive Current (p.u.) |
|---|---|---|---|---|
| 0.363 | 0.3294 | -0.0512 | 0.190 | -0.1411 |
| 0.496 | 0.2634 | -0.0288 | 0.263 | -0.0582 |
| 0.595 | 0.2139 | -0.0153 | 0.316 | -0.0258 |
| 0.749 | 0.1316 | 0.0002 | 0.268 | 0.0002 |
| 0.934 | 0.0336 | 0.1974 | 0.124 | 0.2114 |
| 1.126 | 0.0658 | 0.1966 | 0.070 | 0.1746 |
| 1.187 | 0.0978 | 0.1906 | -0.038 | 0.1606 |
3 Parameter Identification and Validation
Based on the measured data, we identified the control strategy chosen by the manufacturer’s solar inverter for both symmetrical and asymmetrical faults. The PSD‑BPA model flags were determined by comparing the observed behavior with the control modes listed in Tables 1 and 2. For active power control under symmetrical faults, the best‑fit parameters are given in Table 7.
| Parameter | LVRT (Low Voltage) | HVRT (High Voltage) |
|---|---|---|
| IP_FLG1 | 2 | 1 |
| K_v | 0.000 | 1.000 |
| K_i | 0.090 | 0.000 |
| I_PSET (A) / P_SET (MW) | -27.1 | 0 |
| IP_FLG2 | 1 | 0 |
| K_i (Hold) | 0.400 | 0 |
| I_PSET (Hold) | 0 | 0 |
| TIM2 (s) | 0.000 | 0 |
| IP_FLG3 | 1 | 0 |
| Slope/Time constant | 12.000 | 0 |
From Table 7, the active control during LVRT uses Mode FLG1=2 (initial power percentage) with a coefficient \(K_i = 0.09\) and offset \(P_{\text{SET}} = -27.1\) (in per‑unit base). During HVRT, FLG1=1 (specify current) is used with \(K_v = 1.0\). The overall active current reference in LVRT region (0.1 p.u. ≤ Vt ≤ 0.9 p.u.) is fitted by the linear relation:
$$
I_{P,\text{ref}} = 0.09 I_{P0} + 0.104 \quad \text{(symmetrical LVRT)}
$$
For voltages above 0.9 p.u. (normal and HVRT), the solar inverter maintains the pre‑fault active current (i.e., \(I_{P,\text{ref}} = I_{P0}\)). In the HVRT region, the active current is reduced linearly with voltage slope 1.0. The recovery phase uses a fixed slope ramp with a rate of 12 p.u./s.
For asymmetrical faults, the identified active power parameters are shown in Table 8.
| Parameter | LVRT | HVRT |
|---|---|---|
| IP_FLG1 | 2 | 1 |
| K_v | 0.000 | 1.000 |
| K_i | 0.090 | 0.000 |
| I_PSET / P_SET | -135.0 | 0 |
| IP_FLG2 | 1 | 0 |
| K_i (Hold) | 0.400 | 0 |
| I_PSET (Hold) | 0 | 0 |
| TIM2 | 0.000 | 0 |
| IP_FLG3 | 1 | 0 |
| Slope/Time constant | 12.000 | 0 |
The corresponding active current reference for asymmetrical LVRT (0.1 p.u. ≤ Vt ≤ 0.93 p.u.) is:
$$
I_{P,\text{ref}} = 0.09 I_{P0} + 0.518 \quad \text{(asymmetrical LVRT)}
$$
The reactive power control parameters for symmetrical faults are listed in Table 9.
| Parameter | LVRT | HVRT |
|---|---|---|
| IQ_FLG1 | 3 | 3 |
| K_v | 1.501 | 1.610 |
| K_i | 0.000 | 0.000 |
| I_QSET (A) | 382.1 | 286.9 |
| V_SET (p.u.) | 0.900 | 1.100 |
| IQ_FLG2 | 0 | 0 |
| IQ_FLG3 | 0 | 0 |
The reactive current references are fitted by:
$$
I_{Q,\text{ref}} =
\begin{cases}
-1.501 (0.9 – V_t) + 0.124, & 0.1 \le V_t \le 0.9 \\
-1.610 (1.1 – V_t) + 0.020, & 0.9 \le V_t \le 1.3
\end{cases}
$$
For asymmetrical faults, the reactive parameters are given in Table 10.
| Parameter | LVRT | HVRT |
|---|---|---|
| IQ_FLG1 | 3 | 3 |
| K_v | 1.239 | 1.554 |
| K_i | 0.000 | 0.000 |
| I_QSET (A) | 457.7 | 269.3 |
| V_SET (p.u.) | 0.900 | 1.100 |
| IQ_FLG2 | 0 | 0 |
| IQ_FLG3 | 0 | 0 |
The corresponding reactive current reference for asymmetrical faults is:
$$
I_{Q,\text{ref}} =
\begin{cases}
-1.239 (0.9 – V_t) + 0.173, & 0.1 \le V_t \le 0.93 \\
-1.554 (1.1 – V_t) + 0.075, & 0.93 \le V_t \le 1.3
\end{cases}
$$
To validate the identified parameters, we implemented the solar inverter model in PSD‑BPA with the above settings and simulated the same fault conditions. The comparison between the measured responses (from the manufacturer’s electromagnetic model) and the PSD‑BPA simulation results showed that the maximum error in active and reactive power during the fault period was less than 2%, satisfying the requirements of GB/T 32892‑2016. Figure 1 (the image inserted earlier) illustrates the close match between the measured and simulated current trajectories for a representative symmetrical low‑voltage ride‑through event. The validation confirms that the identified model accurately captures the solar inverter voltage ride‑through characteristics.
4 Conclusion
In this work, we have presented a systematic methodology for testing and identifying the voltage ride‑through control parameters of a solar inverter. By designing a comprehensive fault set covering both symmetrical and asymmetrical disturbances with fine voltage resolution (1% steps from 20% to 130%), we extracted the full control characteristics of a commercial solar inverter model. Using least‑squares fitting, we identified the active and reactive power control strategies in the PSD‑BPA format. The identified parameters include the control flags, gains, setpoints, and recovery time constants. The resulting model is valid for a wide voltage range (0.1 p.u. to 1.3 p.u.) and accurately reproduces the dynamic responses observed in the manufacturer’s electromagnetic simulation. The validation against time‑domain simulations demonstrates the high fidelity of the identified model. This approach provides a practical means for grid operators to obtain reliable solar inverter models without requiring proprietary information from manufacturers. Future work will extend the method to other inverter topologies and consider frequency‑dependent behavior during islanding conditions.