
Energy management plays a vital role in the operation and performance of distribution networks, and it has been extensively investigated in the power engineering community. With the continuous evolution of intelligent optimization algorithms, the efficiency and accuracy of energy management have been greatly improved. However, the increasing penetration of clean energy sources introduces seasonal and geographical variability, which poses new challenges for distribution network management. In my research, I focus on two fundamental issues: first, how to unify heterogeneous data sets from different energy storage technologies into a coherent modeling framework; second, how to enhance optimization algorithms to cope with the intermittent nature of renewable generation and improve the resilience of distribution networks against unexpected disturbances. To address these issues, I propose a two-layer energy management model for hybrid energy storage systems. This model not only improves the efficiency of distribution network energy management and reduces operational costs, but also enhances system stability and the ability to handle emergency conditions. This article presents the complete methodology, key algorithmic contributions, and experimental validations of my research.
Introduction and Research Motivation
The increasing share of renewable resources in integrated energy systems brings substantial challenges to the stable operation of distribution networks. Renewable energy generation is random and fluctuating, and such uncertainty may lead to significant economic losses and even threaten system security. Hybrid energy storage systems, which combine power-type storage and energy-type storage, can complement each other’s strengths to improve response speed and extend battery lifetime. However, the seasonal and temporal characteristics of renewable energy make the storage process less stable. Therefore, it is urgent to investigate how to improve the stability of hybrid energy storage systems in energy management.
In the context of distribution networks, energy management aims to schedule distributed generators, flexible loads, and storage units so that the system satisfies user demand while maintaining safety, stability, and economic efficiency. Because distribution networks are directly connected to end users, any instability may cause huge economic losses and negative social impacts. Consequently, an efficient energy management system for hybrid energy storage systems is indispensable for modern power grids.
Through a comprehensive review of the existing literature, I identified several critical issues in current research:
- Data quality and completeness: Distribution network data suffer from multi-source heterogeneity, inconsistent measurement standards, and incomplete acquisition due to communication issues and harsh electromagnetic environments.
- Marginal efficiency degradation of hybrid storage: Traditional single-layer optimization models often produce suboptimal solutions when applied to hybrid energy storage systems, increasing operational costs by approximately 12–18%.
- Insufficient robustness: Many existing algorithms focus only on cost reduction and neglect dynamic stability, leading to poor performance under load fluctuations, renewable generation variations, and fault conditions.
To overcome these limitations, I have developed a two-layer energy management model for hybrid energy storage systems. The first layer uses a Long Short-Term Memory (LSTM) network for data-driven preliminary optimization. The second layer employs an optimal power flow (OPF) algorithm implemented in MATPOWER to refine the results. Through bidirectional iterative coordination, the model minimizes operational costs while maintaining robustness and stability. The main contributions of my research are threefold:
- I establish a comprehensive hybrid energy storage system model that includes both battery and supercapacitor storage, as well as renewable energy curtailment handling.
- I propose an improved particle swarm optimization algorithm, named IPSO, and integrate it with a back-propagation neural network to accurately predict battery state-of-charge (SOC), thereby expanding and enriching the available energy storage dataset.
- I design a two-layer optimization framework that combines LSTM and OPF to manage hybrid energy storage systems, resulting in significant cost reductions and improved stability under renewable energy fluctuations.
Fundamental Algorithms and Tools
Particle Swarm Optimization
Particle Swarm Optimization (PSO) is a population-based stochastic optimization technique inspired by the social behavior of bird flocks. In PSO, each particle represents a candidate solution in a D-dimensional search space. The velocity and position of particle \(i\) are updated using the following equations:
$$
v_{ij}(t+1) = \omega v_{ij}(t) + c_1 r_1 [p_{ij}^{\text{best}}(t) – x_{ij}(t)] + c_2 r_2 [g_{j}^{\text{best}}(t) – x_{ij}(t)]
$$
$$
x_{ij}(t+1) = x_{ij}(t) + v_{ij}(t+1)
$$
where \(\omega\) is the inertia weight, \(c_1\) and \(c_2\) are acceleration coefficients, \(r_1\) and \(r_2\) are random numbers in [0,1], \(p_{ij}^{\text{best}}\) is the personal best position of particle \(i\), and \(g_{j}^{\text{best}}\) is the global best position of the swarm. The inertia weight is crucial for balancing global and local search abilities. A large inertia weight facilitates global exploration, while a small one benefits local exploitation.
Optimal Power Flow and MATPOWER
Optimal power flow (OPF) determines the optimal operating state of a power system by controlling variables to minimize a certain objective function, such as generation cost or network losses, while satisfying all operational constraints. MATPOWER is an open-source MATLAB toolbox for power system analysis, supporting power flow calculations and OPF. The OPF problem can be formulated as a nonlinear constrained optimization problem. In my research, I use MATPOWER to solve the lower-layer optimization problem in the proposed two-layer energy management model.
The MATPOWER computation process includes the following steps:
- Formulating the bus admittance matrix \(\mathbf{Y}\) from network topology and line parameters.
- Initializing variables such as generator active power \(P_i\), reactive power \(Q_i\), voltage magnitude \(V_i\), and phase angle \(\theta_i\).
- Applying a genetic algorithm (GA) to iteratively optimize the control variables, evaluate fitness values, and perform crossover and mutation operations until convergence criteria are met.
To demonstrate the feasibility of MATPOWER for OPF, I have tested it with a public dataset from a regional power grid. The results showed that the total active power generation exactly matched the sum of load consumption and network losses, and all nodal voltages were within their allowable limits, validating the correctness of the OPF computation.
Data Collection and Preprocessing for Distribution Networks
High-quality data are essential for reliable energy management of hybrid energy storage systems. The data used in my research include battery management system (BMS) data, power conversion system (PCS) data, grid-side supervisory control and data acquisition (SCADA) data, environmental data, and user-side smart meter data. The collection workflow involves device-layer sensing, edge-layer processing, and cloud/data-center storage. However, several difficulties exist, such as large data volumes, high real-time requirements, communication constraints, data quality issues, and privacy concerns.
Data Cleaning Techniques
To handle missing values, anomalous values, duplicates, and inconsistent records, I applied various data cleaning techniques. For missing values, I used interpolation methods including linear interpolation, Lagrange interpolation, and spline interpolation. For anomaly detection, I adopted the 3\(\sigma\) rule, clustering-based outliers detection, and rule-based threshold filtering. Duplicate records were removed, and logical inconsistencies were corrected through validation rules. These steps ensure that the data fed into the energy management model are accurate and consistent.
Data Normalization and Preprocessing
After data cleaning, I performed standardization and normalization to eliminate scale differences. Several methods were considered:
- Z-Score Standardization: \(x^* = \frac{x – \mu}{\sigma}\), which converts data to a distribution with mean 0 and standard deviation 1.
- Robust Scaling: \(x^* = \frac{x – \text{median}}{\text{IQR}}\), which is insensitive to outliers.
- Min-Max Normalization: \(x^* = \frac{x – x_{\min}}{x_{\max} – x_{\min}}\), scaling data to a fixed range such as [0,1].
Additionally, data splitting was performed (e.g., 70% training, 15% validation, 15% testing), and data smoothing was applied using moving average, exponential smoothing, LOESS, and Gaussian smoothing to reduce noise while preserving main trends.
Case Study: China State Grid Renewable Energy Dataset
I used a real-world dataset provided by China State Grid for renewable energy forecasting competitions. The dataset contains wind farm and solar station data from multiple locations across northern, central, and northwestern China, covering different climate zones and terrains. The characteristics of the dataset are summarized in the following tables.
| Feature | Description | Unit |
|---|---|---|
| xWS | Wind speed at height x | m/s |
| xWD | Wind direction at height x | ° |
| Air_T | Dry-bulb air temperature at 1.5m | °C |
| Air_P | Atmospheric pressure at 1.5m | hPa |
| Air_H | Relative humidity at 1.5m | % |
| Station | Rated power (MW) | Average output (MW) |
|---|---|---|
| Wind farm 1 | 36 | 23.4 |
| Wind farm 2 | 200 | 72.7 |
| Wind farm 3 | 48 | 18.1 |
| Wind farm 4 | 60 | 17.4 |
| Wind farm 5 | 36 | 6.7 |
| Wind farm 6 | 36 | 28.8 |
I also applied boxplot analysis to identify outliers, using the standard criterion of 1.5 times the interquartile range beyond the quartiles. In addition, I computed Pearson correlation coefficients between features. For wind data, the correlation between wind speed and output power exceeded 0.9, while for solar data, the total solar irradiance had the highest correlation with power output, over 0.8. These findings guided the selection of important features for the energy management model.
Battery State-of-Charge Prediction Using IPSO-BP Algorithm
Battery state-of-charge (SOC) is a critical parameter in battery energy storage systems. Accurate SOC prediction improves battery efficiency and safety. In my research, I propose an improved particle swarm optimization (IPSO) algorithm combined with a back-propagation neural network (IPSO-BP) for SOC estimation. The PSO algorithm is improved in two aspects: adaptive inertia weight and updated particle movement strategy.
Improved Inertia Weight
Traditional PSO often uses a fixed inertia weight, which limits its flexibility. I therefore developed an improved adaptive inertia weight (IAIW) that integrates the benefits of exponential decreasing inertia weight (EDIW) and adaptive inertia weight (AIW). The proposed weight is calculated as:
$$
\omega(t) = \omega_{\text{start}} + (\omega_{\text{start}} – \omega_{\text{end}}) \cdot \frac{1}{1 + e^{b \cdot \frac{F_t(x)}{T_{\max}} \cdot 10 (t-1)}}
$$
where \(F_t(x)\) represents the fitness change trend, defined as:
$$
F_t(x) = \frac{\text{fit}_t(x) – \text{fit}_t^{\min}}{\text{fit}_t^{\text{average}} – \text{fit}_t^{\min}}
$$
This formulation allows the inertia weight to adapt according to the fitness landscape, improving both convergence speed and solution accuracy. I benchmarked several inertia weights on four standard test functions: Sphere, Griewank, Rastrigin, and Ackley. The experimental results are shown in the following table.
| Function | Metric | Constant | LDIW | QDIW | EDIW | AIW | IAIW |
|---|---|---|---|---|---|---|---|
| Sphere | Mean | 5.45e-10 | 3.27e-10 | 8.74e-10 | 3.45e-10 | 6.65e-10 | 2.85e-10 |
| Accuracy (%) | 82.5 | 87.1 | 92.4 | 97.0 | 97.3 | 98.6 | |
| Convergence | 88 | 102 | 95 | 100 | 90 | 93 | |
| Griewank | Mean | 7.87e-10 | 6.22e-10 | 8.75e-10 | 4.27e-10 | 8.09e-10 | 3.69e-10 |
| Accuracy (%) | 7.9 | 10.6 | 15.9 | 30.4 | 40.6 | 50.9 | |
| Convergence | 147 | 185 | 166 | 162 | 152 | 157 | |
| Rastrigin | Mean | 56.6 | 54.3 | 50.2 | 45.8 | 52.3 | 30.7 |
| Accuracy (%) | 12.6 | 15.3 | 21.4 | 39.8 | 47.2 | 51.6 | |
| Convergence | 125 | 148 | 139 | 143 | 130 | 133 | |
| Ackley | Mean | 5.43e-10 | 3.87e-10 | 6.26e-10 | 5.13e-10 | 8.09e-10 | 3.69e-10 |
| Accuracy (%) | 88.5 | 88.7 | 91.3 | 94.2 | 95.0 | 95.9 | |
| Convergence | 136 | 168 | 155 | 161 | 148 | 152 |
The results clearly show that the proposed IAIW inertia weight achieves the best average fitness and accuracy on all test functions, while maintaining a reasonable convergence speed.
Improved Update Strategy
In standard PSO, particles update their velocities based on their own historical best and the global best. However, this can lead to premature convergence and loss of diversity. I introduced a modified update rule in which each particle can learn from the personal best of other particles in a dimension-wise manner. The velocity update equation becomes:
$$
v_{ij}(t+1) = \omega v_{ij}(t) + c_1 \cdot \text{rand} \cdot \left[ p_{f(j)}^{d,\text{best}} – x_{ij}(t) \right]
$$
where \(p_{f(j)}^{d,\text{best}}\) is the personal best of a selected particle \(f(j)\) in dimension \(d\). The learning probability \(p_i\) is adaptive:
$$
p_i = 0.05 + 0.45 \cdot \frac{1}{e^{10(i-1)/(N-1)} – 1} \cdot \frac{1}{e – 1}
$$
This strategy enhances diversity and helps the algorithm escape from local optima.
IPSO-BP for SOC Prediction
The IPSO-BP algorithm first initializes the weights and biases of a BP neural network. The IPSO optimizer then iteratively updates these parameters by minimizing the mean squared error (MSE) between predicted and actual SOC values. The training process is carried out on a dataset from the Oxford University battery intelligent laboratory, which contains voltage, current, temperature, and capacity measurements for lithium-ion batteries over their lifetime.
I compared three methods: BP neural network, PSO-BP, and IPSO-BP. The mean square errors (MSE) during training, validation, and testing are shown in the following table.
| Algorithm | Minimum MSE | Gradient | Variance |
|---|---|---|---|
| BP | 2.6082e-6 | 1.5771e-4 | 1.7511e-4 |
| PSO-BP | 5.5971e-6 | 6.3417e-5 | 2.3355e-4 |
| IPSO-BP | 2.0948e-6 | 3.6330e-5 | 2.0324e-4 |
After running 100 repeated experiments, I computed the average MSE for each algorithm. The results are presented below.
| Algorithm | Mean MSE | Mean Gradient | Variance |
|---|---|---|---|
| BP | 6.1756e-6 | 1.8542e-4 | 1.7511e-4 |
| PSO-BP | 3.0973e-6 | 5.8431e-5 | 2.3355e-4 |
| IPSO-BP | 2.8925e-6 | 2.1167e-5 | 2.0324e-4 |
The IPSO-BP algorithm reduced the average MSE by 52.56% compared to PSO-BP, from \(6.0973 \times 10^{-6}\) to \(2.8925 \times 10^{-6}\). Moreover, the SOC prediction curves produced by IPSO-BP were smoother and more stable than those from the other two methods. This improvement is crucial for accurately expanding the energy storage dataset and for ensuring reliable data for the subsequent energy management system.
Modeling of Hybrid Energy Storage System
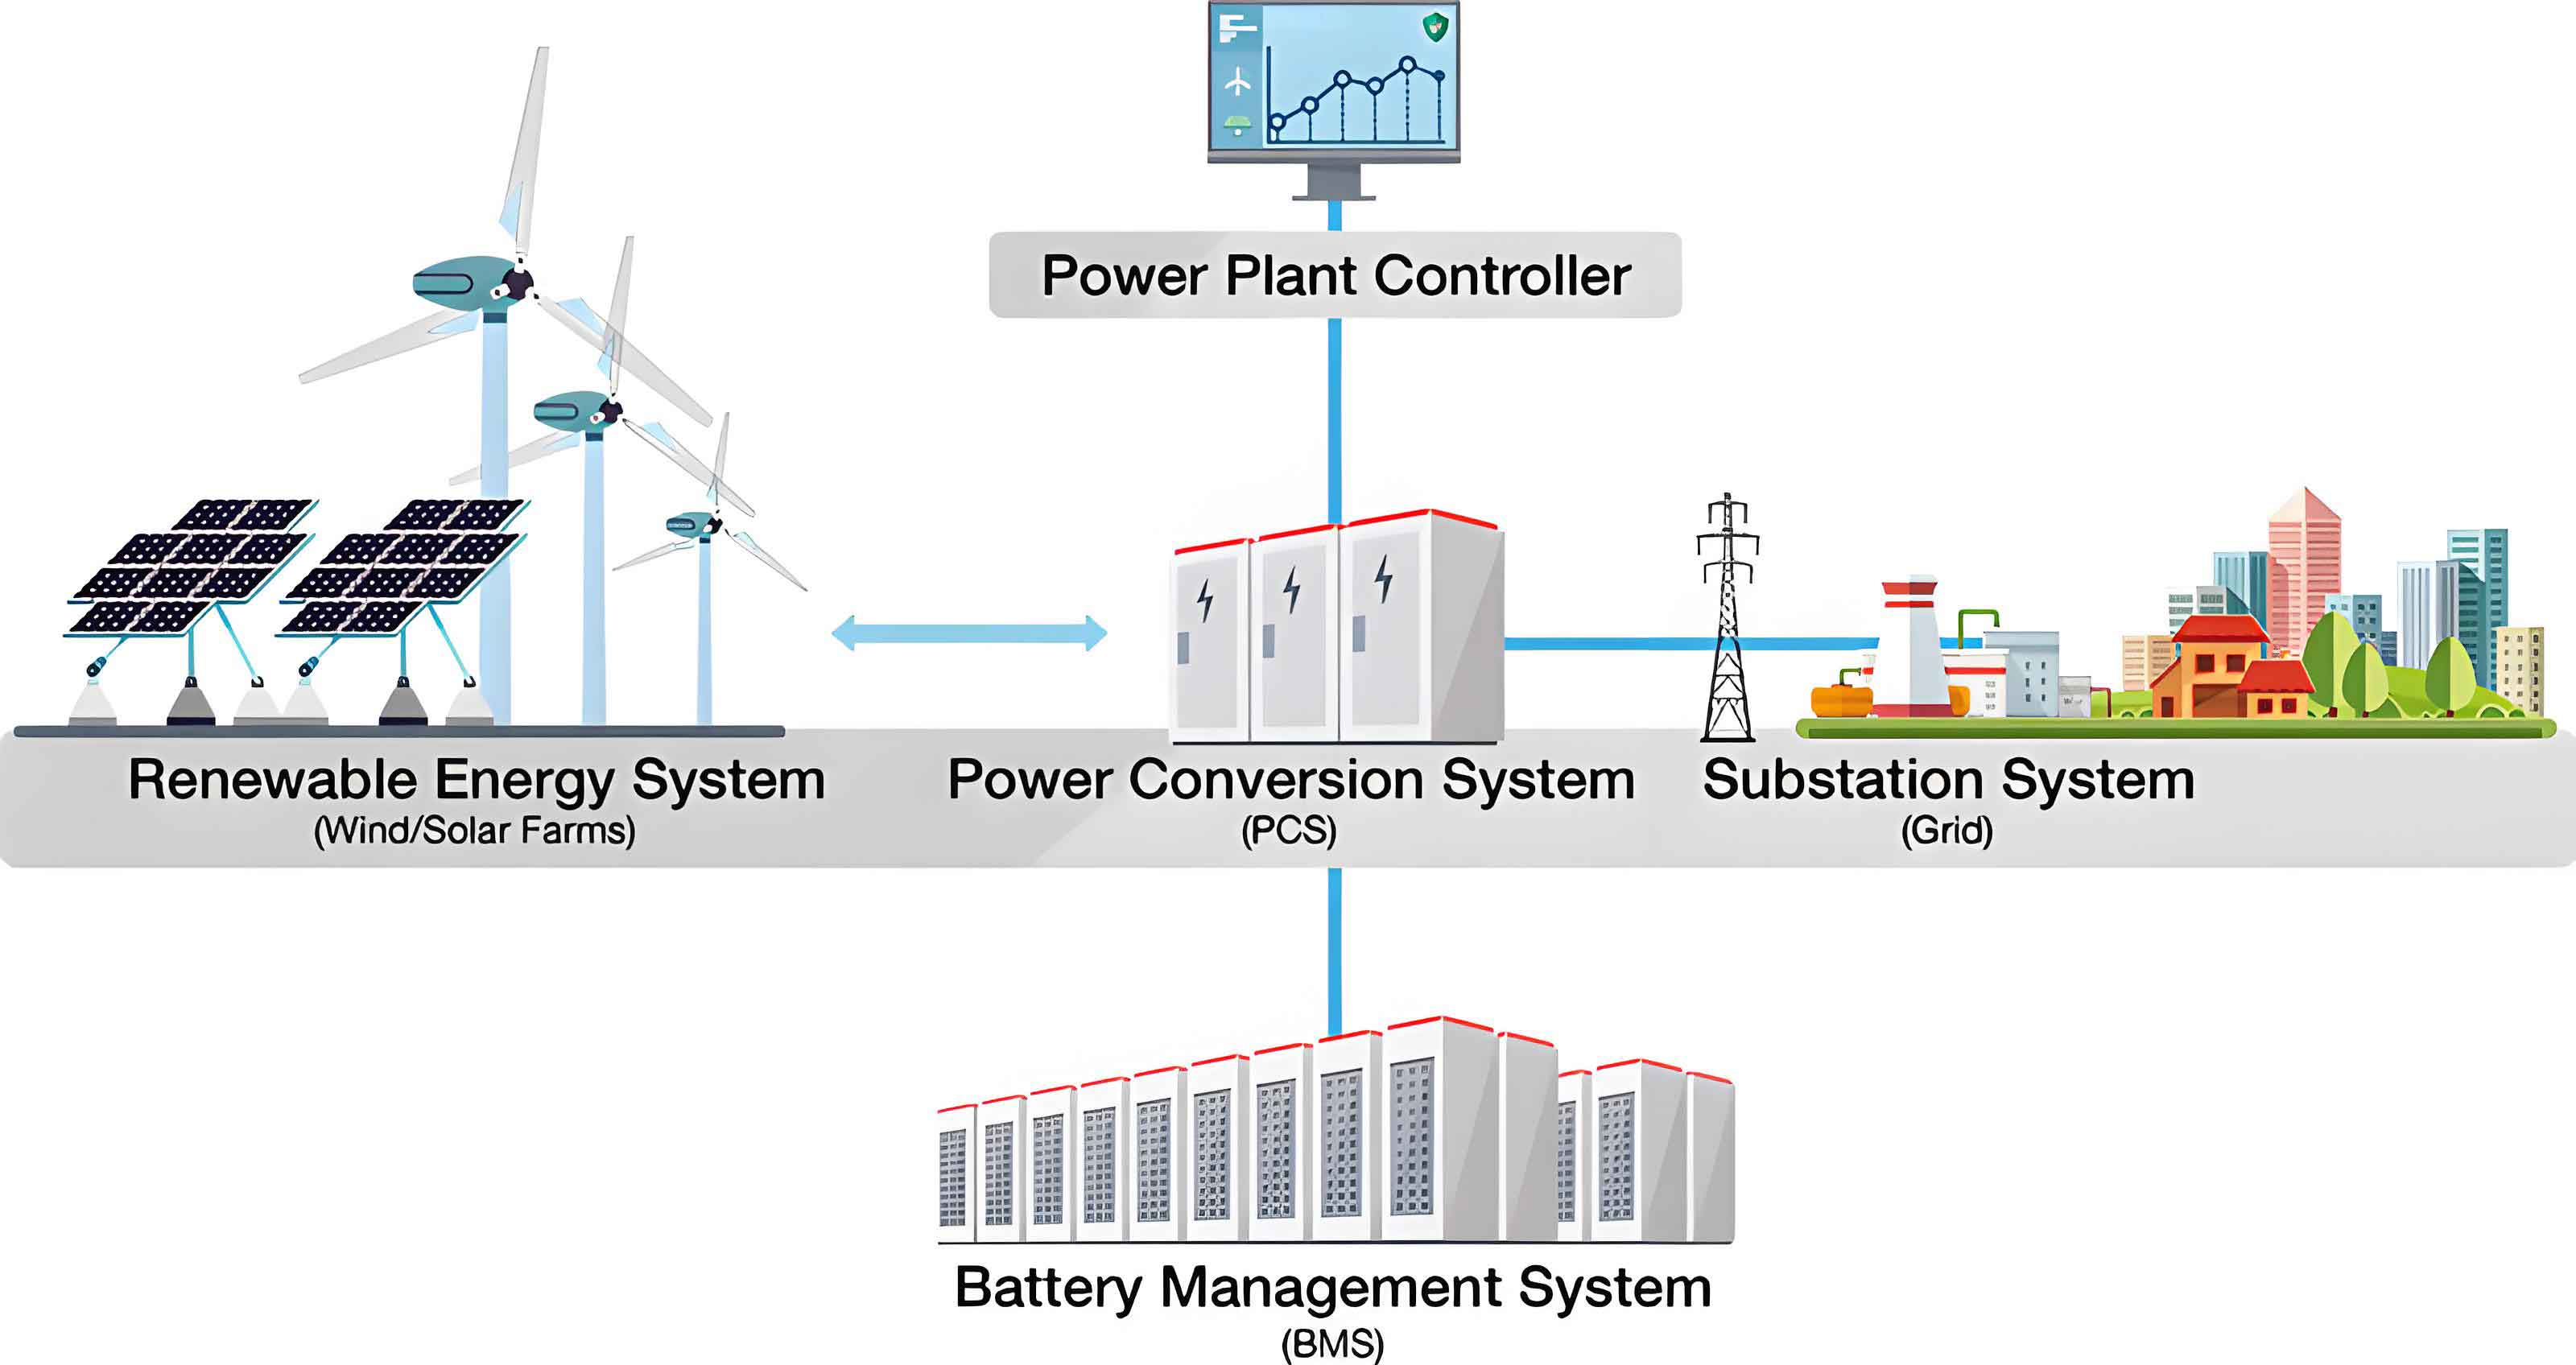
I built a hybrid energy storage system model that integrates multiple storage devices, including a lithium-ion battery, a supercapacitor, and renewable energy sources such as photovoltaic and wind power. The model also accounts for the public power grid and various loads. This configuration is suitable for distribution networks because it leverages the complementary characteristics of different storage technologies.
Battery Storage Model
The lithium-ion battery is represented by its stored energy \(E_B(t)\) and power \(P_B(t)\). The discrete-time state equation is:
$$
E_B(t) = \begin{cases}
E_B(t-1) – \frac{P_B(t) \Delta t}{\eta_{B,c}}, & P_B(t) \leq 0 \\[6pt]
E_B(t-1) – \frac{P_B(t) \Delta t}{\eta_{B,d}}, & P_B(t) > 0
\end{cases}
$$
Here, \(\eta_{B,c}\) and \(\eta_{B,d}\) are the charging and discharging efficiencies, respectively. To prevent overcharge and overdischarge, the battery power and state-of-charge (SOC) are constrained as:
$$
P_{B,\min} \leq P_B(t) \leq P_{B,\max}
$$
$$
SOC_{B,\min} \leq \frac{E_B(t)}{E_{B,\text{rated}}} \leq SOC_{B,\max}
$$
Supercapacitor Storage Model
The supercapacitor model is similar but with faster response and longer cycle life. Its energy equation is:
$$
E_{SC}(t) = \begin{cases}
E_{SC}(t-1) – \frac{P_{SC}(t) \Delta t}{\eta_{SC,c}}, & P_{SC}(t) \leq 0 \\[6pt]
E_{SC}(t-1) – \frac{P_{SC}(t) \Delta t}{\eta_{SC,d}}, & P_{SC}(t) > 0
\end{cases}
$$
Discharge and SOC constraints are also applied. The supercapacitor is especially useful for handling transient power fluctuations and reducing stress on the battery.
Renewable Energy Curtailment
Renewable energy sources such as wind and solar are intermittent and may produce more power than the grid can absorb, leading to curtailment. To avoid wasting such energy, the excess power can be redirected to the traditional storage units. The power balance equation for the entire system is:
$$
P_L(t) = P_M(t) + P_B(t) + P_{SC}(t) + \eta_{PV} P_{PV}(t) + \eta_{WT} P_{WT}(t)
$$
where \(P_L\) is the total load, \(P_M\) is the grid power, \(P_B\) and \(P_{SC}\) are battery and supercapacitor powers, \(P_{PV}\) and \(P_{WT}\) are photovoltaic and wind powers, and \(\eta_{PV}\), \(\eta_{WT}\) are their utilization factors that account for curtailment.
Operational Cost Modeling
The operational cost of the hybrid energy storage system includes degradation costs of the battery and the supercapacitor, as well as electricity purchase costs. These costs are used as the optimization objective in the two-layer energy management model.
Battery Degradation Cost
The battery cycle life depends on the depth of discharge (DOD). The maximum number of cycles is modeled as:
$$
L_B(d) = a \cdot e^{-b \cdot d} + c
$$
where \(a, b, c\) are fitting parameters. The DOD at time \(t\) for a time interval \(\Delta t\) is:
$$
DOD_B(\Delta t) = \frac{P_B(t) \Delta t}{E_{B,\text{actual}}(t)}
$$
The average degradation cost per unit discharged energy is:
$$
C_{B,\text{per-unit}} = \frac{C_B}{L_B(DOD) \cdot E_{B,\text{actual}}(t) \cdot 2 \cdot \eta_{B,c} \cdot \eta_{B,d}}
$$
where \(C_B\) is the replacement cost of the battery. For a complete charging/discharging event, the total degradation cost is:
$$
C_{B,\text{deg}} = C_{B,\text{per-unit}} \cdot P_B(t) \cdot \Delta t
$$
Supercapacitor Degradation Cost
The supercapacitor has a much longer lifetime and its degradation is treated as a linear function of time. The degradation cost over any interval is:
$$
C_{SC,\text{deg}} = \frac{C_{SC} \cdot \Delta t}{L_{SC}}
$$
where \(C_{SC}\) is the replacement cost and \(L_{SC}\) is the expected lifetime in hours. This simple yet effective model allows the optimization algorithm to coordinate both storage devices economically.
The Two-Layer Energy Management Model
The proposed two-layer energy management model aims to minimize the total operational cost while satisfying all technical constraints of the hybrid energy storage system. The model operates in two coordinated layers: an upper-layer LSTM-based optimization and a lower-layer OPF refinement.
Upper-Layer Optimization with LSTM
The upper layer uses a Long Short-Term Memory (LSTM) network to process the energy storage dataset and generate initial control signals. LSTM networks are well suited for time-series prediction and sequential decision making. The forget gate, input gate, output gate, and cell state update equations are:
$$
f_t = \sigma(W_f \cdot [h_{t-1}, x_t] + b_f)
$$
$$
i_t = \sigma(W_i \cdot [h_{t-1}, x_t] + b_i)
$$
$$
\tilde{C}_t = \tanh(W_C \cdot [h_{t-1}, x_t] + b_C)
$$
$$
C_t = f_t \odot C_{t-1} + i_t \odot \tilde{C}_t
$$
$$
o_t = \sigma(W_o \cdot [h_{t-1}, x_t] + b_o)
$$
$$
h_t = o_t \odot \tanh(C_t)
$$
where \(x_t\) is the input at time \(t\), \(h_{t-1}\) is the previous hidden state, \(C_t\) is the cell state, and \(\sigma\) is the sigmoid function. After preprocessing the data, the upper layer produces preliminary optimization results, including the scheduled power outputs of the battery, supercapacitor, and grid exchange, along with the corresponding error information.
Lower-Layer Optimization with OPF
The lower layer receives the upper-layer results as initial conditions and performs an optimal power flow computation using MATPOWER with a genetic algorithm (GA). The optimization problem is formulated as:
$$
\min \sum_{t} \left( C_{B,\text{deg}}(t) + C_{SC,\text{deg}}(t) + C_{\text{grid}}(t) \right)
$$
subject to power flow equations, generation limits, voltage limits, and energy storage constraints. The GA encodes generator outputs and storage dispatch decisions as chromosomes, evaluates their fitness using the OPF equations, and evolves the population through selection, crossover, and mutation. The iterative process continues until the convergence condition is satisfied.
Coordination Mechanism
The coordination between the two layers is based on a bidirectional iterative scheme. The upper layer sends its optimized power set-points to the lower layer; the lower layer refines these set-points by solving the OPF and feeds back the corrected values to the upper layer. The process repeats until the difference between consecutive iterations falls below a predefined threshold. This nested structure enhances the robustness against renewable energy fluctuations and significantly reduces the total operational cost.
Experimental Validation and Discussion
I conducted experiments using the China State Grid renewable energy dataset. The dataset includes daily load curves, wind and solar generation profiles, and time-of-use electricity prices. The key parameters used in the simulation are listed below.
| Parameter | Value |
|---|---|
| \(\eta_{B,c}\) | 0.95 |
| \(\eta_{B,d}\) | 0.90 |
| \(SOC_{B,\min}\) | 12% |
| \(SOC_{B,\max}\) | 92% |
| \(\eta_{SC,c}\) | 0.95 |
| \(\eta_{SC,d}\) | 0.90 |
| \(SOC_{SC,\min}\) | 10% |
| \(SOC_{SC,\max}\) | 90% |
| Battery lifetime coefficients | 4500, 1.45, 0.010 |
Stability Analysis
I compared the proposed two-layer model with three other methods: standard PSO, OPF, and distributed deep reinforcement learning (D-DRL). Figure 7 illustrates the error fluctuation during iterative optimization.
The fluctuation error of the proposed two-layer model was 4.53%, while PSO, OPF, and D-DRL had fluctuations of 9.58%, 8.85%, and 6.28%, respectively. The lower fluctuation indicates that the two-layer model provides more stable energy management for the hybrid energy storage system, which is important for handling unexpected events in the distribution network.
| Algorithm | Error fluctuation (%) |
|---|---|
| PSO | 9.58 |
| OPF | 8.85 |
| D-DRL | 6.28 |
| Two-layer model | 4.53 |
Computation Time
The convergence time of each algorithm is summarized in the following table. The proposed two-layer model achieved a convergence time of 867 seconds, which is comparable to PSO and significantly faster than OPF and D-DRL. Specifically, the convergence time was reduced by 49.62% compared to OPF and by 9.02% compared to D-DRL.
| Algorithm | Iterations | Convergence time (s) |
|---|---|---|
| PSO | 82 | 855 |
| OPF | 89 | 1721 |
| D-DRL | 92 | 953 |
| Two-layer model | 90 | 867 |
Cost Analysis
I evaluated the daily average operational cost for different time-of-use periods. The results are shown below.
| Time period | PSO (CNY 10⁴) | OPF (CNY 10⁴) | D-DRL (CNY 10⁴) | Two-layer (CNY 10⁴) |
|---|---|---|---|---|
| 00:00–08:00 | 256.33 | 202.13 | 187.39 | 127.02 |
| 08:00–11:00 | 27.69 | 24.58 | 20.11 | 14.55 |
| 11:00–18:00 | 379.26 | 300.48 | 279.56 | 189.77 |
| 18:00–22:00 | 34.59 | 30.87 | 25.64 | 20.14 |
| 22:00–24:00 | 14.63 | 12.98 | 10.55 | 8.73 |
In the peak-load period from 11:00 to 18:00, the proposed model reduced the average cost to 189.77 \(\times 10^4\) CNY, while the other algorithms exceeded 200 \(\times 10^4\) CNY. This demonstrates the economic advantage of the proposed energy management model for hybrid energy storage systems.
I also compared the seasonal average costs for four quarters. The results are presented below.
| Quarter | PSO (10⁷ CNY) | OPF (10⁷ CNY) | D-DRL (10⁷ CNY) | Two-layer (10⁷ CNY) |
|---|---|---|---|---|
| Q1 | 44.21 | 35.43 | 32.46 | 22.35 |
| Q2 | 91.02 | 72.95 | 66.84 | 46.01 |
| Q3 | 46.81 | 37.51 | 34.37 | 23.66 |
| Q4 | 78.01 | 62.52 | 57.29 | 39.44 |
The second and fourth quarters correspond to summer and winter, which have higher electricity demand. The proposed model successfully limited costs to below 50 and 40 million CNY, respectively, demonstrating its ability to handle seasonal challenges in the hybrid energy storage system.
Finally, I calculated the total annual cost for wind and solar energy integration. The results are summarized in the following table.
| Source | PSO (10⁷ CNY) | OPF (10⁷ CNY) | D-DRL (10⁷ CNY) | Two-layer (10⁷ CNY) |
|---|---|---|---|---|
| Wind | 119.51 | 97.87 | 90.55 | 61.04 |
| Solar | 140.55 | 110.55 | 100.43 | 70.43 |
| Total | 260.06 | 208.42 | 190.98 | 131.47 |
The total annual operational cost achieved by the proposed two-layer model was 131.47 million CNY, which is 49.62%, 37.02%, and 31.05% lower than PSO, OPF, and D-DRL, respectively. These results validate the economic and operational advantages of the proposed method for energy management in distribution networks with hybrid energy storage systems.
Conclusion and Future Work
In this article, I have presented a comprehensive two-layer energy management model for hybrid energy storage systems in distribution networks. The key contributions are summarized as follows:
- I established a detailed hybrid energy storage system model that integrates battery, supercapacitor, and renewable energy sources, while explicitly addressing energy curtailment.
- I proposed an IPSO-BP algorithm for accurate SOC prediction. The improved adaptive inertia weight and dimension-wise learning strategy significantly enhanced prediction accuracy and stability, with a 52.56% reduction in mean squared error compared to PSO-BP.
- I designed a two-layer optimization framework combining LSTM and OPF. The proposed model achieved a fluctuation error of 4.53%, significantly lower than PSO, OPF, and D-DRL. The annual operational cost was reduced by approximately 30–49%, demonstrating strong economic benefits.
Despite these improvements, there are several limitations and future research directions. First, the SOC prediction was validated only on a single battery dataset. Future work should consider the influence of temperature and other environmental factors on SOC and test the algorithm under diverse operating conditions. Second, the lower-layer OPF was solved using a genetic algorithm; other OPF solvers could be compared to further improve solution quality. Third, the two-layer interaction mechanism could be made more intelligent by incorporating AI-based negotiation strategies. Exploring more flexible multi-layer frameworks and applying them to larger, more complex distribution networks would also be valuable.
In conclusion, the proposed two-layer energy management model provides an effective and economically efficient solution for hybrid energy storage systems. It enhances stability under renewable energy variability and reduces operational costs, making it highly suitable for practical distribution network applications.