
In the field of building-integrated photovoltaics (BIPV), the operating temperature of solar panels significantly influences their electrical conversion efficiency. High temperatures lead to efficiency losses, with studies showing that each degree Celsius rise above standard test conditions reduces output by 0.2% to 0.5%. To mitigate this, a ventilated cavity between the solar panel backsheet and the roof surface can enhance convective heat transfer. This study presents a combined experimental and numerical investigation of the cooling effect of such a cavity on solar panels installed on a sloped roof. The work aims to quantify the impact of cavity height on the backplane temperature distribution and to identify optimal design strategies for improving heat dissipation.
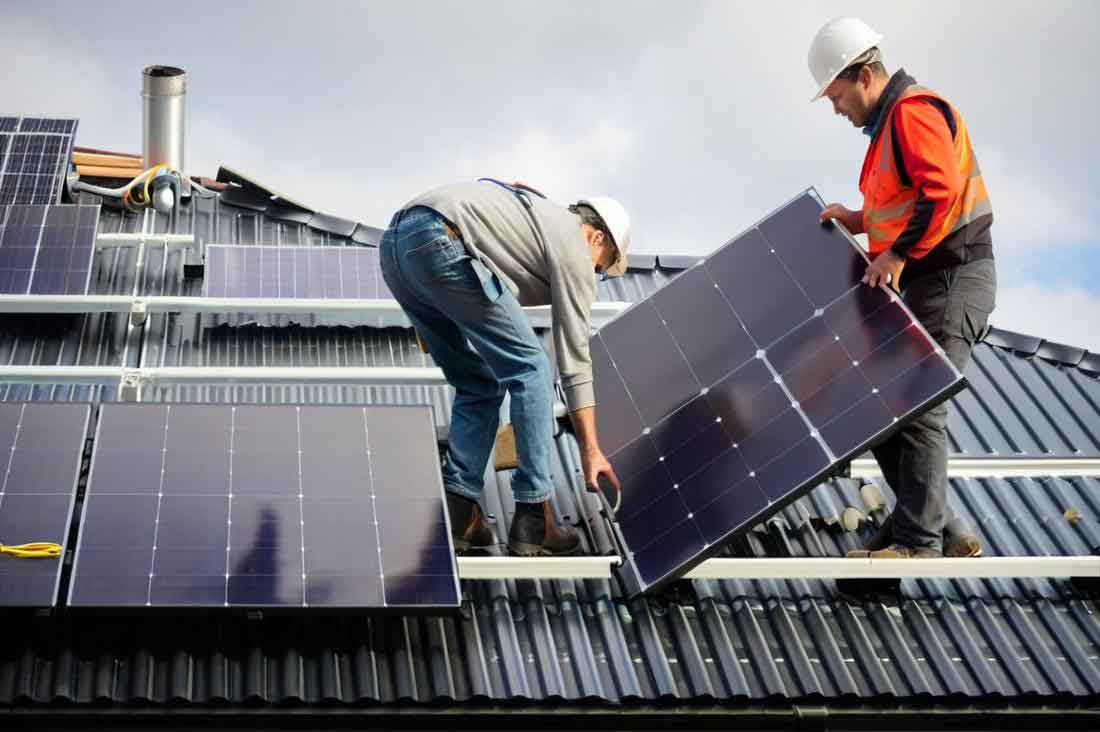
Field tests were conducted on a real BIPV installation located at a demonstration building in Shanghai. The roof orientation is south-facing with a tilt angle of 30°, matching the sloped roof. The solar panel array consists of thin-film modules, each measuring 1300 mm × 1100 mm × 15 mm, arranged in 8 columns and 4 rows. The ventilated cavity beneath the panels has a height of 10 cm, with horizontal gaps of 14 cm and vertical gaps of 8 cm. Infrared thermography was employed to capture the backplane temperature distribution during hot summer days. Two representative days are presented: July 24, 2015 (ambient temperature 33 °C, wind speed 2.9 m/s) and July 28, 2015 (ambient temperature 37 °C, wind speed 3.2 m/s). The measured average backsheet temperatures were 54.5 °C and 58.1 °C respectively, which are 21 °C to 25 °C above ambient. These values confirm that solar panels under real summer conditions operate far above their nominal operating cell temperature (NOCT) of about 46 ± 2 °C, emphasizing the need for effective cooling strategies.
To generalize the findings, a computational fluid dynamics (CFD) model was built using FLUENT. The model replicates the full-scale geometry of the solar panel array, including the ventilated cavity. Boundary conditions were set based on typical Shanghai summer conditions: solar irradiance of 850 W/m², ambient temperature of 33 °C, wind speed of 3.4 m/s from the southeast. The solar panel was modeled with an absorptivity of 0.9, cover transmittance of 0.85, and electrical power output of 150 W/m². The net heat flux absorbed by the panel was calculated as:
$$ G’ = \alpha \tau G – P_{el} $$
where \(G\) is the total solar irradiance, \(\alpha\) is absorptivity, \(\tau\) is transmittance, and \(P_{el}\) is the electrical power generated. The simulation assumed incompressible, turbulent flow with the standard k‑ε model. The accuracy of the CFD model was validated by comparing the predicted backplane temperature of a specific panel (4th column, 3rd row) with the infrared measurements. The simulated average temperature for that panel was 57.3 °C, while the measured values were 54.5 °C and 58.1 °C, yielding discrepancies of 4.8% and 0.7%, which are within acceptable limits.
After validation, the study extended to investigate the influence of cavity height. Four cases were simulated: 10 cm, 20 cm, 30 cm, and 40 cm. The table below summarizes the case parameters and the resulting average backplane temperatures for each row and column.
| Case | Cavity Height (cm) | Ra | Rb | Rc | Rd | C1 avg | C2 avg | C3 avg | C4 avg | C5 avg | C6 avg | C7 avg | C8 avg |
|---|---|---|---|---|---|---|---|---|---|---|---|---|---|
| Case1 | 10 | 56.8 | 58.2 | 59.7 | 61.5 | 48.2 | 56.1 | 52.3 | 51.0 | 53.4 | 55.8 | 58.7 | 61.9 |
| Case2 | 20 | 55.1 | 56.4 | 57.8 | 59.3 | 46.8 | 53.2 | 50.5 | 49.2 | 51.7 | 54.0 | 56.8 | 59.6 |
| Case3 | 30 | 53.6 | 54.9 | 56.1 | 57.4 | 45.6 | 50.7 | 48.9 | 47.6 | 50.2 | 52.4 | 55.1 | 57.7 |
| Case4 | 40 | 52.3 | 53.5 | 54.6 | 55.8 | 44.5 | 48.5 | 47.4 | 46.2 | 48.9 | 51.0 | 53.6 | 56.0 |
The results show that increasing cavity height has negligible effect on the front surface temperature of solar panels but significantly reduces the backplane temperature. For example, the overall average backplane temperature dropped from 58.7 °C (Case1) to 52.8 °C (Case4), a reduction of about 5.9 °C. The cooling effect is more pronounced on the panels near the windward side (columns 1–4) and diminishes along the flow direction. Interestingly, the temperature profile along the column direction exhibits an “S‑shaped” pattern: a sharp rise at column 2, followed by a drop at columns 3–4, and then a gradual increase toward column 8. This pattern is attributed to the flow development within the cavity. When the wind first enters the cavity, a turbulent mixing zone enhances heat transfer, but the heat is not immediately carried downstream, causing a local peak at column 2. After this initial zone, the flow stabilizes and the temperature decreases until the thermal boundary layer thickens, leading to a steady rise further downstream.
To quantify the effect of cavity height on the temperature distribution, the percentage of panel area within each temperature range was computed. Figure 1 (not shown here) illustrates that for the 40 cm cavity, the proportion of area below 50 °C increased by approximately 12% compared to the 10 cm case, while the area above 65 °C decreased by 15%. The “S‑shaped” region, which spans about 4.5 m in the wind direction (equivalent to 3–4 panel rows), benefits most from increased cavity height. In this region, every 10 cm increase in cavity height yields a temperature reduction of about 3–4 °C, whereas in the stabilized downstream region the reduction is only about 2 °C per 10 cm.
The strong cooling effect in the “S” zone suggests a design strategy: by intentionally creating gaps or changing the spacing between solar panel rows at intervals of about 4.5 m, one can repeatedly induce this enhanced heat transfer region, thereby lowering the overall backplane temperature. For instance, if a large array is divided into segments separated by wider gaps (e.g., 20 cm instead of 8 cm), each segment would have its own “S” zone, leading to more uniform and lower temperatures.
The following table summarizes the key quantitative findings from the simulation for the four cavity heights, including the maximum temperature reduction in the “S” zone and the overall average backplane temperature.
| Cavity Height (cm) | Overall Avg Backplane Temp (°C) | Max Temp Reduction in “S” Zone (°C) relative to Case1 | Downstream Stabilized Reduction per 10 cm (°C) |
|---|---|---|---|
| 10 | 58.7 | – | – |
| 20 | 55.6 | 2.9 | 1.8 |
| 30 | 53.2 | 5.4 | 1.9 |
| 40 | 52.8 | 7.6 | 2.1 |
From the above analysis, the following conclusions can be drawn:
- Ventilated cavities effectively reduce the backplane temperature of solar panels. Under the tested conditions, the backplane temperature was 21–25 °C above ambient, and increasing the cavity height from 10 cm to 40 cm lowered the overall average by about 6 °C.
- The cooling effect is not uniform along the wind direction. An “S‑shaped” thermal development region exists near the cavity entrance (extending about 4.5 m in this array), where temperature reductions are 3–4 °C per 10 cm increase in cavity height. Beyond this region, the reduction stabilizes at about 2 °C per 10 cm.
- Designers can exploit this phenomenon by intentionally introducing gaps or varying panel spacing at intervals of approximately 4.5 m to repeatedly create the “S” zone, thereby improving overall heat dissipation.
- The study is based on the specific climate of Shanghai and a sloped roof configuration. Future work should extend to other climate zones, roof types (flat roofs, different tilt angles), and wind directions to generalize the guidelines.
The numerical model was validated against field measurements, showing good agreement (error < 5%). This methodology can be used as a reliable tool for optimizing the design of BIPV systems, ultimately leading to higher electrical yields and longer lifespans for solar panels.
In practice, for solar panel arrays with long continuous rows, the “S” zone effect suggests that placing panels in segments separated by wider gaps (e.g., 20 cm instead of 8 cm) every 4–5 m could significantly reduce the peak temperatures. Such a design would require minimal additional cost but could improve annual energy production by 1–2% due to lower operating temperatures. Moreover, the increased ventilation may also reduce the risk of hot‑spot formation and extend module life.
In summary, this combined experimental and simulation study demonstrates that ventilated cavity height is a key parameter for cooling solar panels. The discovery of the “S‑shaped” thermal development region provides a new design opportunity to enhance heat transfer without increasing cavity height uniformly. By strategically placing gaps, the benefits of a tall cavity can be partially achieved even with a moderate cavity height, making the design more economical and practical for real BIPV projects.