
1. Introduction
The rapid development of renewable energy systems, such as wind and solar power, necessitates large-scale energy storage solutions. Among these, lithium-ion batteries—particularly lithium iron phosphate battery (LFP)—dominate the market due to their stability and safety. However, thermal runaway (TR) remains a critical safety challenge for LFP-based energy storage systems. During TR, batteries generate flammable gases (e.g., H₂, CO, VOC) and heat, leading to fires or explosions. Effective sensor-based monitoring is essential to mitigate these risks. This study evaluates the performance of multi-parameter composite sensors in detecting TR signatures and proposes optimized deployment strategies for lithium iron phosphate battery storage compartments.
2. Methodology
2.1 Sensor Design and Configuration
Five types of multi-parameter composite sensors (A–E) were developed, integrating detectors for H₂, CO, CO₂, VOC, smoke, temperature, and pressure. Key sensor specifications are summarized in Table 1.
Table 1: Sensor specifications and detection principles
| Parameter | Detection Principle | Range | Sensitivity | Accuracy | Lifetime (Years) |
|---|---|---|---|---|---|
| H₂ | Catalytic Combustion | 0–5,000 ppm | 0.05 µA/ppm | ≤5% FS | 10 |
| VOC | Photoionization | 0–10,000 ppm | 35 nA/ppm | ≤3% FS | 3 |
| CO | Electrochemical | 0–1,000 ppm | 0.1 mV/ppm | ≤2% FS | 2 |
| CO₂ | Infrared Optical | 0–5,000 ppm | 45 nA/ppm | ≤5% FS | 2 |
| Temperature | Thermocouple | 0–125°C | 0.32 mV/°C | ±0.1°C | 3 |
2.2 Experimental Setup
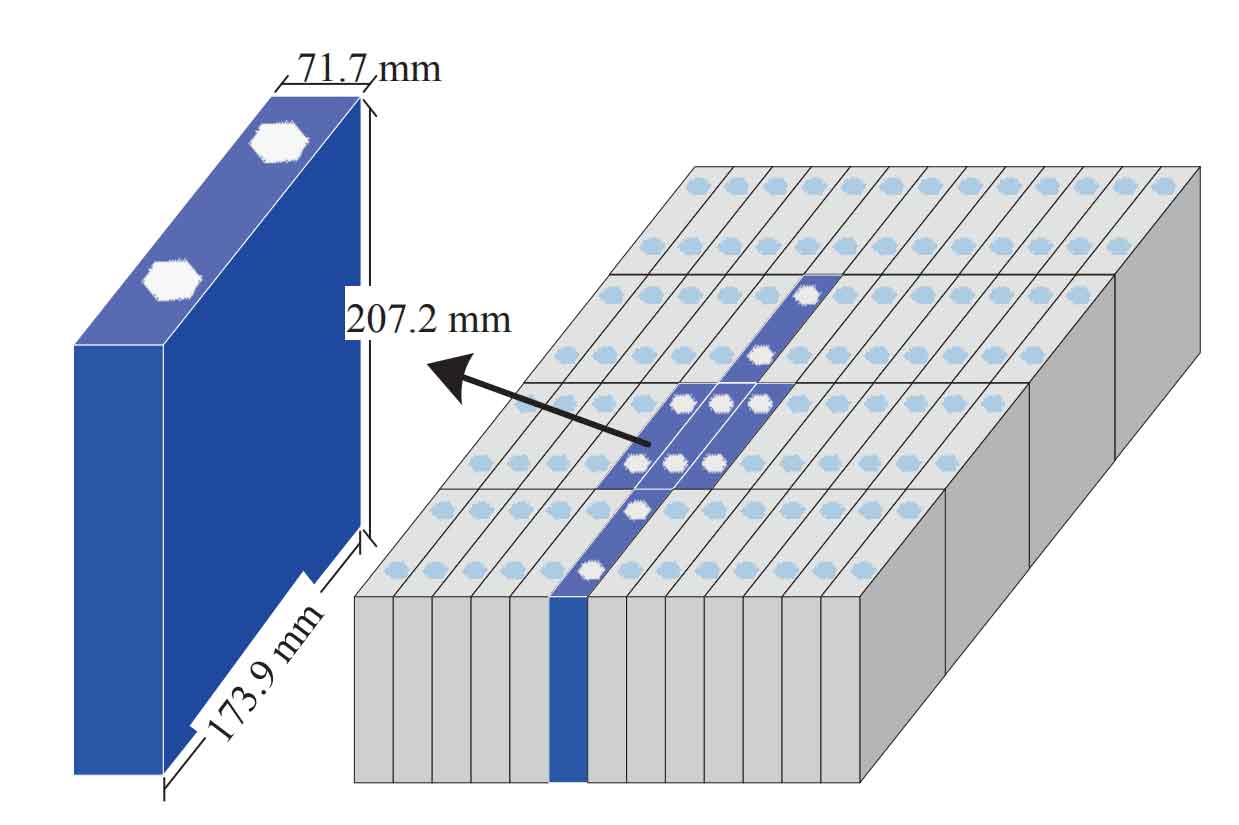
A 40-foot real-scale lithium iron phosphate battery compartment was used for TR simulations. Experiments included:
- Heating-induced TR: A 280 Ah lithium iron phosphate battery (LFP) was heated at 950 W until TR criteria (T ≥ 150°C or dT/dt ≥ 1°C/s) were met.
- Ignition vs. Non-ignition Tests: TR was triggered with/without spark ignition to study gas dynamics.
- Sensor Placement: Sensors were deployed at edge and central positions (2.4 m spacing) to evaluate detection latency and spatial propagation.
2.3 Data Analysis
Key metrics included:
- Response Time: Time elapsed between TR onset and sensor detection.
- Propagation Velocity: Calculated using Fick’s diffusion law:ρDABdYAdx+ρDBAdYBdx=0ρDABdxdYA+ρDBAdxdYB=0where DABDAB is the diffusion coefficient, YAYA and YBYB are gas mass fractions, and xx is distance.
3. Results and Analysis
3.1 Sensor Performance
- H₂ Detection: Catalytic combustion sensors detected H₂ 100 s faster than electrochemical sensors.
- VOC Detection: Photoionization sensors identified VOC 600 s earlier than solid-polymer electrochemical sensors.
- Sequence of Detection: VOC > H₂ > CO > Smoke > CO₂ (Fig. 1).
Table 2: Detection sequence and response time
| Gas | Earliest Detection Time (s) | Sensor Type |
|---|---|---|
| VOC | 750 | Photoionization |
| H₂ | 1,462 | Catalytic Combustion |
| CO | 1,665 | Electrochemical |
| CO₂ | 1,758 | Infrared Optical |
3.2 Impact of Ignition
- Non-ignition: VOC and H₂ concentrations peaked first, while temperature and pressure at the compartment ceiling remained unchanged.
- Ignition: CO, smoke, and CO₂ levels surged (Fig. 2), while VOC and H₂ decreased due to combustion.
Table 3: Parameter comparison (ignition vs. non-ignition)
| Parameter | Non-ignition | Ignition | Change Factor |
|---|---|---|---|
| VOC (ppm) | 10,000 | 5,778 | -43% |
| CO (ppm) | 684 | 1,000 | +46% |
| Smoke (mg/m³) | 4,801 | 10,000 | +108% |
| Temperature Rise | 0.10°C/min | 0.78°C/min | +680% |
3.3 Spatial Propagation
- Edge vs. Central TR: Edge-initiated TR exhibited faster gas propagation due to compartment geometry.
- Velocity Calculation:v=2400∣tn,e−tn+1,e∣(n=1,2,3,4)v=∣tn,e−tn+1,e∣2400(n=1,2,3,4)where vv = propagation velocity (mm/s), tt = detection time (s).
Table 4: Propagation velocities under different conditions
| Condition | H₂ (mm/s) | CO (mm/s) | VOC (mm/s) |
|---|---|---|---|
| Edge Heating | 28.26 | 29.57 | 21.30 |
| Central Heating | 23.48 | 27.21 | 15.41 |
| Ignition | 97.61 | 132.76 | 132.53 |
4. Discussion
4.1 Sensor Selection
- Catalytic Combustion H₂ Sensors: Faster response, longer lifespan (~10 years).
- Photoionization VOC Sensors: Superior early-warning capability but shorter lifespan (~3 years).
- CO₂ Sensors: Slow response but stable for post-TR monitoring.
4.2 Deployment Strategy
- Edge Zones: Optimal sensor spacing = 0.639–1.278 m.
- Central Zones: Optimal spacing = 0.924–1.846 m.
- Ceiling Placement: Effective for detecting post-ignition temperature rises.
4.3 Limitations
- VOC signals in early TR stages may originate from battery casing materials (e.g., PET films) rather than internal reactions.
- Pressure sensors showed limited utility in non-ignition scenarios.
5. Conclusion
This study demonstrates that catalytic combustion H₂ sensors and photoionization VOC sensors are optimal for early TR detection in lithium iron phosphate battery compartments. VOC detection provides the earliest warning (~600 s before TR), while ignition significantly accelerates gas propagation. Deployment strategies must account for spatial dynamics, with edge zones requiring denser sensor coverage. Future work will focus on hybrid sensor networks and adaptive algorithms to enhance safety in LFP-based energy storage systems.