
In the context of the “dual-carbon” strategic goals, the integration of high-proportion renewable energy sources has made large-scale energy storage a core support for the safe operation of new power systems. Electrochemical energy storage technologies, represented by lithium iron phosphate (LiFePO4) batteries, have become key equipment for mitigating renewable energy fluctuations and ensuring power supply-demand balance due to their millisecond-level power response characteristics and flexible configuration advantages. However, lithium-ion batteries are prone to irreversible thermal runaway (TR) under abusive conditions such as mechanical abuse (collision/puncture), electrical abuse (overcharge/over-discharge/internal short circuit), and thermal abuse, which may trigger cascading thermal runaway propagation (TRP), severely threatening the safe and stable operation of modular energy storage systems. In recent years, catastrophic accidents caused by thermal runaway in energy storage power stations have occurred frequently worldwide, exposing technical shortcomings in the field of energy storage thermal safety. Therefore, revealing the thermal runaway evolution mechanism and diffusion spread规律 in energy storage battery systems, and researching methods for traceability and fault localization of thermal runaway at the battery cluster level, have become core scientific issues for breaking through the cascade safety failure bottlenecks of energy storage battery systems and ensuring the reliable and stable operation of new power systems.
Considering the thermal runaway triggering and propagation characteristics in battery modules, this study proposes a fault inversion localization methodology for energy storage batteries constrained by thermal propagation paths. First, using 280 Ah lithium-iron phosphate (LiFePO4) cells, modules, and clusters representative of practical cabinet configurations, thermal abuse experiments are conducted to induce cell thermal runaway. Critical parameter thresholds and evolutionary characteristics at the cell level are systematically analyzed through multi-point data acquisition. Second, leveraging experimentally validated thermal abuse failure data, a three-dimensional multiphysics coupled simulation model is developed by integrating the forgetting factor recursive least squares (FFRLS) parameter identification method. This establishes an optimized thermal propagation model with time-varying mappings between state of charge (SOC) and thermal runaway parameters, enabling precise simulation of thermal runaway propagation paths and energy release characteristics at the cell/module level under varying SOC conditions. Finally, a hybrid genetic algorithm (GA) and grey wolf optimizer (GWO) enhanced time difference of arrival (TDOA) fault inversion framework is proposed, integrating thermal propagation temperature evolution with fault inversion optimization to achieve cluster-level thermal runaway source localization.
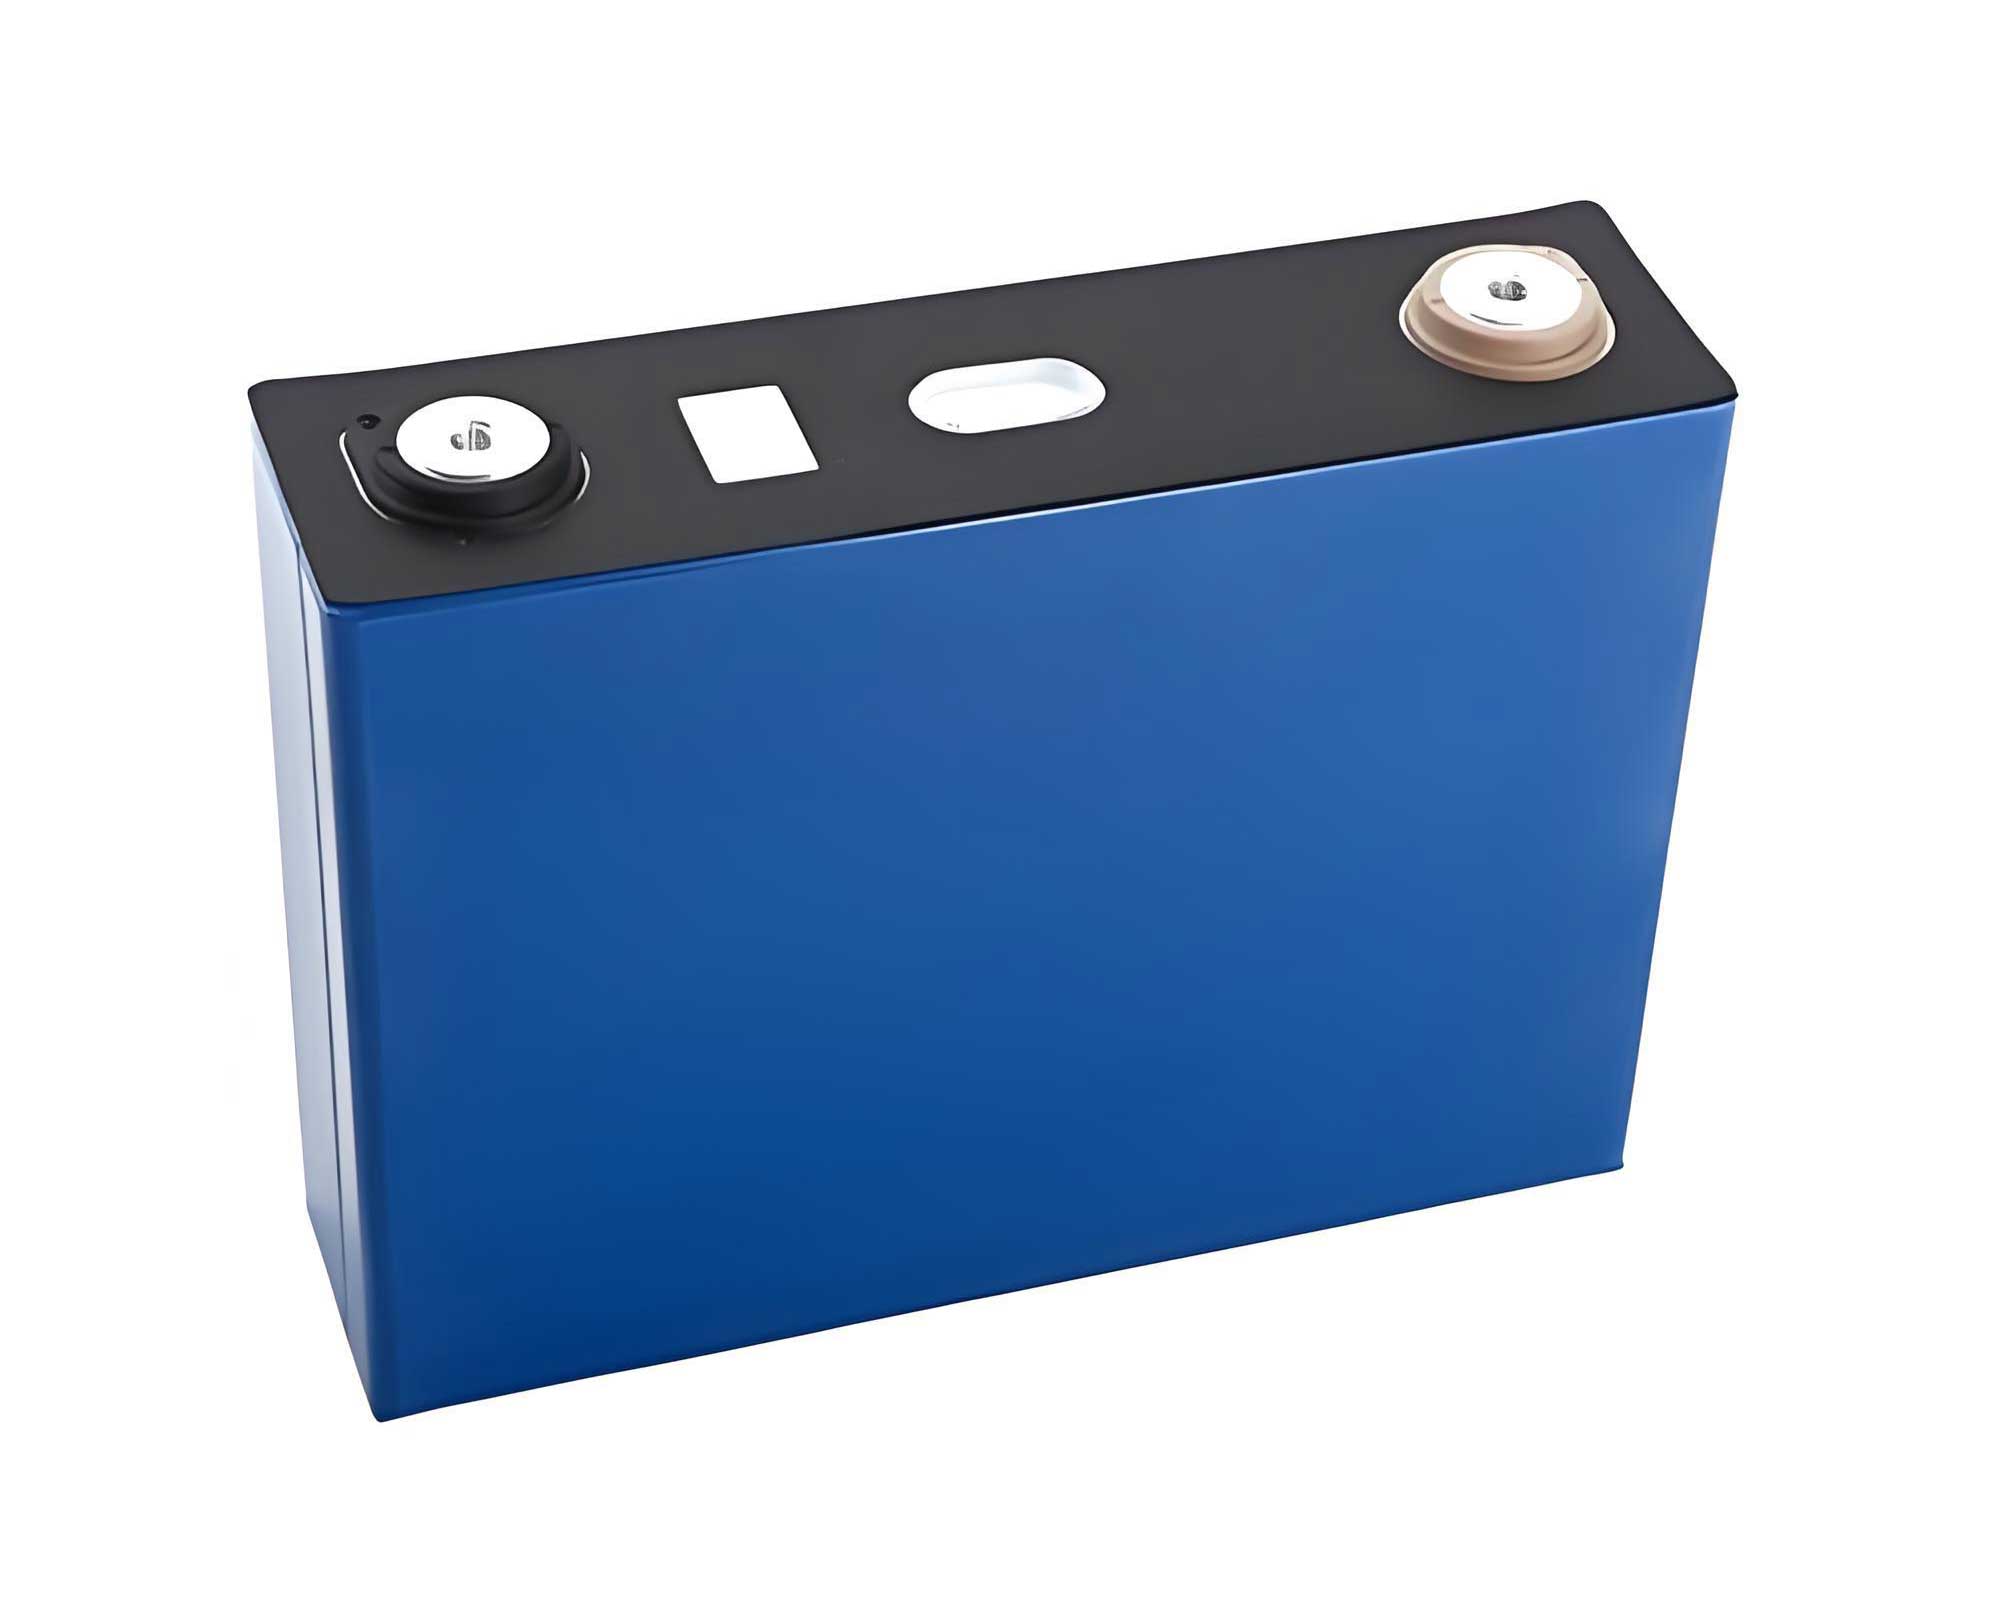
The experimental platform includes a standard-sized explosion-proof chamber and other equipment. The samples are four groups of same-batch 280 Ah LiFePO4/graphite system prismatic batteries (size 174 mm × 208 mm × 72 mm, mass 5435 ± 100 g) with full state of health (SOH = 100%). The nominal voltage is 3.2 V, and the operating voltage window is 2.5 V to 3.65 V. Before the experiment, all samples are subjected to constant current charge-discharge using a battery cycler (NEWARE CT-4008-5V20A-A) according to IEC 62660-1 standard. They are discharged to 2.5 V at 0.07 C, then charged to target SOC (25%, 50%, 75%, 100%) with constant current and constant voltage charging at 20 A. The battery samples are fixed with steel clamps, and thermal runaway is triggered using a 1000 W constant power heater. Five K-type thermocouples (diameter 1 mm) are arranged along the battery surface to monitor the temperature field at the center of the large face (Ta), the upper left and lower right corners of the large face (Tb/Tc), the safety valve, and 5 cm above it (Td/Te). The measurement system error is within ±2.5°C, temperature data is collected by the acquisition device ICPCON I-7018, and battery voltage is recorded by the Xinwei cycler.
The critical state of battery thermal runaway essentially lies in the dynamic imbalance between the total heat generation power and heat dissipation capacity of the system. When the internal temperature gradient of the battery exceeds the critical point of material phase change, the heat release intensity of side reactions will increase by orders of magnitude. The kinetic equations of side reactions during thermal runaway propagation are shown in Table 1.
| Side Reaction Type | Governing Equation |
|---|---|
| SEI Decomposition Reaction | $$Q_{\text{SEI}} = H_{\text{SEI}} \cdot W_{\text{SEI}} \cdot R_{\text{SEI}}$$ |
| Negative Electrode-Electrolyte Reaction | $$Q_{\text{ne}} = H_{\text{ne}} \cdot W_{\text{ne}} \cdot R_{\text{ne}}$$ |
| Positive Electrode-Electrolyte Reaction | $$Q_{\text{pe}} = H_{\text{pe}} \cdot W_{\text{pe}} \cdot R_{\text{pe}}$$ |
| Electrolyte Decomposition Reaction | $$Q_{\text{ele}} = H_{\text{ele}} \cdot W_{\text{ele}} \cdot R_{\text{ele}}$$ |
| Total Reaction Heat | $$\Sigma Q_{\text{side-tot}} = Q_{\text{SEI}} + Q_{\text{ne}} + Q_{\text{pe}} + Q_{\text{ele}}$$ |
Where, \(Q_{\text{SEI}}\), \(Q_{\text{ne}}\), \(Q_{\text{pe}}\), \(Q_{\text{ele}}\) are the heat generation rates of SEI decomposition, negative electrode-electrolyte reaction, positive electrode-electrolyte reaction, and electrolyte decomposition reaction, respectively, in W/m³; \(H_{\text{SEI}}\), \(H_{\text{ne}}\), \(H_{\text{pe}}\), \(H_{\text{ele}}\) are the heat generation per unit mass of reactants for SEI decomposition reaction, negative electrode-electrolyte reaction, positive electrode-electrolyte reaction, and electrolyte decomposition reaction, respectively, in J/kg; \(W_{\text{SEI}}\), \(W_{\text{ne}}\), \(W_{\text{pe}}\), \(W_{\text{ele}}\) are the carbon content of SEI reactant, negative electrode reactant, positive electrode reactant, and electrolyte reactant, respectively, in kg/m³; \(R_{\text{SEI}}\), \(R_{\text{ne}}\), \(R_{\text{pe}}\), \(R_{\text{ele}}\) are the reaction rates of SEI decomposition, negative electrode-electrolyte reaction, positive electrode-electrolyte reaction, and electrolyte decomposition reaction, respectively, in s⁻¹; \(\Sigma Q_{\text{side-tot}}\) is the sum of the above exothermic reactions.
The accuracy of the cascade thermal runaway propagation model for energy storage battery modules is directly controlled by the characterization accuracy of the single-cell model. The thermal runaway electrochemical-thermal-chemical reactions of batteries under different SOCs exhibit strong nonlinear characteristics. This study adopts a two-stage modeling and parameter identification optimization method. In the first stage, based on single-cell thermal runaway triggering experiments, key parameters such as voltage drop timing, temperature rise rate threshold, and runaway peak temperature are obtained. The FFRLS algorithm is introduced, and experimental data are used to iteratively correct SOC state threshold-related parameters of the single-cell thermal model (such as cell constant pressure heat capacity, cell anisotropic thermal conductivity coefficients, side reaction activation energy, etc.). A three-dimensional high-fidelity single-cell model is constructed under the same conditions as the experiment in Section 2.1, with external natural convection heat transfer coefficient \(h = 8.7 \, \text{W/(m}²\cdot\text{K)}\), initial temperature consistent with the laboratory at 23°C. The battery constitutive parameters are set as time-invariant in the model. The model geometric specifications, detailed parameter values, and model energy conservation equation are shown in Appendices A, B, and C. Battery parameters are sourced from the CATL 280 Ah battery specification sheet and technical manual, as well as literature.
In the second stage, the parameter-identified and calibrated single-cell model is expanded to the module level according to the actual topology of the energy storage cabin, including a 4×13 matrix arrangement of 52 cells in series embedded in the battery pack network architecture. Structures such as insulation pads between modules and water cooling plates at the bottom are set to ensure the authenticity of the mapping between the model and the actual battery pack. Through the high-fidelity thermal propagation model, the temperature field evolution规律, heat flow transport paths, and energy distribution mechanisms of thermal propagation constraint paths within the module under multiple SOC conditions are analyzed.
Current thermal runaway thermal models are mainly based on linear superposition assumptions of quasi-static intrinsic parameters and Fourier heat transfer theory, mapping the universal physical and chemical properties of batteries through common electrochemical-thermal coupling parameters. While they can meet simulation accuracy under typical conditions, under dynamic SOC coupling scenarios, there are large systematic deviations in key indicators such as thermal runaway triggering timing and temperature extremes, especially when SOC is high (>75%), where temperature field reconstruction shows nonlinear growth deviations. This indicates that the traditional universal electrochemical-thermal theoretical framework has certain shortcomings in the multi-state parameter thermal runaway research scenarios of large-capacity LiFePO4 energy storage batteries, leading to distortion in the energy accumulation calculation when describing the dynamic changes of multiple state parameters of the cell.
To overcome this limitation, this paper proposes a data-model-driven thermal model optimization construction method. While maintaining the universality of the classical Arrhenius framework, the FFRLS parameter identification method is used to establish a mechanism in the thermal model that considers the influence of SOC on the reaction activation energy \(E_a\), dynamically adjusting the numerical parameters of the side reaction activation energy \(E_a\) coupled with SOC. A forgetting factor \(\lambda\) (0.95 < \(\lambda\) < 1) is introduced to overcome the accumulation of old data during iteration, establishing a time-varying mapping relationship between battery state parameters and battery thermal runaway thermodynamic side reaction activation energy \(E_a\) parameters, enabling the model to have self-correction capability for thermal runaway heat generation that tracks battery state parameter time variations.
The traditional Arrhenius model is shown in Equation (1). By establishing the mapping \(E_{a,i}(\text{SOC})\) between battery SOC and reaction activation energy \(E_{a,i}\) as shown in Equation (2), the activation energy \(E_{a,i}\) is extended from an electrochemical constant to a function \(E_{a,i}(\text{SOC})\) mapping with SOC, describing the phenomenon of reduced reaction activation energy barrier as SOC increases. The parameters \(k_{i,0}\), \(k_{i,1}\), \(k_{i,2}\) are identified through FFRLS parameter identification to establish a dynamic parameter system for reaction activation energy \(E_{a,i}\) and SOC.
$$R_i = A \exp\left(-\frac{E_{a,i}}{RT}\right) c^m$$
$$E_{a,i}(\text{SOC}) = k_{i,0} + k_{i,1} \cdot \exp(k_{i,2} \cdot \text{SOC})$$
Where, \(R_i\) is the decomposition reaction rate of each part inside the cell, in s⁻¹; \(A\) is the pre-exponential factor of the decomposition reaction of each part inside the cell, in s⁻¹; \(E_{a,i}\) is the activation energy of the decomposition reaction of each part inside the cell, in J/mol; \(R\) is the gas constant, taken as 8.314 J/(mol·K); \(T\) is the reaction temperature; \(c\) is the proportion of unstable lithium in each part of the cell; \(m\) is the reaction order; \(k_{i,0}\) is the intrinsic battery activation energy; \(k_{i,1}\) is the SOC modulation intensity coefficient; \(k_{i,2}\) is the decay rate constant.
The system input data vector is shown in Equation (3), the optimal estimated parameter vector at time \(k\) is shown in Equation (4), and the expression form of the estimation error \(e(k)\) between the optimal predicted value at the current moment and the output value at the next moment (achieving the state of minimum temperature deviation between simulation and experiment) is shown in Equation (5):
$$\phi(k) = \left[1, -\frac{1}{RT(k)}\right]^T$$
$$\hat{\theta}(k) = \left[\ln A, E_{a,i}(\text{SOC})\right]^T$$
$$e(k) = \sum_{k=1}^{N} \left(T_{\text{exp}}(k) – T_{\text{sim}}(k)\right)^2 = \sum_{k=1}^{N} \left(T_{\text{exp}}(k) – \phi(k)^T \hat{\theta}(k)\right)^2$$
In the optimization process of battery thermal runaway thermodynamic parameters, by combining simulation to integrate the FFRLS algorithm with the battery thermal model, and using a recursive mechanism to update the parameter estimated values and covariance matrix to iteratively approach the optimal value, the cumulative error of simulation parameters in the thermal model governing equations is effectively reduced. The parameter identification method is as follows:
$$y(k+1) = \phi(k)^T \hat{\theta}(k) + e(k)$$
$$\hat{\theta}(k+1) = \hat{\theta}(k) + K(k+1) e(k+1)$$
$$K(k+1) = \frac{P(k) \phi(k+1)}{\lambda + \phi(k+1)^T P(k) \phi(k+1)}$$
$$P(k+1) = \frac{1}{\lambda} \left(P(k) – K(k+1) \phi(k+1)^T P(k)\right)$$
Where, \(y(k+1)\) is the actual observed value of the system; \(K(k+1)\) is the algorithm correction gain term; \(P(k)\) is the state estimation covariance matrix at time \(k\). Since the tracking effect of the algorithm changes with the value of \(\lambda\), and the smaller \(\lambda\) is, the greater the fluctuation of the algorithm, so \(\lambda = 0.98\) is taken. The specific algorithm flow is shown in Figure 2. By constructing a dynamic mapping mechanism between SOC and reaction activation energy, the optimized battery thermal model is verified to meet the accuracy requirements for thermal runaway simulation inference. The identification results of side reaction activation energy \(E_a\) under different SOCs are shown in Table 2.
The shell temperature field and potential response characteristics of the 280 Ah energy storage battery constitute key indicators for early safety warning. The key parameters of thermal runaway triggering are shown in Table 3, and the规律 of battery surface temperature and voltage changes during the runaway process is shown in Figure 3. The acquisition and analysis of these key parameters support the construction of parameter identification simulation models. From Figure 3 and Table 3, it can be seen that when thermal runaway is triggered, batteries under different SOC conditions all exhibit coupled characteristics of sudden temperature rise and voltage collapse, but there are significant differences in the intensity of side reactions, the degree of thermal hazard, and key nodes of thermal runaway phenomena. In the thermal runaway triggering stage, the open-circuit voltage of batteries at SOC=50%, 75% SOC, and 100% SOC shows step-like voltage drops and then remains at zero potential. The 100% SOC battery triggers thermal runaway first, and the time for the surface temperature at each point to rise from room temperature to the peak temperature is the shortest. At 327 s, when the voltage drops suddenly, the surface temperature is 61.2°C, followed by safety valve jetting at 338 s and 469 s, and the battery enters the thermal runaway triggered state. At 847 s, the thermal runaway temperature reaches a peak of 378.3°C. At 100% SOC, the maximum temperature rise rate occurs at 493 s, reaching 26.5°C/s, which is attributed to the high lithium-intercalated negative electrode of the fully charged battery accelerating SEI decomposition and exothermic chain reactions, and the higher chemical energy stored in the higher SOC system intensifying the kinetics of positive electrode oxygen evolution reaction, leading to a significant aggravation of the thermal runaway temperature rise rate. As the internal reaction rate gradually slows down, the surface temperature also gradually decreases. The 75% SOC battery exhibits similar thermal runaway characteristics to high SOC batteries, with the safety valve opening at 378 s while the battery temperature is at 70.3°C, but unlike the thermal runaway phenomenon of the fully charged battery, the 75% SOC battery triggers thermal runaway when the temperature increases to 120.1°C, and after entering complete thermal runaway, the highest temperature is 360.9°C, which is 17.4°C lower than the peak temperature of the 100% SOC battery, reflecting the inhibitory effect of reduced lithium-ion concentration on side reaction kinetics. As the battery SOC decreases, key nodes such as safety valve activation, voltage drop, thermal runaway triggering, and peak temperature reaching for the 50% SOC battery are significantly delayed, with a peak temperature of only 260.2°C. Notably, at 25% SOC, the voltage shows a step-like slow decline characteristic, different from the step-like voltage drop response under other higher SOC conditions. The thermal runaway phenomenon is triggered at 2683 s when the battery surface temperature reaches 201.8°C, and the peak temperature is only 236.8°C, indicating insufficient exothermic side reactions due to insufficient lithium storage in the lower SOC system.
Due to the Joule-Thomson expansion effect, as the safety valve opens, the battery surface temperature shows a brief drop, which is particularly obvious at SOC=25%, 50%, and 75%. This is directly related to the enthalpy of electrolyte gas-liquid phase change. After the separator melts, electrode contact leads to internal short circuit (ISC), triggering temperature rise dominated by intrinsic Joule heat dissipation. When the temperature exceeds the thermal decomposition threshold of the positive electrode material, under conditions above 180°C, ① LiFePO₄ → FePO₄ + Li⁺ + e⁻, ② under temperature >200°C conditions, 2FePO₄ → Fe₂P₂O₇ + 0.5O₂↑ or 4FePO₄ → 2Fe₂O₃ + 2P₂O₅ + O₂↑ decomposition reactions are triggered and release O₂. The released oxygen undergoes redox chain reactions with active materials in the battery, rapidly activating chain exothermic side reaction processes and triggering battery thermal runaway.
Based on the battery thermal runaway modeling covering lithium-ion Butler-Volmer reaction kinetics, Fick’s law, and comprehensive heat generation mechanism of side reaction heat, as well as FFRLS parameter identification, the temperature evolution curves at the Ta point of the experimental sample (Exp) and the simulation model (Sim) are cross-compared, and the吻合度 is shown in Figure 4. Overall, under different SOCs, the thermal runaway temperature Ta response characteristics, triggering time, and peak temperature of the simulation model are basically consistent with the actual situation. As SOC increases, the peak temperature gradually increases, and the triggering time also advances. The temperature change trend has small deviations from the measured data. Under the four SOC conditions, the maximum deviation of the thermal runaway推演 peak temperature is 2.59%, and the temperature prediction deviation caused by state parameter uncertainty is significantly suppressed.
Analysis of module thermal propagation behavior. Based on the single-cell model expanded to construct a module-level multiphysics coupled model, the simulation推演 surface temperature distribution is shown in Figure 5. The 52 cells in series configuration are numbered 1# to 52#. To more intuitively展示 the thermal propagation characteristics, the middle area cell 33# is set as the thermal runaway triggering source, and thermal runaway is triggered by单独 heating cell 33#, while the other batteries are non-faulty batteries. The thermal runaway sources of different SOC module models are all triggered at t=100 s. From the simulation推演 results, it can be seen that thermal propagation behaviors under different SOCs have spatial heterogeneity of heat spread and nonlinear energy transfer characteristics, and there is a significant SOC critical threshold. When module SOC is 100% and 75%, thermal runaway and propagation show significant path constraint characteristics. Four typical stages are analyzed: single-cell instability of faulty cell 33#, neighborhood diffusion, spatial propagation, and global failure. 1) In the single-cell instability stage, cell 33#连续 overheats, and when the heat flux density exceeds the critical value, the open-circuit voltage drops sharply to 0 V, indicating the formation of a network-type internal short circuit, and the internal Joule heat power density has a significant heating effect on the battery temperature. 2) In the neighborhood diffusion stage, a high-temperature region of 399.3°C to 415.3°C is formed on the side walls around cell 33#, and under heat conduction, the thermal runaway triggering interval time between adjacent cells Δt = 73 s to 98.2 s. Due to the thermal resistance in the battery thickness direction, the radial (y-axis) heat transfer rate is significantly higher than the axial (x-axis) direction, so adjacent cells 20# and 46# obtain high-temperature heat flow before cells 32# and 34# and trigger thermal runaway first. 3) In the spatial propagation stage, the heat flow vector field expands anisotropically, and the heat generation from thermal runaway causes successive triggering and failure of each cell. Chain reactions lead to thermal propagation to more batteries. 4) In the global failure stage, at this time, thermal propagation reaches the edge of the module, and edge cells enter the thermodynamic saturation stage due to heat accumulation effect. At this point, thermal propagation spreads throughout the entire module. When module SOC ≤ 50%, the local thermal runaway intensity of cell 33# is low, and the dynamic balance between heat generation and heat dissipation is maintained in the module system, and thermal propagation does not occur, indicating the existence of a critical SOC threshold.
The average temperature of thermal propagation for faulty cell 33# and adjacent cells along the x-axis and y-axis is shown in Figures 6 and 7. From Figure 6, it can be inferred that when faulty cell 33# triggers runaway at t=300 s, for module SOC=100%, the internal temperature of cells 27# to 39# reaches up to 424.5°C, and the thermal propagation time is between 316 s and 754 s, with the thermal propagation interval between cells Δt_{i#→(i+1)#} around 73 s. For module SOC=75%, the internal temperature extreme value of cells 33# to 39# reaches 412.5°C, and thermal propagation occurs between t=805 s and 1394 s, with the thermal runaway spreading between battery cells in approximately 98.2 s. From Figure 7, it can be seen that the development process of thermal propagation along the y-axis direction is similar to that of cells arranged along the x-axis direction, but the propagation speed is faster. For module 100% SOC, in the y-axis direction, the peak temperature is 429.4°C for cell 7#, and the thermal propagation interval Δt_{i#→(i+1)#} is about 66 s, which is 7 s faster than along the x-axis propagation; for module SOC=75%, in the y-axis direction, the peak temperature is 423.3°C, and the propagation time between cells is 89.5 s, which is 8.7 s faster than along the x-axis propagation. From Figures 6 and 7, it can be seen that in the 50% SOC and 25% SOC modules, except for cell 33# completing thermal runaway triggering and the temperature rising to 128.7°C and 122.7°C respectively, adjacent cells do not show sudden temperature rise of thermal runaway, and thermal runaway does not further develop and propagate in lower SOC (25%, 50%) modules.
It can be found that even under the premise of arranging 0.5 mm aerogel insulation pads between modules, constrained by the contact thermal resistance of battery卷芯-electrode-separator, and thanks to the high thermal conductivity of copper/aluminum current collectors, the efficiency of thermal propagation along the inter-layer direction (y-axis) of the faulty cell is higher than along the battery thickness direction (x-axis). This is because although intuitively the x-axis direction faulty cell has larger contact area with adjacent cells on both sides (0.0362 m² and 0.0149 m² respectively), due to the laminated structure of the battery卷芯, the axial and radial thermal conductivity coefficients differ significantly. The x-axis direction heat transfer in the cell core is a through-layer conduction mechanism, with through-layer thermal conductivity λ_x only 1.5 W/(m·K), while the y,z axis radial heat conduction is inter-layer conduction within the cell core, with thermal conductivity λ_y = λ_z = 18 W/(m·K). Therefore, in thermal propagation, the instantaneous effective heat conduction along the inter-layer (y-axis) inside the battery卷芯 is much more efficient than the through-layer (x-axis) direction propagation.
Through thermal propagation behavior and parameter analysis, it can be seen that the thermal runaway propagation mechanism inside the energy storage module can serve as a constraint for thermal propagation paths within the module. By quantifying thermal propagation conduction paths, thermal coupling strength between adjacent batteries, and insulation structure boundary conditions, a dynamic constraint framework for the thermal propagation process is formed. Taking the spatial topology structure of the module and battery cluster as the skeleton, and using thermal runaway triggering and propagation temperature gradients, battery material thermal resistance and side reaction characteristics, and heat transfer priority order as key parameters, it provides physical criteria for thermal propagation fault localization at the battery cluster level.
From the voltage response characteristics in Figures 6 and 7, the voltage response during battery pack thermal propagation is a direct表征 of thermal runaway-internal short circuit-cell structure failure, and its evolution规律 is closely coupled with thermal propagation paths. The development of a series of exothermic side reactions inside the thermal runaway cell directly leads to loss of active lithium ions and internal short circuit, and its external electrical characteristic representation is that the voltage drops sharply as the battery temperature increases, and the voltage of adjacent cells can still remain normal when thermal runaway has not propagated. The propagation of thermal runaway causes successive side reaction chains in adjacent normal cells, and the voltage drops rapidly with the thermal propagation time difference.
Construction of battery cluster thermal runaway simulation database. For the scenario of large-scale battery cell placement in battery clusters, to reduce the complexity of subsequent fault inversion localization based on the GA-GWO algorithm, a regional division strategy is adopted for battery modules and a thermal runaway propagation simulation database is constructed. Based on the number and spatial distribution of cells in the module, and based on the module thermal propagation simulation model established in the previous section 3.2 that reflects thermal propagation path constraint elements (thermal runaway triggering timing and propagation temperature gradients, battery material thermal resistance and side reaction characteristics, heat transfer priority order and thermal propagation weights), the spatial topology is expanded to construct a battery cluster model inside the energy storage cabin. By quickly locating possible subdomains of thermal runaway triggering sources under the thermal propagation path constraint framework, the thermal runaway heat source triggering location is inversely solved to achieve accurate localization and traceability of fault sources. The geometric and physical model of the battery cluster is shown in Figure 8.
Virtual sensor arrays are deployed at key nodes of model heat conduction. Two temperature sensors are evenly placed on each side of the battery cluster (8 temperature sensors in total on 4 sides) to systematically evaluate thermal runaway propagation paths. Based on the anisotropic characteristics of the battery cluster module structure, the energy storage unit is divided into 6 fault diagnosis domains with independent thermal boundary conditions, as shown in Figure 9. For each diagnosis domain, when the centroid position activates thermal runaway triggering, electrochemical-thermal coupled thermal runaway推演 simulation is performed to obtain dynamic evolution data of temperature gradient field and heat diffusion flux. The average data is recorded to provide a training dataset for subsequent inversion localization algorithms.
Battery cluster thermal runaway fault inversion localization consists of two stages. 1) First stage: rapid preliminary fault localization. Under battery cluster thermal runaway conditions, first, wavelet denoising preprocessing is performed on the temperature sensor signals deployed around the module, and the timing nodes of each sensor triggering alarm threshold are accurately extracted with the help of a dynamic threshold discrimination module. Then, the time delay differences of each sensor alarm are spatiotemporally matched with the preset battery cluster thermal runaway simulation failure characteristic database. Based on the TDOA algorithm, the spatial node of the optimal matching unit is solved, combined with electrochemical-thermal coupling effects and thermal propagation path analysis, to achieve rapid preliminary localization of the thermal runaway source area, which can quickly narrow down the fault range. The core of the TDOA algorithm uses the hyperbolic positioning principle. Assuming reference points A and B, the distances from target point P to A and B are d_A and d_B respectively, and the signal propagation speed is v, then the time difference for the signal to reach A and B from P is:
$$\Delta t = \frac{d_B – d_A}{v}$$
According to geometric relationships, the trajectory of target point P satisfies the hyperbolic equation:
$$\frac{(x – x_A)^2}{a^2} – \frac{(y – y_B)^2}{b^2} = 1$$
Where, \((x, x_A)\), \((y, y_B)\) are the coordinates of reference nodes A and B; \(a\) and \(b\) are hyperbolic parameters related to Δt and v.
By conducting TDOA measurements between multiple reference nodes, multiple hyperbolic equations can be obtained, and the location of target point P is at the intersection of the hyperbolas.
When a real thermal runaway propagation fault occurs, taking the first sensor triggering time as the assumption, the alarm delay of the j-th sensor corresponding to the i-th block is L_i, which is the matching approximation degree of the corresponding block. Finally, the block with the highest approximation degree is selected as the thermal runaway preliminary localization source, where i = {1,2,…,N}, and the time delay difference corresponding to the j-th sensor alarm of the real temperature sensor is τ_{0j}, n is the total number of sensors set, and the least squares method is used to obtain the approximation degree of each block:
$$L_i = \frac{1}{n} \left( (\tau_{i1} – \tau_{01})^2 + \cdots + (\tau_{ij} – \tau_{0j})^2 + \cdots + (\tau_{in} – \tau_{0n})^2 \right)$$
Under battery SOC=100% condition, thermal runaway is triggered by heating the first battery at the positive electrode entrance of the top battery module. To simulate real condition signal distortion, Gaussian noise disturbance is introduced to the sensor timing data. The distorted faulty battery simulation sensor signal is taken as the real-time sensor真实 signal, and preliminary inversion localization testing is conducted.
Based on the database characteristic parameters and real-time sensor data statistics, the simulation sensor data of the fault database of the 6 diagnosis subdomains and the real-time sensor alarm delays are standardized, and the least squares method is used to calculate the subdomain matching degree error. The minimum approximation error L_{i,loss} = 0.163, and the maximum approximation error L_{i,max} = 0.945. The approximation error of blocks adjacent to the faulty cell is much larger than that of the faulty block. This indicates that preliminary fault localization can accurately determine the source at the block level, effectively suppressing the risk of localization results shifting to blocks adjacent to the fault, providing block-level traceability support for precise localization based on the GA-GWO algorithm.
2) Second stage: accurate fault localization traceability. Based on the preliminary localized fault subdomain, combined with the GA-GWO optimization algorithm and the battery cluster thermal propagation simulation model, a set of initial population sets consisting of faulty cell spatial coordinates {(x,y,z), SOC, SOH} is randomly generated. Through the multiphysics coupling联合 simulation interface, high-fidelity temperature field evolution datasets are iteratively generated. The simulation results of faulty units are used to expand the search space based on GA operations (crossover, mutation). After screening by the GWO leadership hierarchy, the top three fitness faulty unit individuals in the GA population are mapped to (α, β, δ) grey wolf individuals respectively. The GWO leadership wolf positions for faulty units are determined and the population is updated, and the contribution weights of GA and GWO are dynamically adjusted according to the number of iterations. During the iteration process, the faulty unit leadership wolf group (α, β, δ)主导 the global search direction to determine the optimal solution based on the fitness function evaluation criteria, and the faulty unit following wolf individuals approach the optimal solution through nonlinear position updates.
The fitness is obtained using the least squares method, where i is the i-th faulty unit, i = {1,2,…,N}, t_{1j} is the time difference between the first and j-th sensor triggering, t_{i,j} is the time difference of each sensor triggering for the real data that needs to be localized, N is the number of超声 sensor channels, and the fitness expression for the i-th faulty unit is as shown in Equation (13):
$$\text{Fitness}(t_i) = \frac{1}{n} \sum_{j=1}^{n} (t_{i,j} – t_{1j})^2$$
Accurate localization considers comprehensive factors such as battery position and SOC on the impact of thermal propagation, achieving precise fault localization. The specific process is shown in Figure 10.
Aiming at the anisotropic characteristics of battery cluster thermal runaway propagation and the demand for localization error evaluation, this study proposes a directional dual-threshold error metric (DD-TEM), abbreviated as the DD error metric. This metric is based on the improvement of the Manhattan Distance (MD) metric. By integrating the dual thresholds of heat conduction paths in the battery cluster and an exponential penalty mechanism, the direction thresholds are divided into横向 (along the electrode layer direction) and纵向 (along the stacking direction) within the battery cluster for dual-threshold evaluation, quantifying the prediction position error characteristics. The calculation formula of the DD error metric is shown in Equation (14), where, \(a = (a_x, a_y)\) is the real battery center coordinate, \(p = (p_x, p_y)\) is the predicted battery center coordinate; \(\lambda\) is the penalty coefficient, used to increase the positioning requirements for the z-axis; \(\tau_i\) is the direction threshold, representing the energy storage battery cluster size.
$$\text{DD}(p, a) = \sum_{i \in \{x,y\}} \frac{|p_i – a_i|}{\tau_i} + \alpha \prod_{i \in \{z\}: |p_i – a_i| > \tau_i} \lambda$$
$$\alpha = \begin{cases}
\lambda & \text{if } \exists i \in \{z\}: |p_i – a_i| > \tau_i \\
0 & \text{otherwise}
\end{cases}$$
Based on the detailed size of the research battery cluster model constructed in this paper (700 mm × 1100 mm × 950 mm), it can be calculated that a DD error less than 0.03 can be considered as accurate fault battery localization, and greater than 0.1 is considered as localization error beyond the acceptable range, or跨层 localization.
The reasonable setting and optimization strategy of localization algorithm parameters are prerequisites for the global convergence and localization accuracy of the fault inversion algorithm. Aiming at the sensitivity characteristics of key control parameters of GA融合 GWO, this section conducts systematic parameter traversal and response optimization analysis to avoid local pseudo-solution traps. A 12-core processor platform is used to reduce the computation time of the thermal propagation process. The sensitivity analysis results are shown in Table 4.
| N | T | Convergence Strategy | Fitness | Spatial Coverage/% | Convergence Speed/iterations |
|---|---|---|---|---|---|
| 20 | 75 | Linear Decay | 0.095 | 91.3 | 40 |
| 30 | 75 | Linear Decay | 0.073 | 93.2 | 32 |
| 20 | 120 | Exponential Decay | 0.067 | 87.7 | 50 |
| 30 | 120 | Segmented Decay | 0.045 | 96.1 | 65 |
| 25 | 100 | Adaptive Decay | 0.056 | 95.2 | 55 |
The GA-GWO algorithm前期 screens global excellent individuals to form the initial population, and later introduces distance启发 factors to optimize the GWO global search path. With the help of system sensitivity analysis, selecting appropriate parameters can effectively promote the algorithm to conduct extensive exploration in the solution space, reduce the probability of falling into local optimal solutions, and avoid computational resource loss. From Table 4, it can be seen that when N=30, the algorithm shows the best balance between solution space coverage and computational efficiency, and does not significantly increase the computational load. The maximum number of iterations (T) adopts a dynamic termination mechanism, automatically stopping when the improvement幅度 of the optimal solution for 5 consecutive generations is below the threshold ε=0.01%. The convergence factor (a) adopts a linear decay strategy to improve convergence speed, i.e., the number of iterations required to reach 90% of the optimal solution. Based on comprehensive consideration of accuracy, coverage, and computational speed, the final selection of N=30, T=75, and linear decay scheme is the optimal strategy.
Through a multi-dimensional performance evaluation framework, the applicability of TDOA direct localization method, PSO-driven fault inversion method, and single-dimensional GWO localization method for fault traceability in energy storage battery cluster-level thermal propagation scenarios is systematically compared. The TDOA method estimates the thermal runaway propagation rate based on thermal conductivity coefficient and heat source intensity, while the single-dimensional GWO fault inversion method虽然 introduces intelligent optimization mechanisms, limits the parameter space to the battery geometric position dimension, ignoring the coupling influence of key state parameters (electrochemical state SOC) on thermal runaway dynamics.
Aiming at the difficulty of obtaining experimental data, based on the previous chapter’s high-fidelity multiphysics coupled model, a benchmark dataset is generated by Gaussian noise injection and wavelet降噪 processing. For fault localization design, different SOCs (25%, 50%, 75%, 100% SOC gradient groups) are selected, and 5 repeated simulation tests are taken to average to ensure result reliability. The accuracy comparison of different localization algorithms under different SOC conditions is shown in Figure 11, and the effectiveness of fault localization methods is shown in Table 5.
From Figure 11 and Table 5, it can be seen that the TDOA direct localization method based on fixed heat transfer rate, due to ignoring the coupling effect between different SOC conditions and the peak differences of thermal runaway temperature fields and dynamic differences in propagation paths, has significantly higher localization errors, and under lower SOC conditions,跨层级 localization deviations are prone to occur. The PSO-driven localization method can suppress跨层 deviations, but its convergence efficiency is low, and the localization accuracy is sensitive to inertia weight parameters, making it difficult to meet the real-time requirements of the model. The single-dimensional GWO method reduces computational load by simplifying the parameter space, but under SOC=25%, 50% scenarios, due to distortion of temperature field peaks and thermal propagation trends, it causes a sharp increase in average DD errors, and跨层 misjudgment rate大幅提升; while under SOC=75%, 100% conditions, although跨层 localization misjudgment is eliminated, the offset of thermal runaway triggering时刻 still leads to less than ideal localization effects.
| Battery State | Localization Method | Average DD Error Metric |
|---|---|---|
| SOC=25% SOH=100% | TDOA | 0.127 |
| PSO | 0.053 | |
| Single-dimensional GWO | 0.079 | |
| Our Method | 0.027 | |
| SOC=50% SOH=100% | TDOA | 0.111 |
| PSO | 0.051 | |
| Single-dimensional GWO | 0.094 | |
| Our Method | 0.023 | |
| SOC=75% SOH=100% | TDOA | 0.107 |
| PSO | 0.043 | |
| Single-dimensional GWO | 0.040 | |
| Our Method | 0.021 | |
| SOC=100% SOH=100% | TDOA | 0.88 |
| PSO | 0.048 | |
| Single-dimensional GWO | 0.057 | |
| Our Method | 0.019 |
In contrast, our multi-parameter coupled GA-GWO inversion localization method, by embedding SOC as an optimization dimension into the thermal runaway dynamic propagation model to correct heat source intensity and heat propagation rate, achieves real-time compensation for the impact of different state parameters on temperature field evolution differences, reducing the inversion error caused by battery state parameters on the thermal propagation process. The results show that under different SOC conditions, the localization accuracy is稳定达到 above 94%, the average DD error ≤ 0.03, and the跨层 misjudgment rate approaches zero.
Localization accuracy and error under multiple sensor数量 layout scenarios. Given the high complexity of thermal runaway propagation paths that may occur in actual operation scenarios of energy storage power stations, the applicability of the proposed GA-GWO improved TDOA fault inversion localization method in complex sensor layout scenarios is tested. The impact of多种 temperature sensor数量 and layout schemes on the thermal runaway localization performance of the proposed method is探讨. Sensor layout schemes with 2, 4, 8, and 16 nodes on the outer立面 of the battery cluster are designed. Through fault injection testing, the扰动 impact of sensor network topology structure (including setting单侧 sensor blind areas) on localization accuracy is quantified and analyzed. The results are shown in Table 6. It can be seen that if sensors fail resulting in reduced数量, or even under conditions of单侧 sensor coverage缺失 in the battery cluster, the localization error can still保证一定精度. Further analysis reveals that the 8-node sensor均匀分布 scheme around the 5-layer stacked battery cluster achieves optimal cost-effectiveness, balancing spatial coverage engineering cost and fault localization accuracy, significantly improving fault diagnosis容错性 in complex conditions.
| Number of Sensors | Distribution Orientation | Localization Accuracy | Average DD Error Metric |
|---|---|---|---|
| 2 | Left and Front | 80% | 0.057 |
| 4 | Around Battery Cluster | 90% | 0.025 |
| 4 | Left and Front | 90% | 0.041 |
| 8 | Around Battery Cluster | 95% | 0.021 |
| 16 | Around Battery Cluster | 95% | 0.020 |
In conclusion, this study designs battery thermal runaway triggering experiments and collects key data to guide the construction of an FFRLS parameter identification optimized multi-scale electrochemical-thermodynamic coupling model and verifies the model accuracy. It systematically reveals the thermal runaway evolution mechanism and module-level cascade propagation规律 of 280 Ah energy storage LiFePO4 batteries. Based on experimental-simulation规律, thermal runaway fault inversion localization using the GA-GWO融合 improved TDOA method is completed. Regarding the temperature changes, runaway peaks, energy transfer characteristics during thermal runaway and propagation of single cells and modules under different SOCs, and the applicability of the battery cluster fault inversion method, the main conclusions are as follows:
1) Single-cell thermal runaway threshold characteristics: Under 1 kW constant heat flux density heating, the thermal runaway instability thresholds of single cells under different SOCs are in the range of 190°C to 205°C. The thermal runaway peak temperature of a fully charged single cell can reach 378.3°C, and the temperature rise rate can reach 26.5°C/s.
2) Optimization of multiphysics coupled model: A data-model-driven thermal runaway model optimization construction method is proposed. While maintaining the universality of the classical Arrhenius framework, the FFRLS parameter identification method is used to establish a mechanism in the thermal model that considers the influence of SOC on the reaction activation energy \(E_a\), achieving high-precision prediction of temperature evolution under multi-state parameters. The relative error between simulated peak temperature and measured value is less than 3%.
3) Module thermal propagation path constraints: Based on the simulation推演 behavior and parameter analysis of the module-level multiphysics coupled parameter identification optimized thermal propagation model, when SOC is in a较高 state (100%, 75%), thermal runaway spreads throughout the entire电箱 level. Constrained by the contact thermal resistance of battery卷芯-electrode-separator, and thanks to the high thermal conductivity of copper/aluminum current collectors, the efficiency of heat transfer along the inter-layer direction of the cell core is significantly higher than along the through-layer direction of the cell core. When SOC is in较低 conditions (50%, 25%), adjacent cells of the faulty battery do not continue to trigger thermal runaway, and continuous thermal propagation does not occur in lower SOC modules. Taking the spatial topology structure of the module and battery cluster as the skeleton, and using thermal runaway triggering and propagation temperature gradients, battery material thermal resistance and side reaction characteristics, and heat transfer priority order as key parameters, physical criteria can be provided for battery cluster-level thermal propagation fault localization.
4) Fault inversion localization method: A TDOA fault inversion localization method improved based on the GA-GWO algorithm is proposed. Through rapid calculation and localization of fault blocks in the battery cabinet,融合 the thermal propagation simulation path constraint mechanism and thermal runaway fault inversion algorithm, under different SOC conditions, the single-point fault inversion localization accuracy in thermal propagation failure is稳定达到 above 94%, localization error ≤ 0.03,跨层 misjudgment rate approaches zero, and under complex sensor布置 scenarios, it can still achieve rapid锁定 of faulty batteries, maintaining localization accuracy within a reliable range facing多种 complex situations.
This paper establishes a thermal runaway model for 280 Ah energy storage LiFePO4 single cells and modules, proposes a battery cluster thermal propagation fault inversion localization method, and by decoupling the multi-source coupling mechanism of electrochemical heat-Joule heat-side reaction heat,从微观 thermal runaway dynamics to macroscopic temperature field evolution跨尺度 simulation, achieves three-dimensional spatial localization and traceability of faulty batteries, providing parameterized support for the optimal design of energy storage system thermal safety. Subsequent research will focus on the thermal runaway risk issues of modules under complex conditions. By changing the heat exchange mode between batteries, selecting优质 insulation flame-retardant materials between batteries, and improving the design of battery thermal management systems, the occurrence of lithium battery thermal runaway and propagation phenomena can be avoided. This content needs to be further explored.