
Lithium iron phosphate (LiFePO₄) batteries are widely adopted in energy storage systems due to their high energy density and thermal stability. However, thermal runaway remains a critical safety concern influenced by factors like state of charge (SOC). This study systematically investigates the relationship between SOC variations and thermal runaway dynamics, while evaluating liquid nitrogen cooling efficacy in insulated battery enclosures.
1. Experimental Methodology
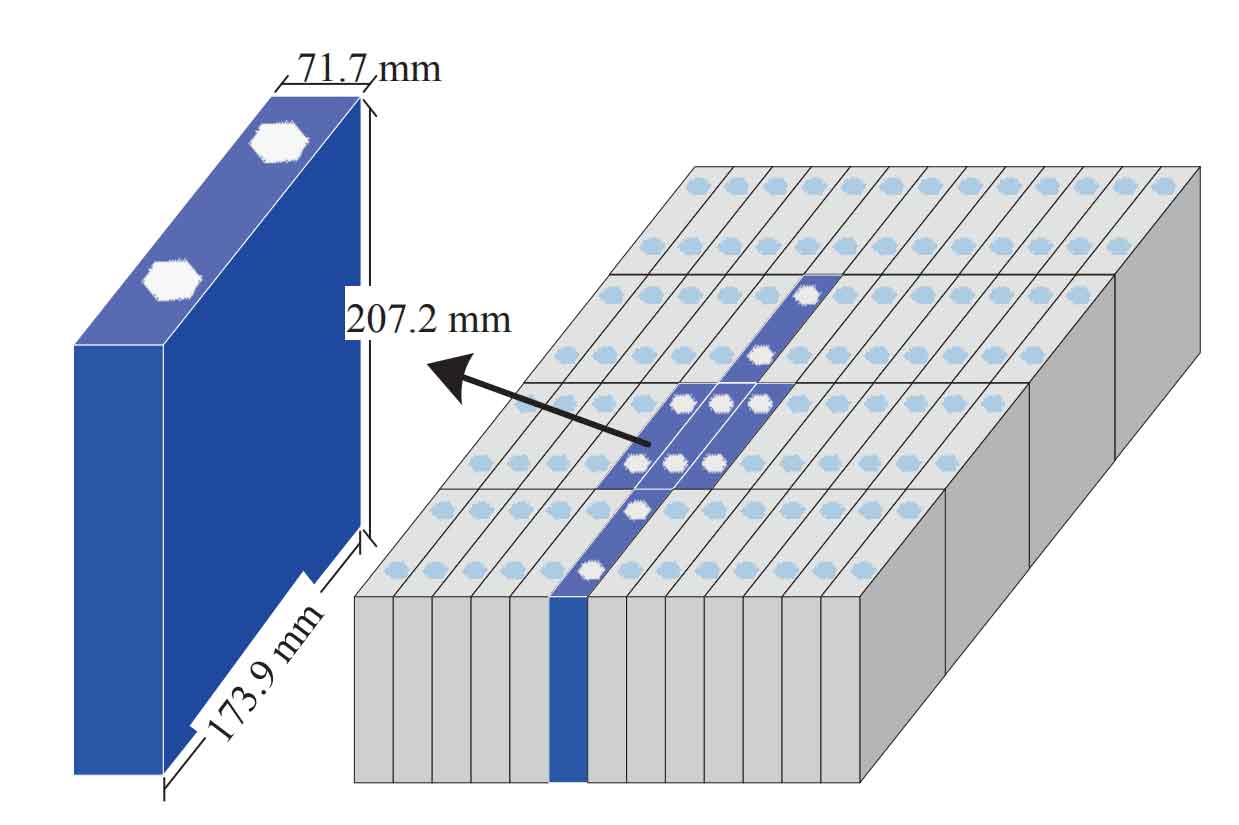
The experimental setup involved prismatic lithium iron phosphate batteries (3.2 V, 60 Ah) subjected to thermal abuse tests under controlled conditions. Key parameters measured include:
| SOC (%) | Trigger Temp (°C) | Peak Temp (°C) | Mass Loss (g) |
|---|---|---|---|
| 25 | 178.3 | 270.6 | 232.9 |
| 50 | 163.7 | 290.0 | 247.4 |
| 75 | 152.1 | 354.8 | 274.7 |
| 100 | 141.6 | 375.8 | 308.5 |
The critical temperature for thermal runaway initiation follows the relationship:
$$ T_c = -0.42 \cdot SOC + 189.6 $$
where \( T_c \) represents the trigger temperature in °C.
2. Thermal Runaway Dynamics
The lithium iron phosphate battery demonstrates SOC-dependent exothermic reactions during thermal runaway. The total energy release \( Q_{total} \) can be expressed as:
$$ Q_{total} = Q_{chem} + Q_{elec} + Q_{mech} $$
where:
– \( Q_{chem} \): Chemical decomposition energy
– \( Q_{elec} \): Electrical energy remaining at failure
– \( Q_{mech} \): Mechanical deformation energy
The characteristic time difference between thermal runaway initiation (\( t_i \)) and peak temperature (\( t_p \)) increases linearly with SOC:
$$ \Delta t = t_p – t_i = 3.12 \cdot SOC + 82.4 $$
3. Gas Emission Analysis
CO generation during thermal runaway follows distinct patterns based on SOC levels:
| SOC (%) | Max CO Concentration (ppm) | Emission Duration (s) |
|---|---|---|
| 25 | 134 | 58 |
| 50 | 180 | 112 |
| 75 | 311 | 167 |
| 100 | 353 | 203 |
4. Liquid Nitrogen Cooling Efficiency
The cooling effectiveness of liquid nitrogen was quantified through temperature decay analysis. For insulated battery enclosures, the cooling rate follows:
$$ \frac{dT}{dt} = -k(T – T_{amb}) + \frac{\dot{Q}_{gen}}{mc} $$
where:
– \( k \): Thermal conductivity coefficient
– \( \dot{Q}_{gen} \): Residual heat generation
– \( m \): Battery mass
– \( c \): Specific heat capacity
Key performance metrics for liquid nitrogen suppression:
| Enclosure Type | Minimum Temp (°C) | Temp Rebound (°C) | Cooling Duration (s) |
|---|---|---|---|
| Non-insulated | -105.1 | 43.2 | 1,450 |
| Insulated | -173.9 | 11.3 | 2,850 |
5. Thermal Runaway Propagation
The heat transfer between adjacent lithium iron phosphate batteries in modular configurations can be modeled using:
$$ \frac{\partial T}{\partial t} = \alpha \left( \frac{\partial^2 T}{\partial x^2} + \frac{\partial^2 T}{\partial y^2} + \frac{\partial^2 T}{\partial z^2} \right) + \frac{\dot{q}}{ρc_p} $$
where:
– \( \alpha \): Thermal diffusivity
– \( \dot{q} \): Volumetric heat generation
– \( ρ \): Density
– \( c_p \): Specific heat capacity
6. Mitigation Strategy Optimization
The optimal liquid nitrogen injection parameters for lithium iron phosphate battery systems were determined through parametric studies:
| Flow Rate (L/min) | Injection Duration (s) | Cooling Efficiency (%) | Suppression Success Rate (%) |
|---|---|---|---|
| 2.5 | 120 | 68.2 | 81.5 |
| 3.2 | 180 | 87.4 | 94.2 |
| 4.0 | 240 | 92.1 | 96.8 |
The suppression effectiveness \( η \) follows logarithmic relationship with nitrogen mass flow rate \( \dot{m} \):
$$ η = 22.7 \ln(\dot{m}) + 34.9 $$
7. Conclusion
This comprehensive analysis of lithium iron phosphate battery thermal runaway mechanisms reveals critical SOC-dependent characteristics and validates liquid nitrogen cooling as effective suppression strategy. The developed mathematical models and experimental data provide essential guidelines for designing safer energy storage systems utilizing lithium iron phosphate battery technology.