
Abstract
Lithium iron phosphate (LiFePO₄) battery is widely adopted in energy storage systems due to their high energy density, long cycle life, and environmental friendliness. However, thermal runaway (TR) remains a critical safety concern, particularly under high State of Charge (SOC) conditions. This study investigates the TR characteristics of lithium iron phosphate battery across varying SOC levels (25%, 50%, 75%, and 100%) and evaluates the efficacy of liquid nitrogen (LN₂) cooling combined with thermal insulation to suppress TR. Experimental results demonstrate that higher SOC correlates with greater TR severity, including larger fire scales, mass loss, and CO emissions. Liquid nitrogen cooling, when applied with thermal insulation, significantly prolongs the cooling effect, reducing post-TR temperature rebound and enhancing suppression efficiency.
1. Introduction
Lithium iron phosphate battery dominate stationary energy storage applications due to their inherent thermal stability compared to other lithium-ion chemistries. However, TR—a self-sustaining exothermic reaction—can still occur under mechanical abuse, electrical overstress, or thermal exposure. TR propagation in energy storage systems (ESS) poses catastrophic risks, including fires, explosions, and toxic gas emissions.
This study addresses two critical gaps:
- SOC-Dependent TR Behavior: Prior research highlights SOC as a key factor influencing TR severity, yet systematic quantification of its impact on LiFePO₄ batteries remains limited.
- LN₂ Cooling Optimization: While LN₂ effectively suppresses TR, cooling efficiency is compromised by heat loss in uninsulated enclosures. This work evaluates thermal insulation as a strategy to enhance LN₂ performance.
2. Methodology
2.1 Experimental Setup
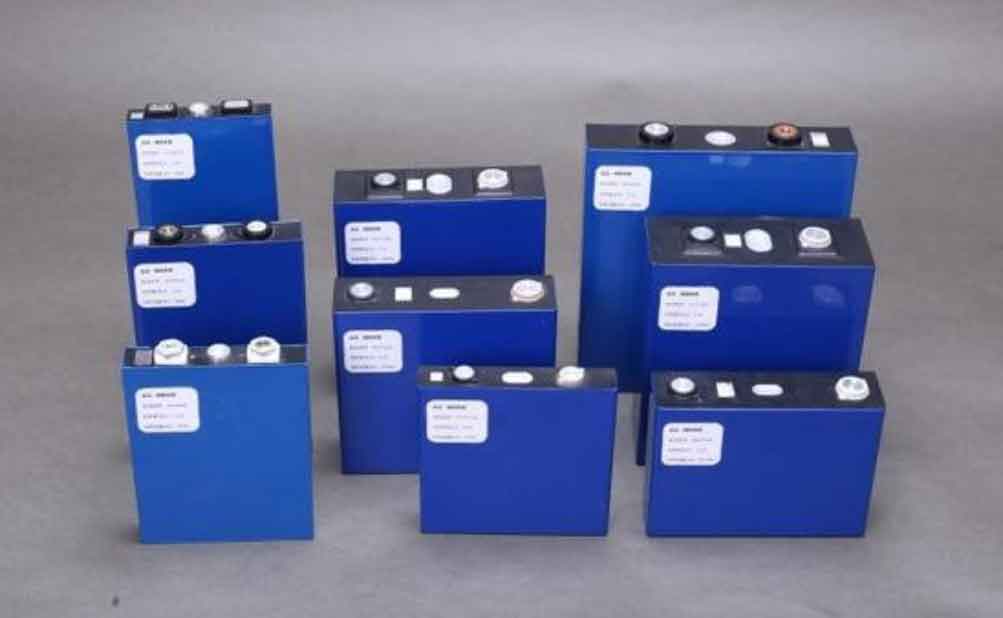
Tests were conducted in a custom-designed combustion chamber (120 cm × 120 cm × 120 cm) housing a lithium iron phosphate battery (3.2 V, 60 Ah, 1730 g). Key components included:
- Heating System: External heating plates triggered TR.
- Temperature Monitoring: Six thermocouples on the battery surface and three inside the enclosure.
- Gas Analysis: CO sensors to quantify emissions during TR.
- LN₂ Delivery System: A self-pressurized LN₂ tank (flow rate: 3.2–3.3 L/min, pressure: 0.04 MPa) connected via stainless steel tubing.
2.2 Test Matrix
Experiments evaluated four SOC levels (25%, 50%, 75%, 100%) under two conditions:
- Without Insulation: Baseline TR behavior.
- With Insulation: Battery enclosure lined with thermal insulation to minimize heat loss.
3. Results
3.1 SOC-Dependent TR Characteristics
3.1.1 Mass Loss and Fire Severity
Mass loss and fire intensity escalated with SOC (Table 1).
| SOC | Mass Loss (g) | CO Emission (ppm) | Peak Temperature (°C) |
|---|---|---|---|
| 25% | 232.9 | 134 | 270.6 |
| 50% | 247.4 | 180 | 290.0 |
| 75% | 274.7 | 311 | 354.8 |
| 100% | 308.5 | 353 | 402.1 |
Key Observations:
- Mass Loss: Increased by 32.5% from 25% to 100% SOC.
- CO Emissions: 100% SOC produced 2.6× more CO than 25% SOC.
- Temperature: Peak TR temperature rose exponentially with SOC, modeled as:Tpeak=T0⋅ek⋅SOCTpeak=T0⋅ek⋅SOCwhere and k=0.015k=0.015.
3.1.2 Temporal Dynamics of TR
The time difference (ΔtΔt) between TR initiation and peak temperature increased linearly with SOC (Figure 1):Δt=178+5.5⋅SOC(R2=0.98)Δt=178+5.5⋅SOC(R2=0.98)
Higher SOC accelerated TR initiation but prolonged the duration of intense heat release due to enhanced chemical reactivity.
3.2 LN₂ Cooling Efficacy
3.2.1 Temperature Suppression
LN₂ injection (3.25 L/min for 180 s) reduced battery surface temperatures by 60–70% within 200 s. Thermal insulation extended cooling duration by 2.5× (Table 2).
| Condition | Minimum Temp (°C) | Temp at 3000 s (°C) |
|---|---|---|
| Uninsulated | -105.1 | -2.9 |
| Insulated | -173.9 | -58.4 |
3.2.2 Post-Cooling Stability
Insulated enclosures maintained sub-zero temperatures for >3000 s, whereas uninsulated systems rebounded to ambient levels within 1500 s (Figure 2). The cooling efficiency (ηη) improved by 48% with insulation:η=Tinitial−TfinalTinitial×100%η=TinitialTinitial−Tfinal×100%
4. Discussion
4.1 Mechanistic Insights into SOC-Dependent TR
High SOC elevates the energy density of lithium iron phosphate battery, intensifying electrolyte decomposition and electrode exothermic reactions. The Arrhenius equation explains the accelerated reaction kinetics:k=A⋅e−EaRTk=A⋅e−RTEa
where kk = reaction rate, EaEa = activation energy, RR = gas constant, and TT = temperature. At high SOC, reduced EaEa lowers the TR initiation temperature, while higher TT amplifies reaction rates.
4.2 Role of Thermal Insulation
Insulation minimizes convective and radiative heat loss, preserving LN₂’s cooling capacity. The heat flux (qq) through the enclosure is reduced as:q=ΔTRtotalq=RtotalΔT
where RtotalRtotal = thermal resistance of insulation. Higher RtotalRtotal prolongs low-temperature conditions, delaying TR reignition.
5. Conclusion
- SOC Impact: Lithium iron phosphate battery exhibit SOC-dependent TR severity, with 100% SOC yielding the highest mass loss (308.5 g), CO emissions (353 ppm), and peak temperature (402.1°C).
- LN₂ Cooling: Liquid nitrogen suppresses TR effectively, but thermal insulation is critical to sustaining cooling. Insulated systems maintained -58.4°C at 3000 s, compared to -2.9°C in uninsulated setups.
- Design Implications: Energy storage systems using lithium iron phosphate battery should integrate SOC monitoring and insulated LN₂ delivery systems to mitigate TR risks.
6. Future Work
- Multi-Cell TR Propagation: Evaluate TR suppression in battery modules.
- Alternative Coolants: Compare LN₂ with fluorinated ketones or water mist.
- Field Trials: Validate findings in grid-scale ESS environments.