
In the context of “dual carbon”, the proportion of renewable energy generation is constantly increasing, while the retention of traditional thermal motor assembly machines needs to be gradually reduced. Given the randomness and intermittency of renewable energy output, maintaining real-time source load balance in new power systems with a high proportion of new energy access is extremely challenging. Matching energy storage in the system and effectively cooperating with traditional thermal power units is a necessary measure for the development of new power systems. However, a single type of energy storage is difficult to meet the needs of the new power grid for high-power, high-capacity, and high-frequency charging and discharging of energy storage systems. Under the existing engineering and technical conditions, pumped storage and compressed air storage have the potential for medium to long-term energy storage, which can be regulated during the day; Electrochemical energy storage is generally used for daily peak shaving or frequency modulation. The comprehensive utilization of the two can not only achieve complementary advantages, but also effectively reduce the total investment cost of energy storage systems.
According to the matching scenarios in the power grid, research on energy storage capacity matching can be divided into power supply side, power grid side, and load side. On the power side, a grid connected wind farm with energy storage was modeled, and the energy storage capacity matching scheme was evaluated based on the smooth results of wind power. The combination of internal power scheduling and energy storage capacity configuration in the system has achieved a matching of energy storage capacity that balances economic efficiency and wind power suppression effects. Reference [14] matched the energy storage capacity and transmission line capacity of remote photovoltaic power stations through distributed robust optimization, reducing the adverse impact of data errors on energy storage matching. On the power grid side, a distributed robust optimization method for energy storage capacity matching is proposed, taking into account wind power uncertainty, wind abandonment constraints, and power flow constraints. A double-layer optimization model based on battery cycle life and marginal economic benefits was constructed, achieving the optimal capacity matching of the grid side electrochemical energy storage system. In terms of load side, based on demand side response, capacity matching is carried out for distributed optical storage microgrids, reducing waste of light and electricity while improving the economic efficiency of investment. A distributed energy storage planning method based on game algorithm was proposed to achieve energy storage capacity matching for demand side users. Reference [19] proposes a new demand side management method for determining the optimal capacity of photovoltaic, wind turbine, and battery energy storage in independent home user systems.
The above references for energy storage capacity matching are all time-domain models, and their main drawback is that the scale of the problem will linearly increase with the increase of the time period to be solved. Therefore, time-domain models can usually only perform short-term or typical daily planning, making it difficult to consider the impact of seasonal changes in source loads on thermal power units and multiple types of energy storage at the annual scale. In contrast, the frequency domain model is less affected by the time scale and is an effective solution for long-term energy storage capacity planning: by setting cutoff frequency breakpoints to split the power spectrum, the allocation of unit and energy storage power is achieved. Reference [20] modeled a large-scale wind power integration system, using grid frequency deviation and investment economy as indicators, and designed an iterative algorithm for optimal energy storage capacity. The frequency boundary points were obtained in stages to achieve multi-level optimization and matching of hybrid energy storage capacity. Reference aimed at microgrids containing renewable solar and solar energy, and determined the optimal cutoff frequency through gradient method cyclic iteration, achieving capacity matching between diesel generators and battery energy storage. A frequency domain analysis model for minimum compensation power has been established, achieving the consumption of intermittent new energy in the power grid and optimizing the matching of energy storage capacity. The coordinated capacity optimization of pumped storage battery energy storage composite was achieved by taking the sum of energy storage investment operation cost, opportunity compensation cost, and pollution discharge cost as the optimization objective. Reference proposed a hybrid energy storage capacity optimization model for microgrid systems that takes into account energy storage life, verifying the effectiveness of hybrid energy storage in extending energy storage life.
The above references have conducted in-depth research on energy storage capacity matching from a frequency domain perspective, but there are also shortcomings: firstly, the setting of frequency breakpoints has defects: a single frequency component can only be allocated to thermal power units or a certain type of energy storage rather than jointly undertaking it, which may lead to suboptimal solution results. Secondly, it is difficult to calculate the optimal frequency breakpoint. The single optimal frequency segmentation point can be obtained through gradient method cyclic iteration; But when there are multiple types of energy storage in the system, multiple breakpoints may occur. At this point, the model can only be solved through the traversal method [26] or intelligent algorithm [27], resulting in low computational efficiency. Thirdly, the regulating capacity of thermal power units has not been fully utilized. In the reference literature, thermal or diesel units often only participate in the regulation of low-frequency components, and the corresponding power curve fluctuations are far from reaching the limit of climbing speed; If thermal power units participate in the allocation of appropriate high-frequency components, the peak value of the curve may actually decrease, thereby reducing the demand for installed capacity.
To address the above issues, this article conducts in-depth research on the evaluation of demand for thermal power multi type energy storage capacity, and proposes a capacity matching method based on spectral distribution coefficient for thermal power multi type energy storage. Firstly, the net load power is converted into frequency domain signals through DFT, and then the continuous variable of spectral distribution coefficient is introduced to fully decompose the spectrum, so that a single frequency component can be shared by thermal power and energy storage; Finally, the corresponding power curve is obtained through inverse transformation (IDFT) to obtain the optimal matching scheme for fire storage. The method proposed in this article has the following three advantages: firstly, it can achieve multi type allocation of a single frequency component, and the model setting is reasonable; Secondly, the solving model can be reduced to linear programming, which significantly improves the solving efficiency; Thirdly, the limitation of thermal power based on cut-off frequency method only participating in low-frequency regulation is overcome, and the regulation potential of thermal power units is fully utilized.
1.Description of the matching problem between thermal power and multiple types of energy storage capacity
The planning of new power grids under the background of “dual carbon” can be roughly divided into three aspects:
1) The planning of new energy installed capacity represented by wind and light mainly considers the matching of the total amount of new energy access and the selection of the ratio of wind and solar to meet the demand for clean energy supply.
2) The reserve plan for installed capacity of thermal power units: At present, the capacity of thermal power units in the power grid is large, and some units need to be withdrawn to reduce carbon emissions. At the same time, the reserved units should have a certain adjustment margin to cope with the intermittent output of new energy. When planning the reserved capacity of thermal power units, only the annual operating cost of thermal power units needs to be considered.
3) Capacity matching planning for multi type energy storage: The integration of energy storage can effectively improve the system’s ability to absorb new energy. When planning for multi type energy storage capacity, it is necessary to consider the investment and operating costs of energy storage.
In the actual planning and construction process of the power grid, 1) it is constrained by regional natural resources and the planning cycle is long, which needs to be prioritized and usually assumes that the approximate load changes of the planning target year are known. Therefore, the matching problem between thermal power and multi type energy storage capacity is to take 1) as a fixed boundary condition, that is, considering the stability of the system’s source load balance and the economy of investment and operation, and coordinating 2) and 3) to obtain the optimal thermal power installed reserve and multi type energy storage capacity, given the known target year’s new energy installed capacity and load.
2.Annual net load of the power grid and its frequency domain decomposition
2.1 Pre processing of annual net load of the power grid
The net load Lt of the power grid at time t is defined as the difference between the total load demand of the system at time t and the total output of various renewable energy sources:
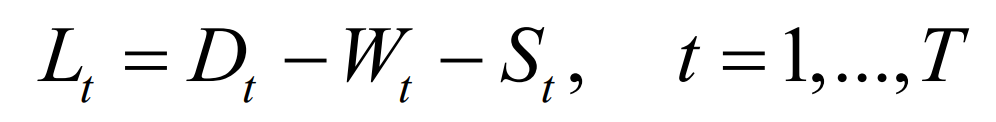
In the formula: Dt is the total load demand at time t; Wt is the actual wind power output at time t; T S is the actual photovoltaic output at time t. T is the number of time periods included; According to power balance, the net load of the power grid at any time should be jointly balanced by thermal power and multiple types of energy storage:
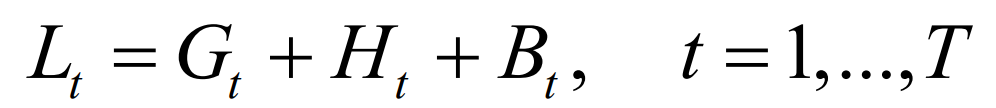
In the formula: Gt is the output power of the thermal motor set at time t; Ht and Bt respectively represent the power provided by pumped storage and battery storage at time t.
As the proportion of renewable energy access continues to increase, the DC component of net load power decreases and the fluctuation amplitude increases. In extreme situations where wind and solar power output is high, the power curve may exhibit significant negative values. Due to the fact that the output of thermal power units cannot be negative, the net load negative power can only be charged and consumed by the energy storage system. Continuous and significant negative power can significantly increase the capacity burden of energy storage systems and reduce the economic efficiency of energy storage investments. To reduce the impact of extreme situations, a small amount of wind and light can be discarded within a certain range to reduce the peak negative power of the net load. For the data of the total T period throughout the year, the following preprocessing method is adopted: while meeting the requirements of new energy comprehensive utilization rate and electricity ratio, the minimum value of maximizing net load can be expressed as:
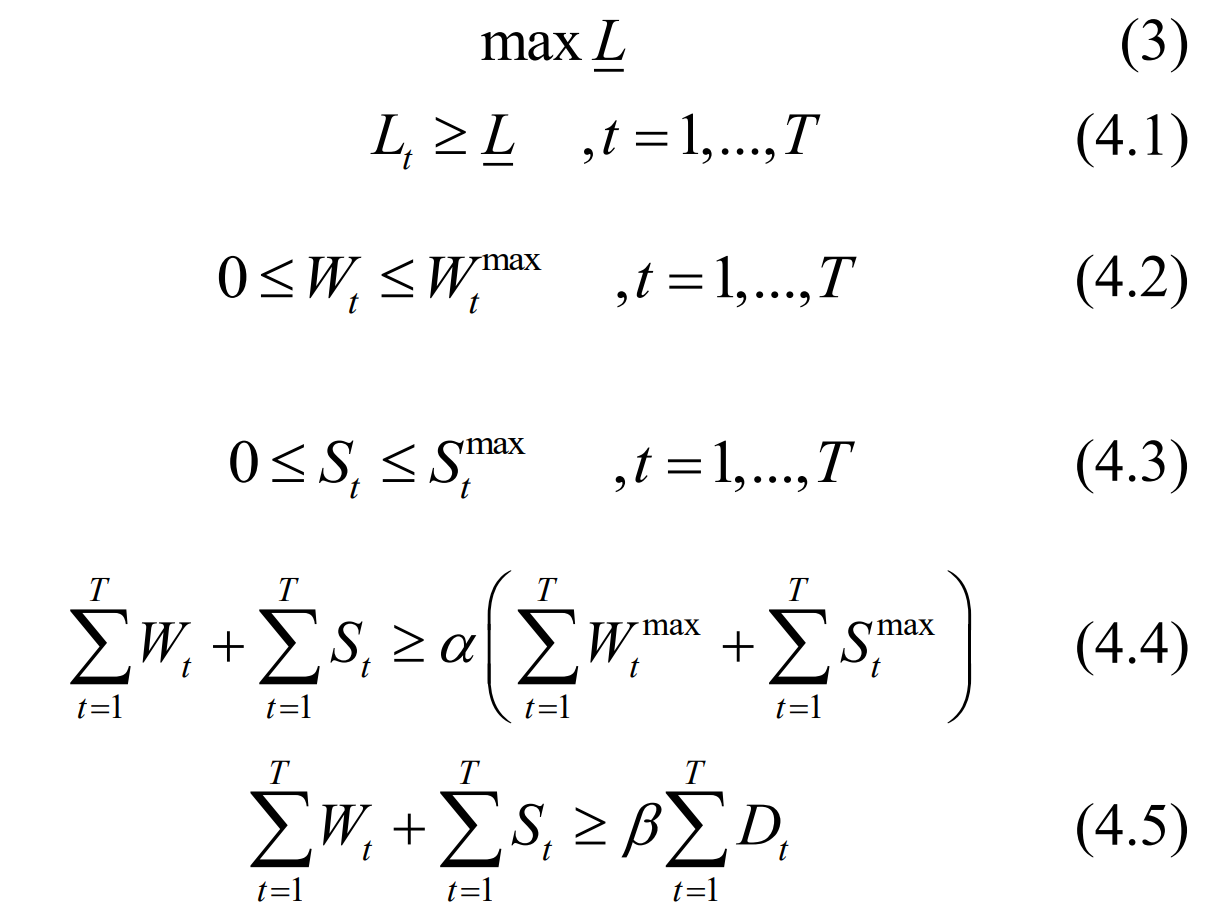
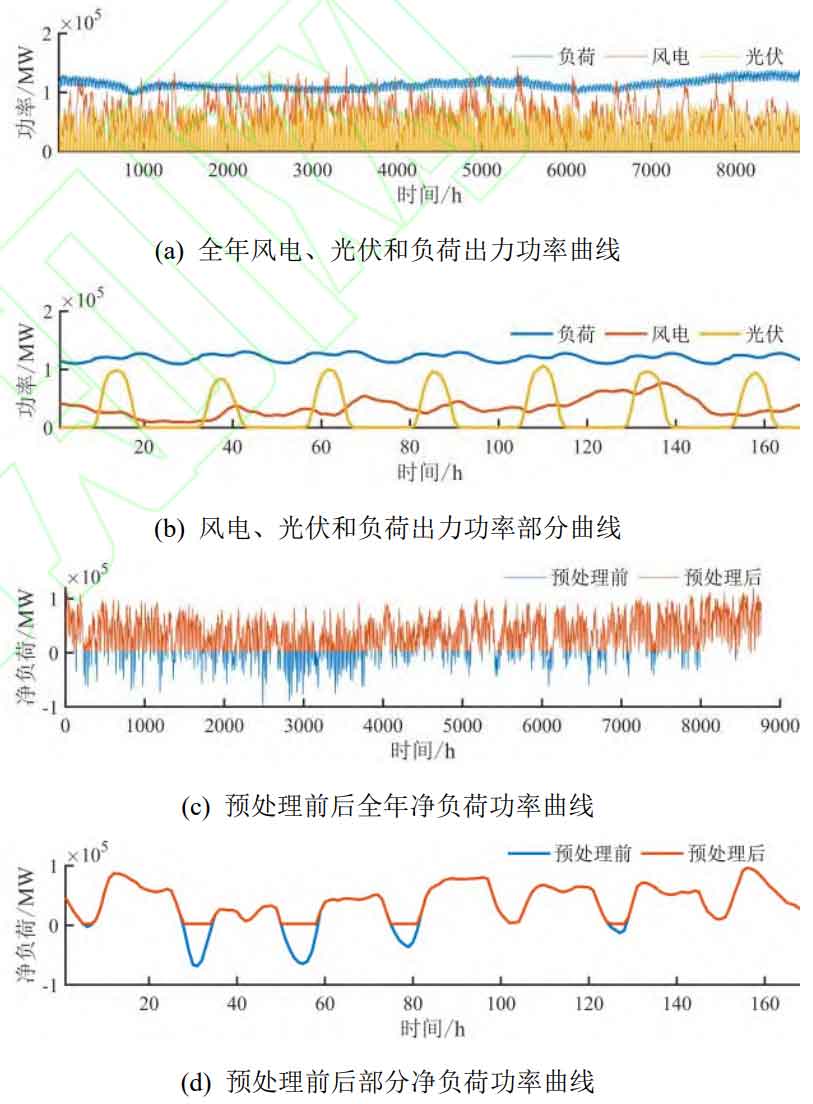
In the formula: L is the auxiliary variable, representing the minimum net load value; Max Wt is the maximum wind power output at time t; Max St is the maximum photovoltaic output at time t; α Is the utilization rate of new energy; β The proportion of new energy output to load power. Among them, equation (4.1) is the constraint of auxiliary variables as the minimum net load value; Equations (4.2) and (4.3) respectively indicate that the utilization power of wind power and photovoltaic power at a certain time is not negative and cannot exceed the actual power of wind and solar power at the corresponding time; Formula (4.4) is a constraint on the abandonment of new energy, which limits the total abandonment of new energy throughout the year to no more than 1- α; Formula (4.4) is a constraint on the proportion of new energy electricity, requiring that the annual output electricity of new energy account for no less than the total load demand electricity β。 Figure 1 (a) shows the annual load, wind power, and photovoltaic power curves of a certain regional power grid; Figure 1 (b) shows the data for one week in detail; take α 95%, β 50%, the annual net load before pretreatment calculated by equation (1) and the annual net load after pretreatment (3) – (4) are shown in Figure 1 (c); Figure 1 (d) shows the data for one week in detail:
2.2 Spectrum analysis of annual net load of the power grid
Discrete Fourier Transform (DFT) can convert time-domain discrete data into frequency-domain discrete data, and its conversion formula is:
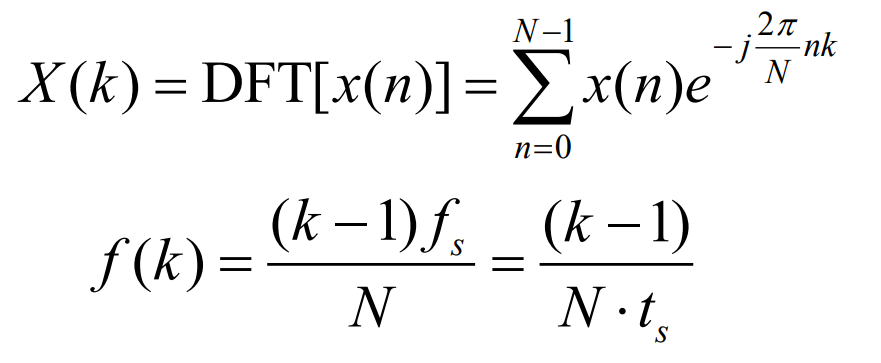
In the formula: k=0,1, N-1 is the sequence number of the spectrum; N is the length of the discrete data sequence, which is also the number of sampling points; Fs is the sampling frequency, and ts is the sampling period. Using DFT to obtain complex sequences for net load sequence Lz:
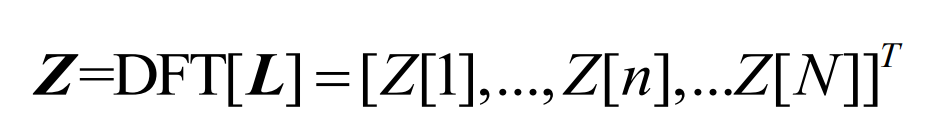
According to the sampling theorem, the complex sequence Z is conjugate symmetric with respect to the Nyquist frequency fN=fs/2. When analyzing the amplitude frequency characteristics, only the first half, which corresponds to the frequency 0~fs/2, needs to be considered:
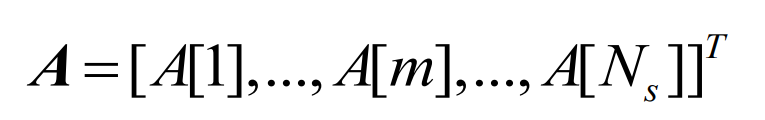
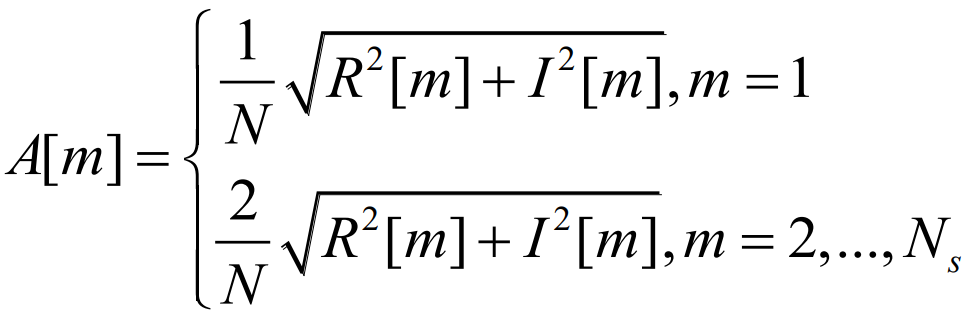
In the formula: Ns=⌊N/2 ⌋+1, ⌊⌋ represents rounding down; The calculation method for frequency amplitude A [m] is:
The amplitude frequency characteristics and logarithmic amplitude frequency characteristics of the annual net load series obtained through DFT transformation are shown in Figure 2:
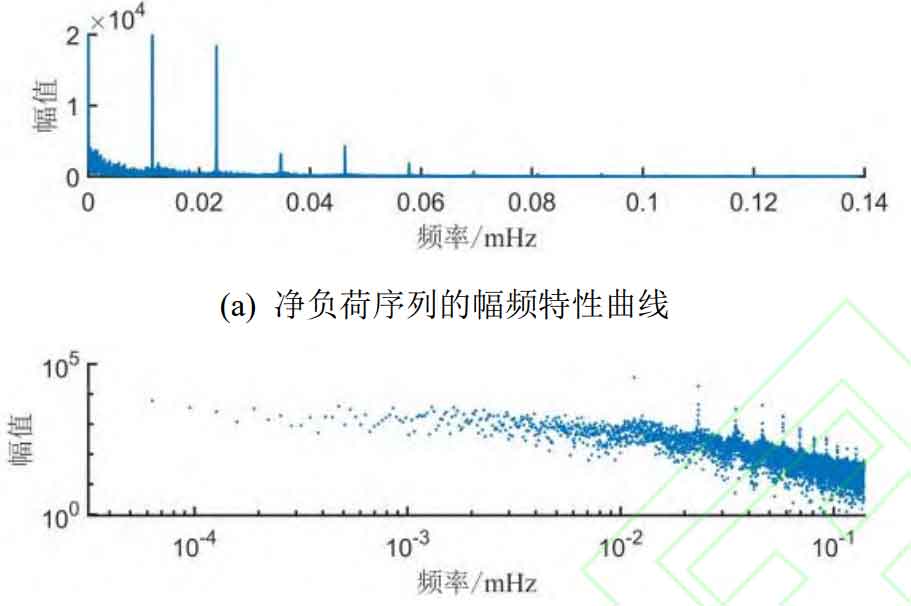
It can be seen that the net load spectrum has the following typical characteristics:
1) Large amplitude of specific frequency components: In addition to the DC component, the annual net load curve includes some “typical periodic components” with significantly higher amplitudes than nearby frequencies, such as components with periods of 24 hours, 12 hours, 8 hours, 4.8 hours, and 4 hours.
2) The amplitude of the medium to high frequency part is generally very small, and the overall spectrum amplitude shows a decreasing trend with increasing frequency.
2.3 Frequency domain decomposition based on spectral distribution coefficients
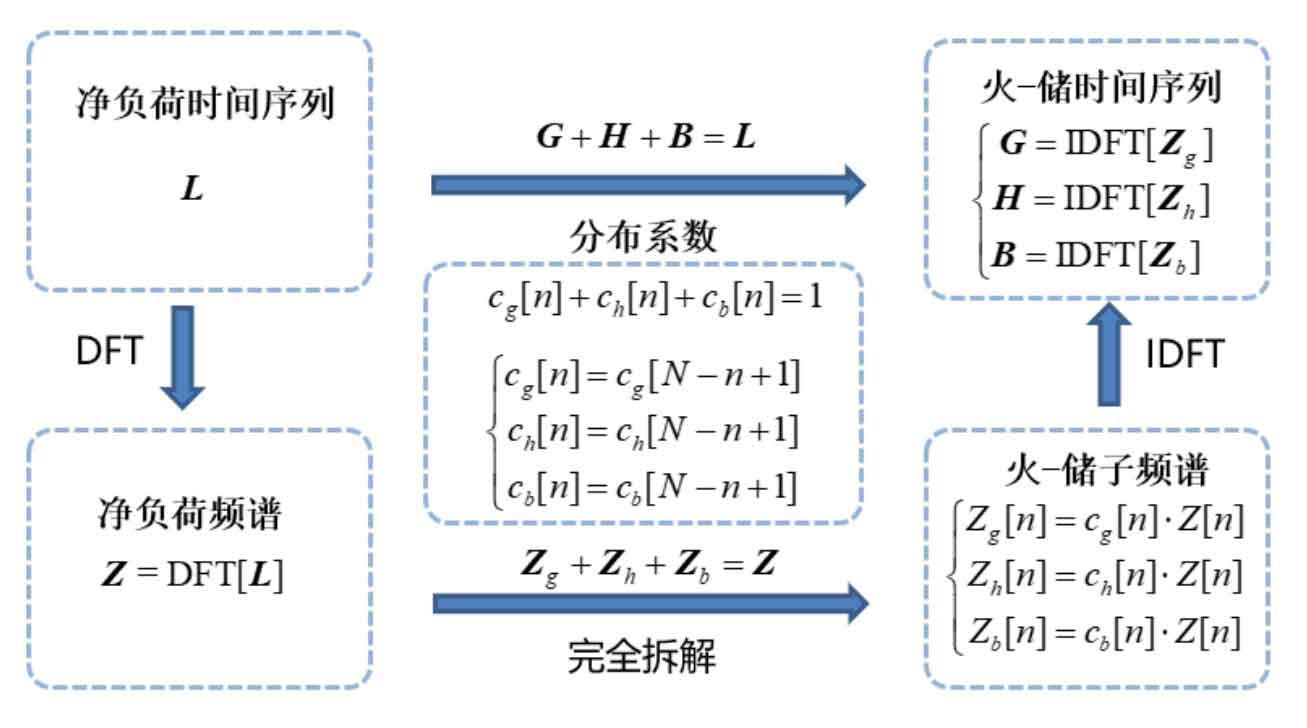
Fully decompose the spectrum of the net load sequence into several sub spectra, and then use IDFT inverse transformation to obtain the time-domain power curves corresponding to thermal power and various types of energy storage. The main decomposition method currently used in research is the “cut-off frequency method”: set a certain cut-off frequency fc, decompose the original spectrum from the corresponding breakpoint into low-frequency part Low and high-frequency part High, and allocate them to thermal power and energy storage respectively, namely:
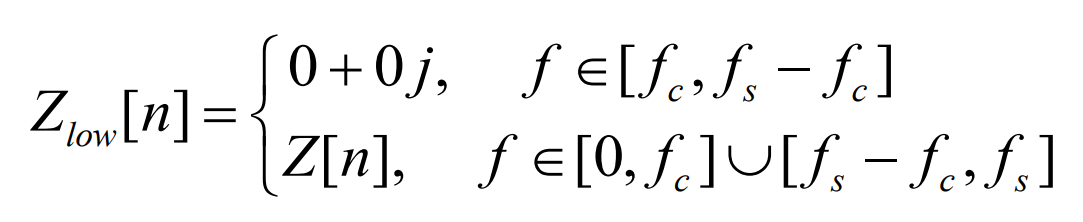
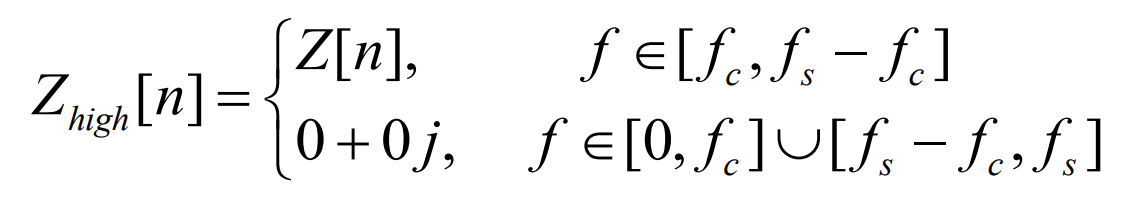
It can be seen that the cut-off frequency method is a complete decomposition of the original spectrum, satisfying the condition of Zlow+Zhigh=Z. Based on the reversibility of DFT, the sum of the sequences after complete frequency domain decomposition and inverse transformation is equal to the original sequence. That is, the time-domain signals Llow and Lhigh of the two parts of the spectrum after IDFT transformation naturally satisfy the condition of Llow+Lhigh=L.
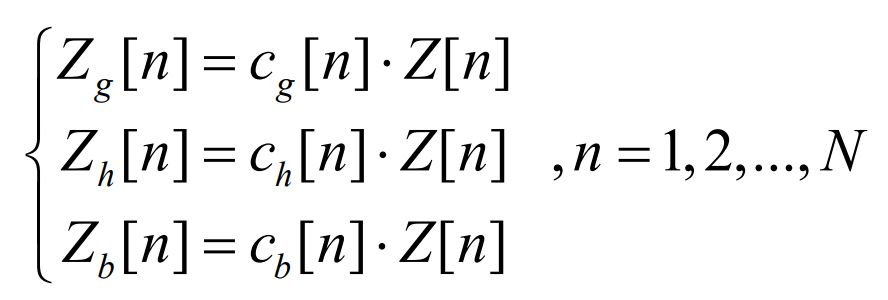
The essence of the cut-off frequency method is the allocation of sub spectra of a single frequency, which is a 0-1 integer programming problem. Compared to the optimization problem of continuous variables, it is more difficult to solve. In addition, the biggest drawback of this method is that a single frequency can only be assigned to a certain sub spectrum, and there is no situation of assigning to multiple sub spectra. If there is a frequency component with a large amplitude in the original spectrum, whether allocated to thermal power or energy storage, the calculated capacity demand will be large, corresponding to high investment costs. In order to overcome the limitations of the cut-off frequency method, this article introduces the continuous variable spectrum distribution coefficients cg, ch, and ch, which can simultaneously allocate a single frequency to thermal power units, pumped storage, and battery storage:
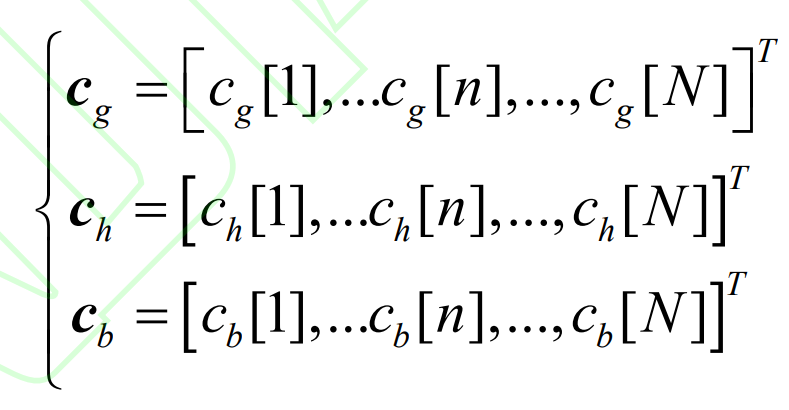
Among them, cg, ch, and cb are N-dimensional vectors, and each element is multiplied by the corresponding position element of the spectrum complex sequence Z to obtain the corresponding sub spectrum, achieving “spectrum splitting”. Since cg, ch, and cb are continuous variables, the allocation of corresponding spectra is also continuous. After allocation of spectrum distribution coefficients, the spectrum complex sequence corresponding to thermal power units, pumped storage, and battery storage is:
The complex sequence can be transformed into a time-domain signal through Inverse Discrete Fourier Transform (IDFT) to obtain the time-domain power sequences G, H, and B for the allocation of thermal power units, pumped storage, and battery energy storage:
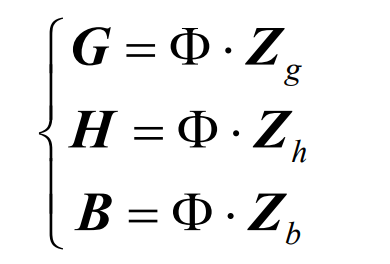
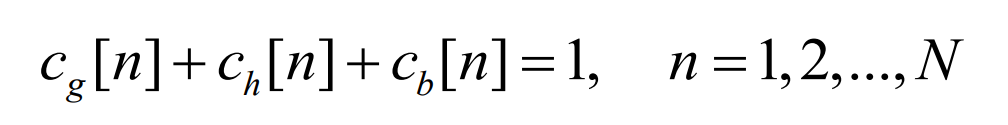
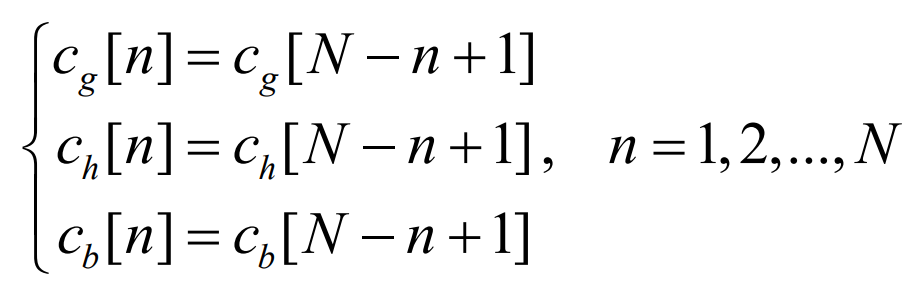
In the equation: Φ Is the IDFT transformation matrix of N X N,; Similarly, the spectral distribution coefficients also need to meet the conditions of complete decomposition and conjugate symmetry:
The overall logic of the spectral distribution coefficient method introduced in this chapter can be described in Figure 3.
It should be noted that although the spectral distribution coefficient is a continuous variable, there are no upper and lower bounds. The negative spectral distribution coefficient still has physical significance: it corresponds to a spectral signal with an amplitude equal to its amplitude but opposite in phase. Compared to the cut-off frequency method, the spectral distribution coefficient method has the following significant advantages:
1) It can achieve multi type allocation of a single frequency, reducing the adverse impact of high amplitude frequency components on the capacity solution results.
2) Continuous variable optimization models have higher solving efficiency.
3) Without strict high and low frequency limits, thermal power can also participate in the allocation of high-frequency components appropriately, and the potential for regulation can be fully utilized.
2.4 Net load spectrum clustering
Taking the sampling period of 1 hour as an example, the annual net load sequence corresponds to N=8760 and N=4380 seconds, with a large number of frequencies and corresponding frequency distribution coefficient variables, resulting in relatively low computational efficiency. If frequency spectra of similar frequencies can be clustered and calculated uniformly, it can effectively save computational costs. According to the typical characteristics of the net load spectrum sequence described in 1.2, the clustering method shown in Figure 4 is adopted:
1) DC component: 1 group separately, allocated to thermal power units.
2) Typical periodic components: Periodic components with larger amplitudes are grouped separately, namely: 24 hours, 12 hours, 8 hours, 6 hours, 4.8 hours, 4 hours, 3.4 hours, 3 hours, 2.67 hours, 2.4 hours, 2.2 hours, a total of 11 groups.
3) Interval component: The small amplitude frequency components between adjacent “typical periodic components” are merged into one group. Specifically, due to the relatively large amplitude in the low-frequency region and the practical significance of the spectrum, this article divides the “interval components” between the DC to 24-hour periodic components again into four groups: year month component, month week component, week half week component, and half week day component, with a total of 15 groups of “interval components”. The typical periodic and interval components can be shared by thermal power units and different types of energy storage.
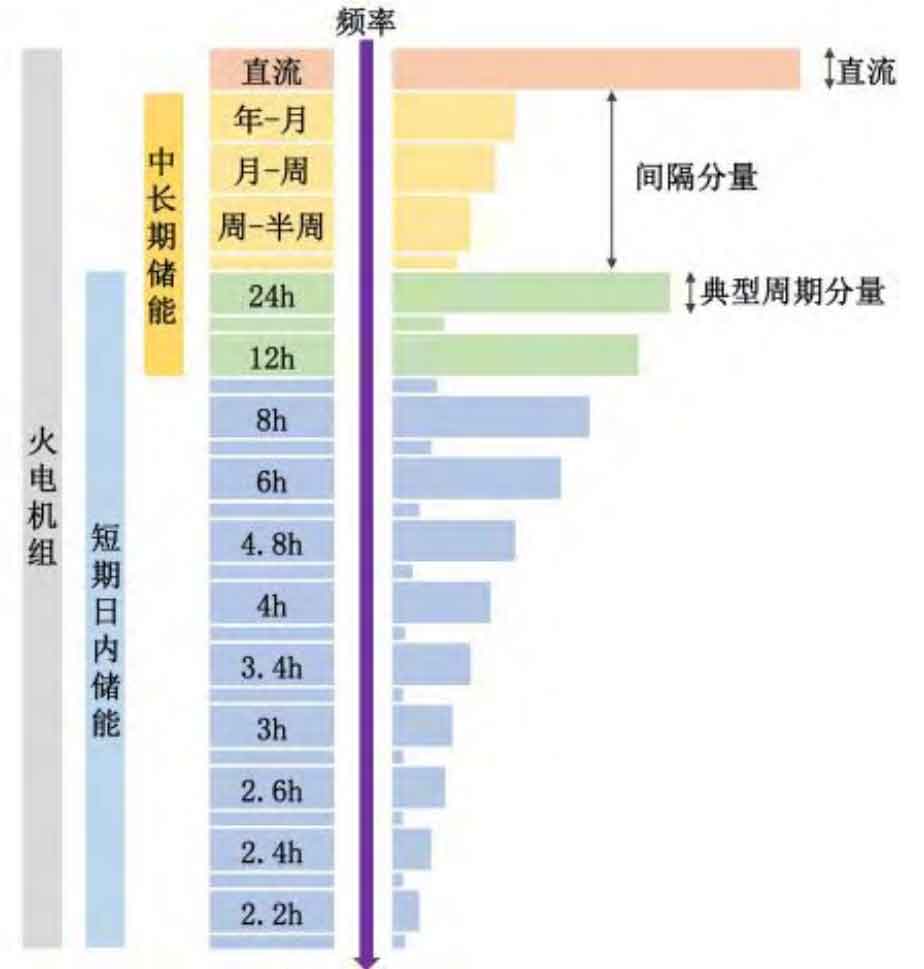
After clustering, the single frequency of the net load spectrum with Ns=4380s is replaced by the aforementioned Nc/2=27 clustering components. The specific clustering correspondence is shown in Table A1 of Appendix A. In equations (12) – (16), N=8760 is replaced by Nc=54, which greatly reduces the number of variables and is conducive to fast and efficient problem solving. It should be pointed out that the clustering method of the spectrum is not unique, and a more detailed division method corresponds to a larger number of variable groups, requiring longer calculation time and more computing resources.
3.Optimization model for thermal power multi type energy storage capacity based on continuous spectrum distribution coefficient
3.1 Model objective function
In order to determine the optimal retention capacity and mixed energy storage capacity of thermal power units, the objective function needs to comprehensively consider the operating cost of thermal power units and the investment and operating costs of various types of energy storage, namely:
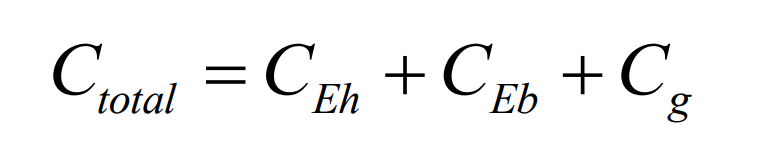
In the formula, CEh represents the total cost of pumped storage, CEb represents the total cost of battery energy storage, and Cg represents the total cost of thermal power units.
3.1.1 Energy storage investment cost
The total investment and operation cost of the energy storage system mainly includes the initial acquisition cost and operation and maintenance cost. Due to the different life cycles of each energy storage system, it is necessary to convert the total investment and operation cost of energy storage into an equivalent annual value, expressed as:
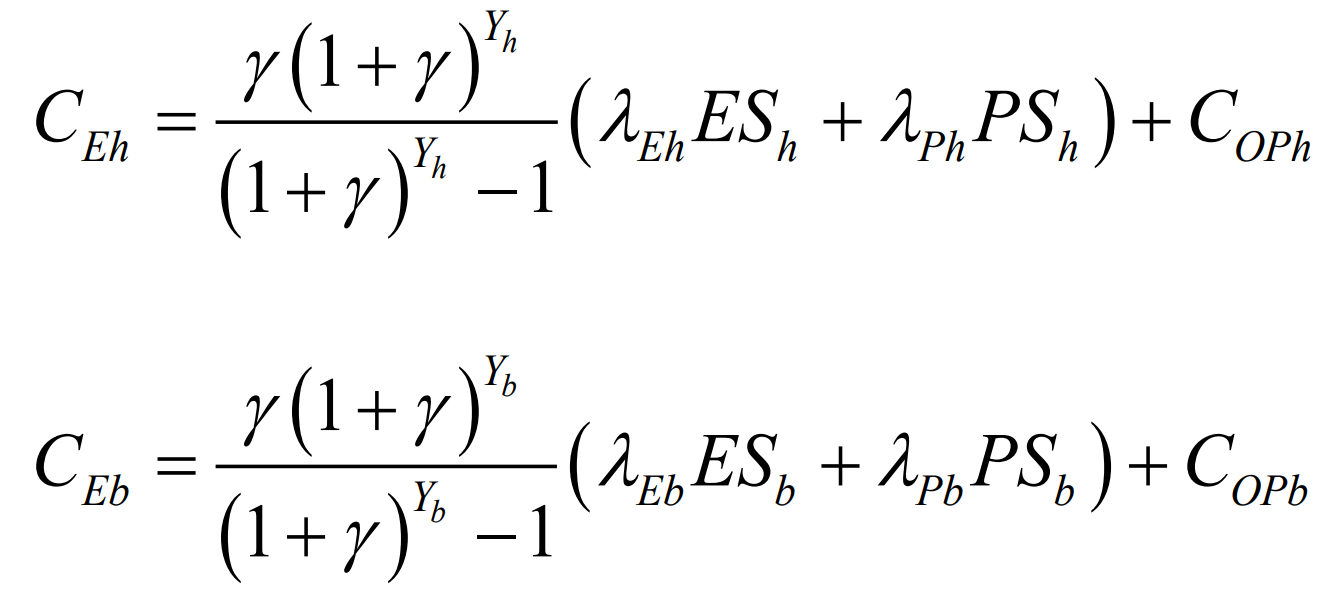
In the equation: γ Is the annual interest rate; Yh and Yb are the service life of pumped storage and battery storage, respectively; λ Eh, λ Ph, λ Eb, λ Pb represents the unit capacity cost and unit power cost of pumped storage and battery storage, respectively; ESh, PSh, ESb, and PSb represent the rated capacity and power of pumped storage and battery storage, respectively; COPh and COPb are the annual operating and maintenance costs for pumped storage and battery storage, respectively.
3.1.2 Operating costs of thermal power units
The total cost Cg of thermal power units includes two parts: basic output cost and compensation cost. Among them, the basic output cost is the cost required to provide the thermal power curve. During the operation of the fire storage integrated system, both the charging and discharging of energy storage have energy losses. As the DC component is usually borne by thermal power, the energy storage power curve determined by DFT is composed of periodic components, and the algebraic sum of power within a complete cycle is 0; In order to further ensure that the initial and final values of energy storage are approximately consistent, it is necessary for thermal power units to compensate for energy losses during the charging and discharging process, and the corresponding power generation cost is defined as compensation cost.
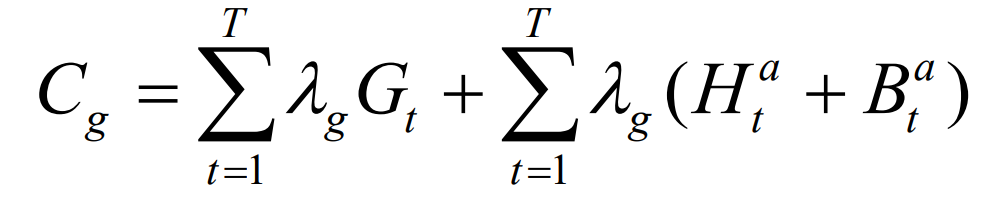
In the formula: Cg is the total cost of the thermal power unit; Among them, the first term is the basic output cost of thermal power expressed using a linear function, λ G is the unit output cost of the thermal power unit; The second item is the thermal power compensation cost expressed using a linear function. A Ht and a Bt are the compensation power of the thermal power unit for pumped storage and battery storage at time t, respectively, meeting the following requirements:
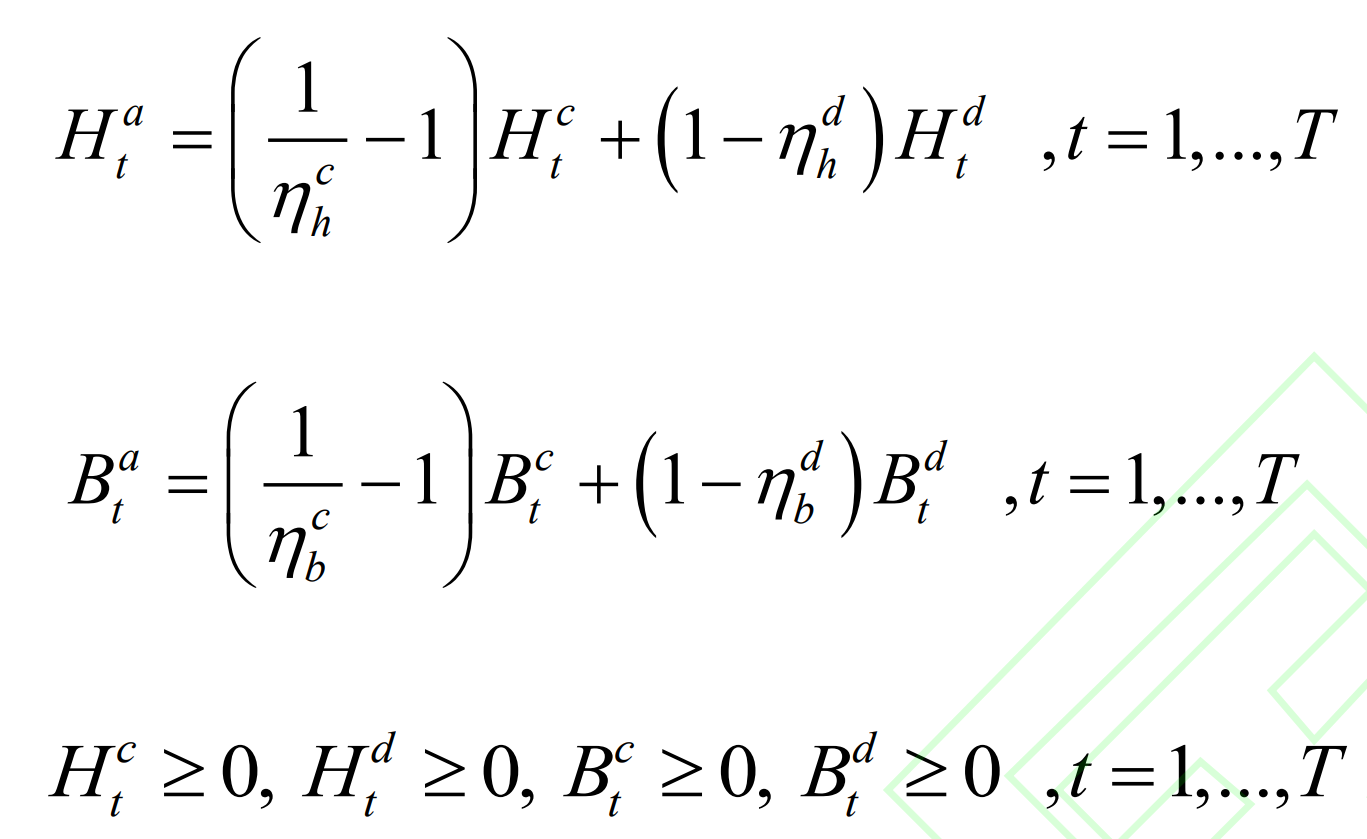
In the formula, Hct, Hdt, Bct, and Bdt respectively represent the charging and discharging power of pumped storage and battery storage at time t; η Ch, η Dh is the charging and discharging efficiency of pumped storage energy; η Cb, η Db is the charging and discharging efficiency of the battery energy storage. According to (23), Hat and Bat are positive. The physical meaning of Hat is to compensate for the power loss generated by the charging and discharging power Hct and Hdt of the pumped storage energy at time t, which are the two terms on the right side of equation (21), to meet the power balance. Bat is the same. In addition, it is also necessary to meet the following requirements:
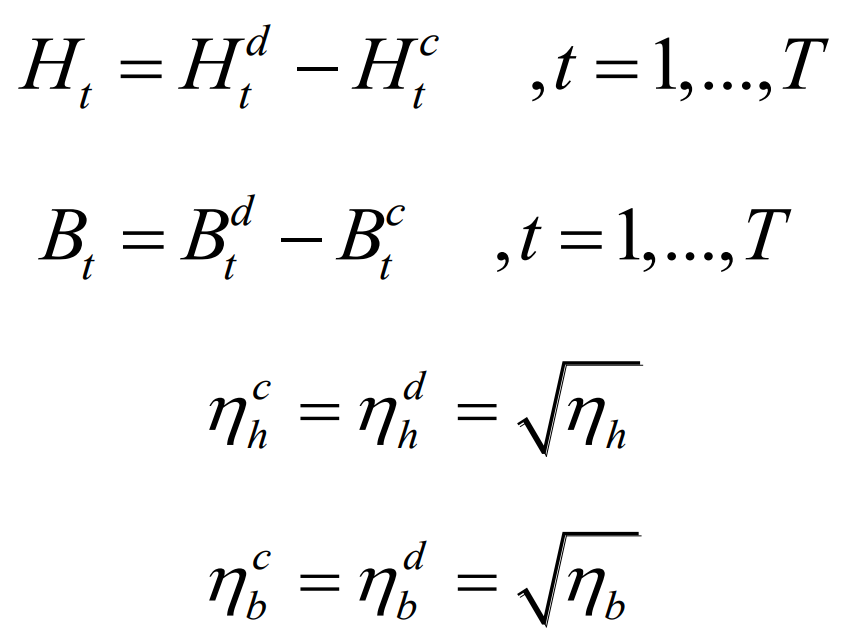
In the equation: η H is the periodic charging and discharging efficiency of pumped storage energy, η B is the periodic charging and discharging efficiency of battery energy storage.
3.2 Model constraints
3.2.1 Spectrum distribution coefficient constraints
From 2.3, it can be seen that the spectral distribution coefficients need to meet the complete decomposition condition (15) and the conjugate symmetry condition (16). On this basis, it is necessary to allocate the spectrum according to the actual needs of various parts of the system: the DC component of the net demand power should be fully borne by the thermal power unit, and each energy storage should work within an appropriate frequency range. Pumped storage is suitable for participating in the regulation of low-frequency and large signals, while battery storage is suitable for participating in the regulation of high-frequency signals, which can be expressed as:
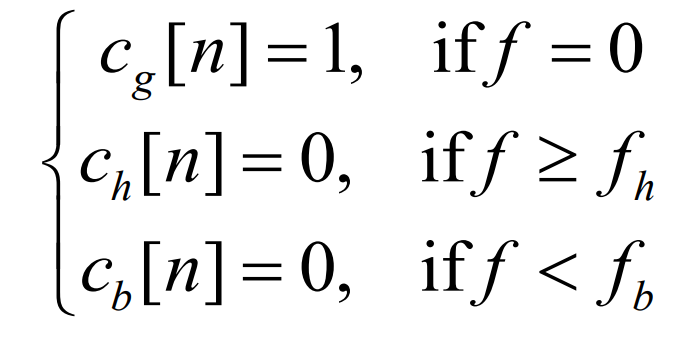
In the formula, fh is the highest frequency borne by pumped storage, fb is the lowest frequency borne by battery storage, and f=0 represents the DC component.
3.2.2 Constraints for thermal power units
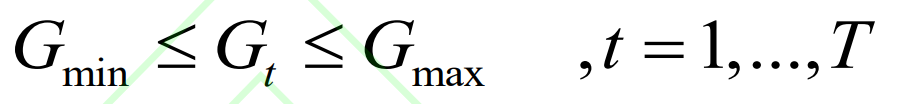
Considering each thermal power unit as a whole, its output power should be limited by the upper limit Gmax and lower limit Gmin of the thermal power unit output:
In addition, the output of adjacent time nodes of thermal power units should also meet the climbing constraint conditions:
In addition, the output of adjacent time nodes of thermal power units should also meet the climbing constraint conditions:

In the formula, Eht is the energy storage of pumped storage at time t, and Ebt is the energy storage of the battery at time t.
3.3 Thermal power – multi type energy storage capacity matching
3.3.1 Energy storage capacity matching
The calculation formula for the rated capacity and rated power of each energy storage can be expressed as:
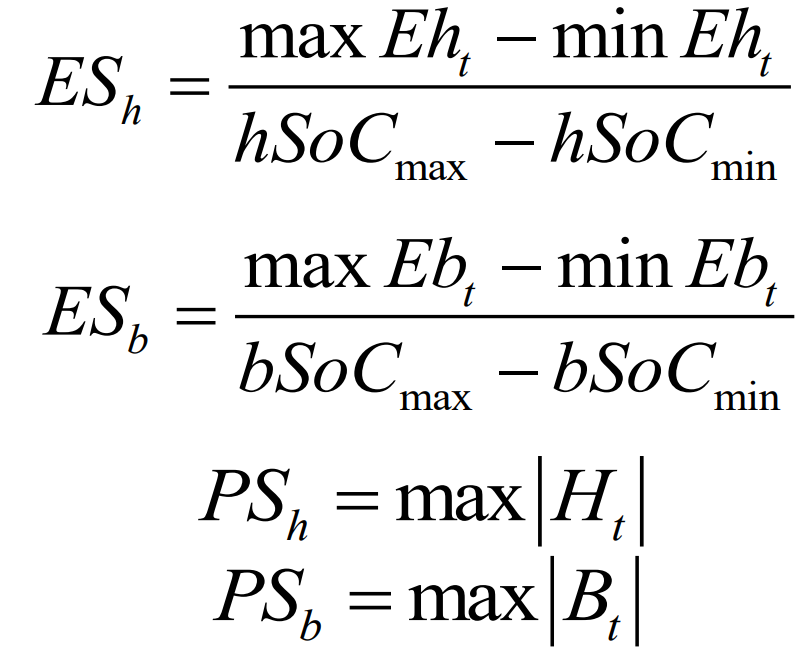
In the equation: Max hSoC, min hSoC, max bSoC, min bSoC are the maximum and minimum SoC values for pumped storage and battery storage, respectively.
3.3.2 Matching of thermal power installed reserve
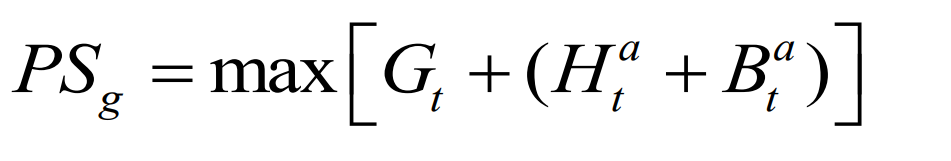
The installed power reserve of thermal power units is defined as the sum of the basic output capacity and compensation capacity. Among them, the basic output capacity is determined by the maximum value of the thermal power curve obtained through frequency spectrum decomposition and inverse transformation; The compensation capacity is determined by the maximum value of the sum of pumped storage and battery energy storage compensation power.
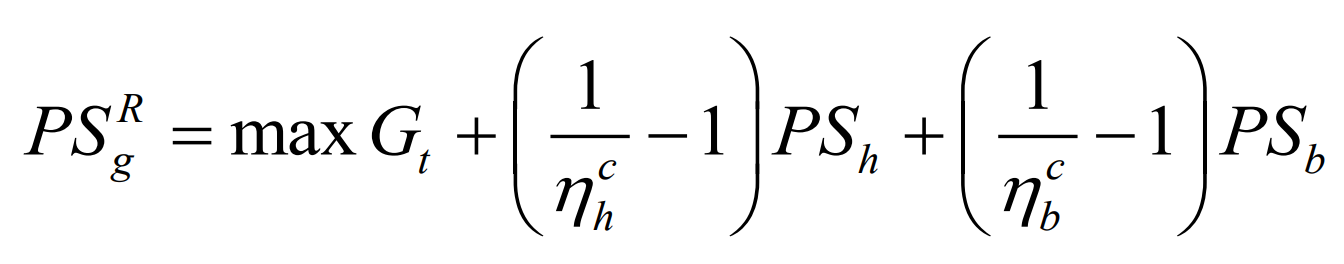
To ensure margin, the reserve can also be calculated based on the rated power of the energy storage, expressed as:
3.4 Linear programming form for capacity matching
Transform the capacity optimization problem into a linear programming solution.
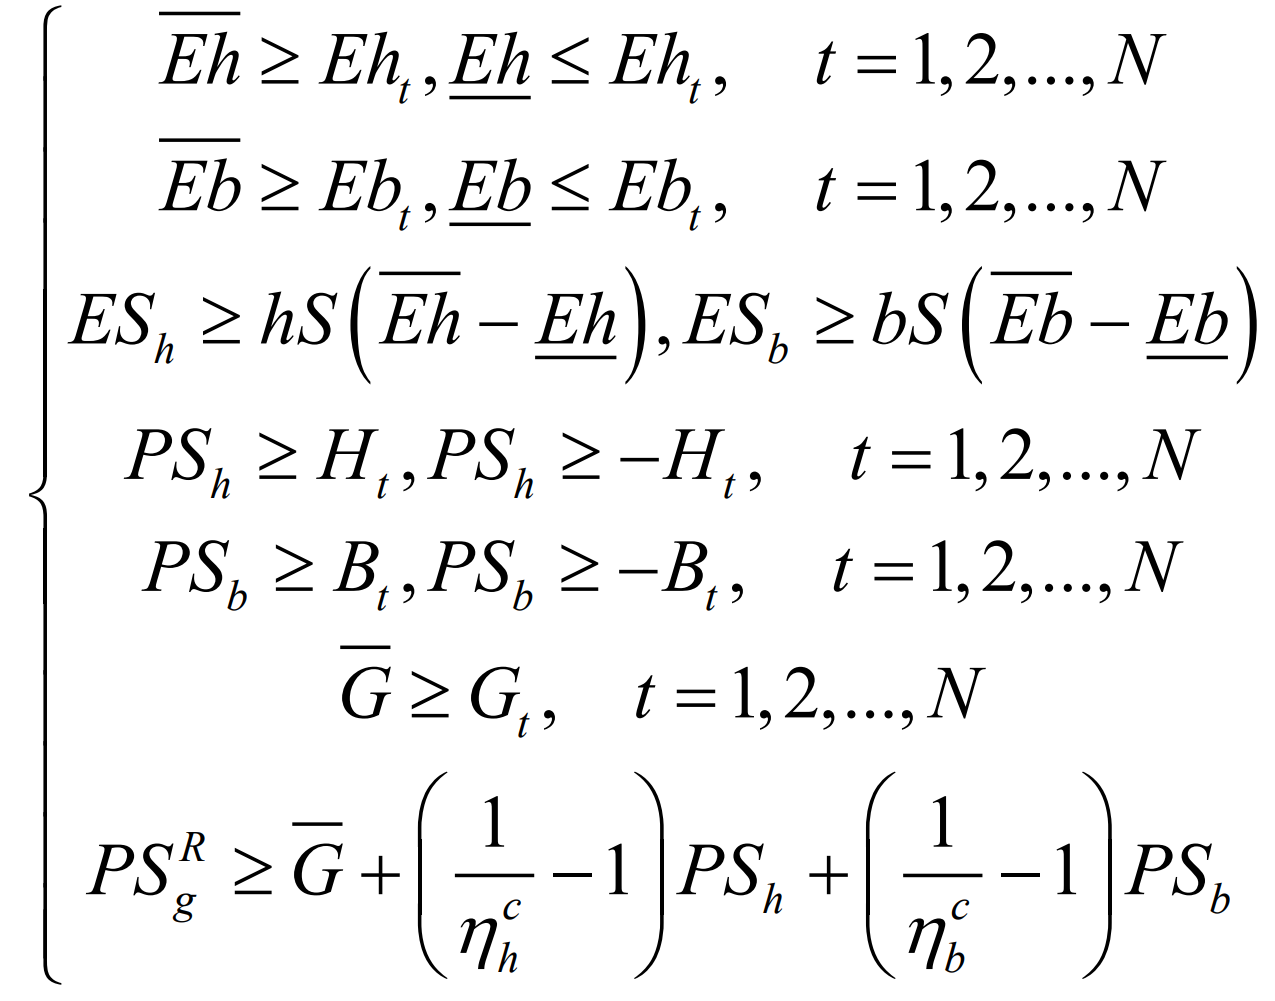
After sorting, the objective function is transformed into a linear function with continuous independent variables and constraints of linear equations and inequalities. The capacity matching problem is transformed into the following linear programming form:
At present, there are complete mathematical solving tools for linear programming, which have high solving efficiency. At the same time, the model setting of linear programming overcomes the non convexity of the “cut-off frequency method” calculation model, and the optimization evaluation results have theoretical guarantee.
In addition, the matching results of the model proposed in this article depend on the annual spectrum of the net load. After spectral clustering, frequency components of similar types are aggregated. Although there is uncertainty in the output of new energy at a certain time or period, overall throughout the year, the output spectrum distribution after clustering is relatively stable, that is, there will not be significant changes in the energy in the response frequency band. Therefore, the capacity optimization matching results provided by the proposed method have better stability.
4.Example analysis
4.1 Example Overview
This article refers to the relevant data of a regional power grid for example analysis. Based on the annual output characteristics of new energy, first plan the reserve of thermal power installed capacity, pumped storage capacity, and battery storage capacity for that year; And several possible access scenarios for renewable energy in the coming years were constructed, and corresponding thermal hybrid energy storage matching schemes were provided to verify the effectiveness of the methods described in this article.
The main parameters of the regional power grid are as follows: the annual load power fluctuation range of 8760 hours is 94.22GW to 138.5GW; The total installed capacity of thermal power is 166.56GW, and the hourly climbing capacity of the unit is about 40% of the maximum capacity of the unit; The new energy output of the regional power grid is mainly provided by wind power and photovoltaic power. The total planned installed capacity of new energy is about 358.7GW, and the installed capacity ratio of wind and solar power is about 2:1.
The spectrum splitting optimization model proposed in this article is a convex optimization problem with continuous variables, which is solved by calling the GUROBI solver on the MATLAB platform.
4.2 Example 1: Matching of Fire Storage Capacity in Regional Power Grid
4.2.1 Capacity matching based on spectral distribution coefficients
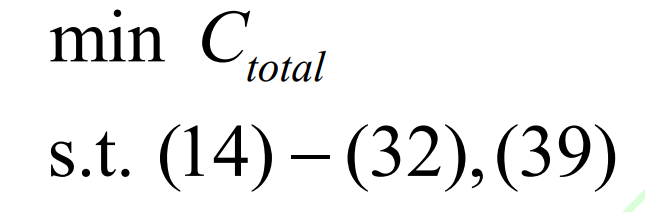
Firstly, based on the actual data of the regional power grid and the output characteristics of new energy, a possible scenario for matching the thermal storage capacity is constructed. The main parameters of the system are set as follows: the overall maximum hourly climbing capacity of the thermal power unit is 40% of the total capacity; In order to reduce carbon emissions, a portion of thermal power units are set to be decommissioned, with a basic output limit of 100GW; Considering the combination of units, the lower limit of thermal power output can be considered as a small positive number; Periodic charging and discharging efficiency of pumped storage and battery storage η H and η Take 75% and 90% respectively for b; Take 1 and 0.1 for SoChmax and SoChmin, and 0.9 and 0.2 for SoCbmax and SoCbmin; Annual interest rate γ Take 5%; λ Take 280 yuan/MWh for g; The economic indicators of energy storage are shown in Table A2 of Appendix A; New energy utilization rate α Set to 95%, the proportion of new energy output to load power β Set to 50%. In the solution of the example, the acquisition of net load, spectral decomposition, and clustering refer to Section 1; In terms of spectrum allocation, in the constraint conditions of spectrum distribution coefficient, set a frequency with a pumped storage allocation period greater than 12 hours and a frequency with a battery storage allocation period less than 24 hours; Thermal power units can participate in the regulation of DC components and all periodic components within the allowable range of climbing speed; The frequency between the period of 24 hours and 12 hours can be shared by multiple types of energy storage. Solve the model to obtain the spectral distribution coefficient. Based on conjugate symmetry, only the first Nc/2=27 components need to be analyzed. The calculation results are shown in Figure 5:
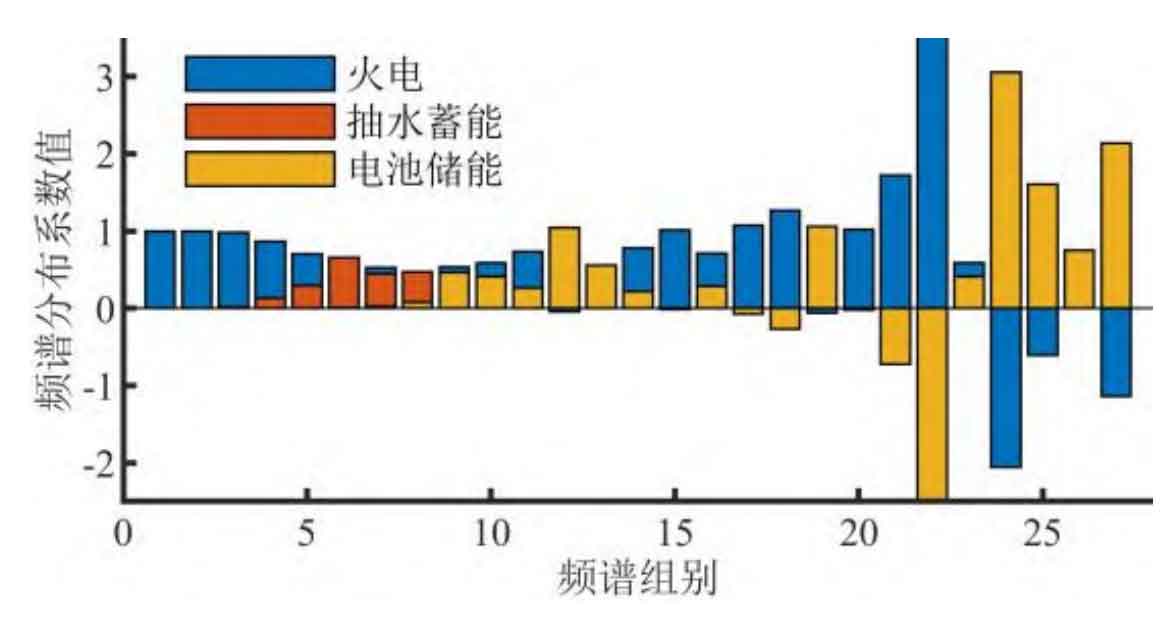
From the calculation results, it can be seen that thermal power units are the main bearers of full spectrum power. Pumped storage energy shares some of the cycle frequency components (group 4) to 12 hours (group 8), while battery energy storage shares some of the high-frequency components with a cycle of less than or equal to 12 hours. The sub spectra corresponding to thermal power and energy storage can be obtained through spectral distribution coefficients, and then the annual time-domain power curve can be obtained through IDFT, as shown in Figure 6:
In the calculation of the annual time-domain power curve, the basic output capacity of the thermal power unit is 100GW, the compensation power capacity is 3.62GW, and the total installed reserve is 103.62GW; The maximum climbing speed required for the power curve allocated by thermal power units reaches 40%, and the regulating capacity is fully utilized; The rated power PSh and PSb of pumped storage and battery storage are 22.98GW and 3.70GW, respectively, and the rated capacity ESh and ESb are 324.97GWh and 10.14GWh, respectively.
4.2.2 Comparison between Spectral Distribution Coefficient Method and Cutoff Frequency Method
Compare the spectral distribution coefficient method proposed in this article with the cut-off frequency method. According to the spectral clustering corresponding situation in Appendix Table A1, the thermal power unit is set to bear low-frequency components with a cycle of one week or more (1-3 groups), the battery bears high-frequency components with a cycle of less than 8 hours (11-27 groups), and the remaining components are borne by pumped storage energy. At this point, the two “cut-off frequencies” in the system are frequencies with a period of “one week” and a period of “8 hours”. Equivalently speaking, the spectral distribution coefficients of thermal power and energy storage are all 0 or 1, as shown in Figure 6. Obtain the respective spectra based on the spectral distribution coefficients, and the time-domain curves obtained through inverse transformation are shown in Figure 7:
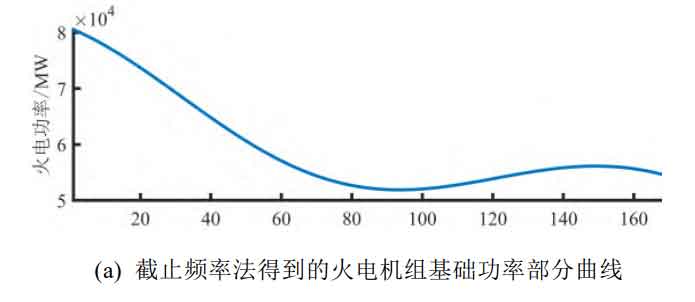
The basic output capacity of the thermal power unit calculated by the “cut-off frequency method” is 100GW, the compensation power capacity is 11.98GW, and the total installed reserve is 111.98GW; The maximum required ramp rate for the power curve allocated by thermal power units is only 6.2%; The rated power PSh and PSb of pumped storage and battery storage are 73.95GW and 18.49GW, respectively, and the rated capacity ESh and ESb are 1350.20GWh and 44.32GWh, respectively.
From the data, it can be intuitively seen that whether it is pumped storage or battery energy storage, its rated capacity and rated power are far greater than the spectral distribution coefficient method. From Figure 7, it can also be intuitively seen that the power curve of thermal power units fluctuates smoothly. Due to the absence of high-frequency components, the regulating capacity of thermal power units is far from fully utilized, resulting in a huge capacity burden on the energy storage system.
4.2.3 Impact of cut-off frequency method on breakpoint position
This article further adjusts the position of frequency breakpoints and compares the calculation results of the “cut-off frequency method”. Firstly, adjust the “breakpoint” between the thermal power unit and pumped storage: take the frequency with a cycle of “one week” as the benchmark, take the cutoff frequency as 0.2, 0.4, 0.6, 0.8, and 1.2 times the frequency, and maintain another “breakpoint” position consistent with 4.2.2. The calculation results are shown in Table 1:
| Segmentation point frequency ratio | 0.2 | 0.4 | 0.6 | 0.8 | 1.2 |
| PSh/GW | 74.73 | 75.89 | 73.47 | 73.35 | / |
| ESh/GWh | 4142.92 | 2868.61 | 2225.84 | 2225.84 | / |
| PSb/GW | 18.49 | 18.49 | 18.49 | 18.49 | / |
| ESb/GWh | 44.32 | 44.32 | 44.32 | 44.32 | / |
| PSRg/GW | 112.10 | 112.01 | 111.91 | 111.89 | / |
From Table 1, it can be seen that as the cutoff frequency increases, the frequency range undertaken by thermal power expands, and the rated capacity and power of pumped storage rapidly decrease. When the cutoff frequency increases to 1.2 times the reference frequency, the optimization problem has no solution. This is because the amplitude of the low-frequency sinusoidal component is large, and without the cancellation of high-frequency components with opposite phases, it is easy to exceed the regulating capacity of thermal power units. This is also one of the drawbacks of the cut-off frequency method compared to the spectrum distribution coefficient method proposed in this article.
| Location of waypoint group | 10 | 11 | 12 | 13 | 14 |
| PSh/GW | 73.95 | 73.95 | 73.01 | 71.98 | 71.32 |
| ESh/GWh | 1350.20 | 1350.20 | 1358.11 | 1360.25 | 1362.67 |
| PSb/GW | 18.49 | 18.49 | 13.51 | 12.76 | 10.15 |
| ESb/GWh | 44.32 | 44.32 | 29.47 | 27.00 | 19.42 |
| PSRg/GW | 111.98 | 111.98 | 111.58 | 111.39 | 111.15 |
Next, fix the “breakpoint” between the thermal power unit and pumped storage as the above reference frequency, adjust the “breakpoint” position between pumped storage and battery storage, and adjust them to the high-frequency boundaries of frequency groups 10 to 14 in Appendix Table A2. The calculation results are shown in Table 2. It can be seen that due to the small amplitude of the high-frequency component, the change in the position of the breakpoint has little impact on the calculation results.
4.3 Example 2: Fire storage matching under different new energy access scales
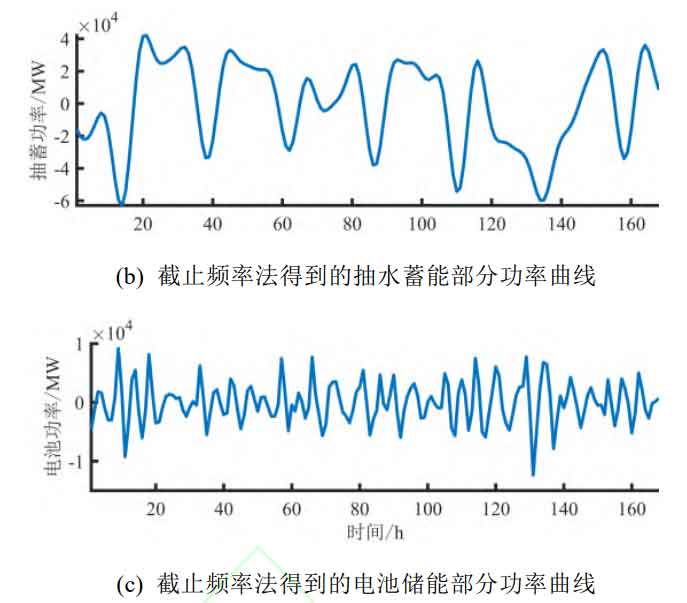
On the basis of Example 1, this article further explores the impact of new energy access scale on the capacity matching of thermal power multi type energy storage systems. The fixed wind to solar ratio is 2:1, and the total amount of new energy access in Example 1, 358.7GW, is used as the base value to adjust the proportion of new energy access relative to the base value ω, The relevant matching results are shown in Figure 7:
As shown in Figure 8 (a), the relative proportion of the total amount retained by the thermal motor assembly machine in new energy integration ω = At 1.05, it remained at a certain level, but a “mutation point” appeared when the scale of new energy access further increased, approximately linearly decreasing. The sharp decrease in thermal power capacity has a direct impact on the trend of energy storage capacity changes, as reflected in Figure 8 (b): the minimum values of the rated capacity ESh and rated power PSh of pumped storage energy are respectively generated by ω 1=0.95 and ω 2=1.05; In terms of access ratio ω < ω When 1=1.05, the change is relatively gentle, while when ω > ω At 1 hour, ESh and PSh rapidly increased. Similarly, the rated capacity ESb and rated power PSb of battery energy storage are both in the connection ratio ω A minimum point appears when 2=1.05; ω < ω At 2 o’clock, the reduction rate of ESb and PSb is relatively slow, ω > ω At 2 o’clock, the increase rate of ESb and PSb is relatively rapid.
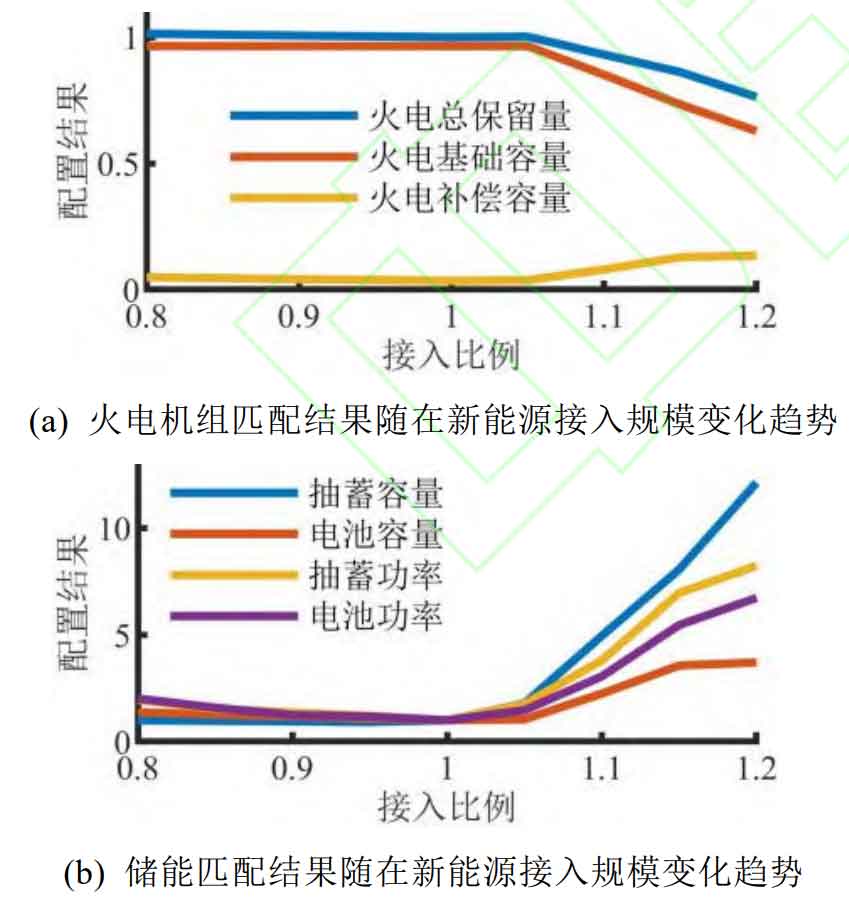
The “sudden change point” of the reserve capacity and energy storage system capacity of the thermal electric motor assembly machine can be explained by the heat map of the absolute values of the spectral distribution coefficients of thermal power units, pumped storage, and battery energy storage, as shown in Figure 9:
As shown in Figure 9 (a), with the relative proportion of new energy access ω As the number of thermal power units increases, the proportion of spectrum sharing in the medium and high frequency parts rapidly decreases, ω= At 1.2 hours, thermal power can only bear components with cycles greater than a month and very few high-frequency components with cycles less than 4 hours. This is because the proportion of new energy access is too large, causing a significant negative shift in the net load curve. Due to the fact that the output of thermal power units cannot be negative, the corresponding spectrum distribution coefficient can only continuously decrease.
The continuous reduction of the frequency component that thermal power units can bear directly leads to an increase in the required capacity for energy storage. As shown in Figure 9 (b), when ω When changing from 0.8 to 1.2, the frequency lower limit of pumped storage energy sharing gradually extends from weekly to monthly, and the absolute value of the distribution coefficient continues to increase. As shown in Figure 9 (c), the spectral distribution coefficient of battery energy storage is ω= At 0.8, it is concentrated on typical periodic components such as 8h, 6h, 4.8h, and 4h; When ω= At 1.05, the distribution coefficient is generally small, corresponding to the minimum points of ESh and PSh; When ω= At 1.2, the spectral distribution coefficient is relatively continuous, covering 12h to 4.8h and 3.4h to 2h, with almost all amplitudes being 1. The trend of matching changes in the capacity of thermal power and energy storage obtained from Figure 9 is completely consistent with the results in Figure 8, and it can be concluded that in the scenario, the relatively appropriate proportion of new energy access is relatively suitable ω At around 1.05, corresponding to the “mutation point” of the reserved thermal power installed capacity.
4.4 Example 3: Fire Storage Matching under Different Scenery to Scenery Ratios
Based on Example 1, this article continues to explore the impact of wind and solar access ratio on capacity matching. In order to reduce the impact of regional differences in wind and solar capacity factors on the results, this article fixed the total wind and solar power consumption to a certain level, and kept it consistent with Example 1, which is the total wind and solar power consumption when the total installed capacity is 358.7GW and the ratio of wind and solar installed capacity is 2:1. In the regional power grid, the capacity factor of wind power is 0.2447, and the capacity factor of photovoltaic power is 0.1711, corresponding to a fixed value of 78.256GWh of total electricity. The example comprehensively considers the construction costs of wind turbines and photovoltaic cells, and evaluates the initial total investment CESini of the energy storage system and the initial total investment RCRini of the new energy system. The investment prices for the unit capacity of wind and solar power units are 5500 kW yuan and 3800 kW yuan, respectively. Adjust the proportion of wind and solar power integration, and the calculation results of each indicator are shown in Table 3:
| Match | 1:3 | 1:2 | 1:1 | 2:1 | 3:1 |
| PSh/GW | 104.15 | 83.59 | 53.52 | 26.97 | 23.64 |
| ESh/GWh | 771.84 | 636.24 | 499.37 | 460.96 | 297.04 |
| PSb/GW | 36.51 | 32.46 | 28.40 | 6.73 | 3.61 |
| ESb/GWh | 80.13 | 78.29 | 69.00 | 20.56 | 10.50 |
| PSRg/GW | 117.42 | 114.14 | 109.45 | 104.37 | 103.71 |
| CESini/10 billion yuan | 81.7 | 68.4 | 50.1 | 28.1 | 20.2 |
| CRini/10 billion yuan | 174.3 | 174.5 | 174.8 | 175.2 | 175.3 |
From Table 3, it can be seen that as the wind to solar ratio increases, the rated capacity ESh and rated power PSh of pumped storage energy, as well as the rated capacity ESb and rated power PSb of battery energy storage, gradually decrease. The decreasing trend is particularly evident during the process of increasing the wind to solar ratio from 1:3 to 2:1. This is because the diurnal difference in wind power output is much smaller than that of photovoltaic power. As the proportion of wind power in new energy increases, the peak valley difference of the net load curve relatively decreases, reducing the capacity burden of energy storage. As the proportion of scenery continues to increase, the decrease in CESini is relatively limited. From an economic perspective, the unit capacity investment of wind turbines is relatively high, but due to the high unit capacity investment cost of wind power, the change in CRini is not significant. In contrast, the total investment of the energy storage new energy system has good economic efficiency when the wind to solar ratio is 2:1, and it relatively comprehensively and evenly utilizes multiple new energy sources. It can be considered an ideal wind to solar integration ratio in this scenario.
5. Conclusion
This article focuses on a new type of power grid with an increase in the proportion of wind and solar renewable energy integration and a decrease in the retention of thermal power installed capacity under the background of “dual carbon”. Based on DFT and continuous spectrum distribution coefficient, a capacity optimization matching model for thermal power and multi type energy storage is constructed. The main conclusions are as follows:
(1) The spectral distribution coefficient proposed in this article is a continuous variable, which enables a single frequency component to be simultaneously allocated to thermal power and multiple types of energy storage. Therefore, the model can be transformed into linear programming.
(2) Examples of wind and solar power integration at different scales indicate that a larger scale of new energy integration will make it difficult for thermal power units to participate in the regulation of medium and high frequency components, resulting in a greater burden on energy storage capacity; The optimal access scale of new energy appears at the sudden change point of thermal power installed capacity retention.
(3) In the calculation results of the regional power grid, thermal power units can participate in the distribution of all cycle components, and the regulating potential is fully utilized. Examples of wind and solar power integration with different ratios show that an increase in wind power integration ratio helps to reduce the matching capacity of energy storage systems; And when the wind to solar ratio is 2:1, it has good initial investment economy and can relatively comprehensively and evenly utilize multiple new energy sources.