
1.Temperature changes in concrete energy storage systems
The three-dimensional numerical simulation results of the thermal storage process of the concrete sensible heat energy storage system and the temperature distribution at different cross-sections are shown in Figure 1. The simulation conditions in the figure are: there are 22 heat transfer pipelines, the initial temperature of the energy storage system is 473K, the fluid velocity in the main pipeline is fixed at 3.5m/s (equivalent to 12.9m/s in the heat transfer channel), and the fluid inlet temperature is 653K.
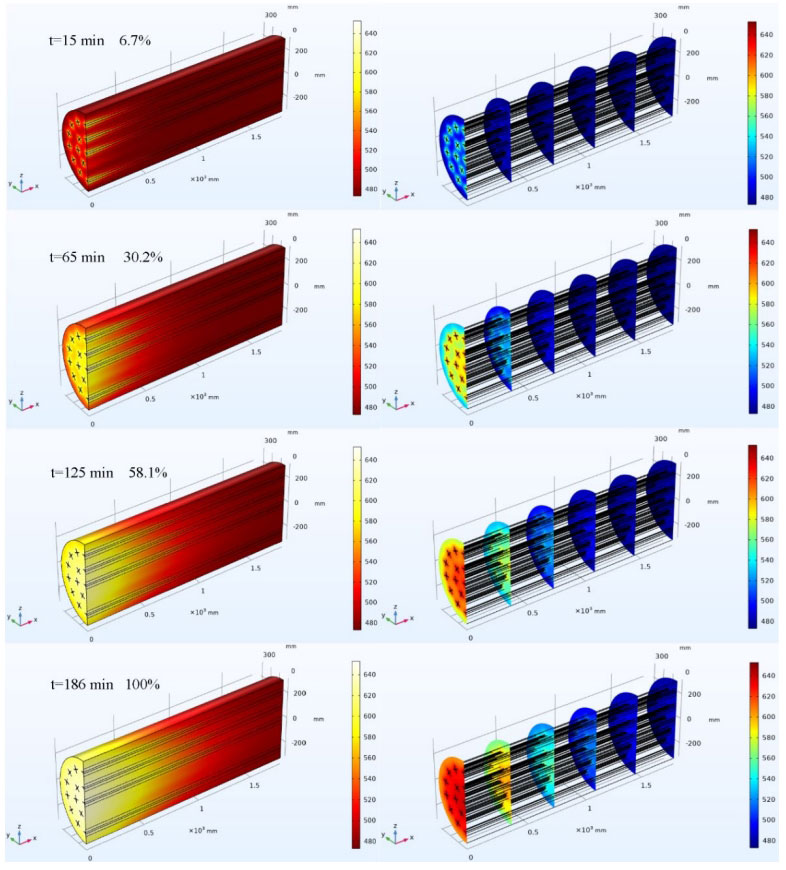
During the heat storage process, the heat of the fluid is transferred to the concrete. The temperature difference between the fluid and the concrete at the inlet is the greatest, and the heat transfer is also the fastest. The temperature of the concrete rises the fastest. As the fluid flows and exchanges heat, the temperature difference between the fluid and the concrete decreases, resulting in a decrease in heat transfer efficiency. The system completed the heat storage process after 186 minutes.
From the temperature distribution of different cross-sections in Figure 1, it can be seen that the temperature of concrete decreases sequentially with the direction of fluid flow. At the x=0mm cross-section, the fluid temperature is highest, the heat transfer efficiency with concrete is highest, and the concrete heats up quickly. As the fluid flows and exchanges heat, the temperature decreases and reaches its minimum at x=1800mm, resulting in the least amount of heat transferred to the concrete and the slowest temperature rise. The main heat transfer method in the radial direction is heat conduction. From the radial temperature distribution, it can be seen that the temperature is highest at the center position, and the lower the temperature along the radius direction, the closer it is to the outer edge. This is because there are relatively fewer heat transfer pipes at the outer edge, and the heat transferred from the fluid to the concrete is also less, resulting in a slower temperature rise. However, the radial temperature difference is significantly smaller than the axial temperature difference, because the heat transfer distance in the radial direction is relatively short, and different parts will only have temperature differences due to the density of the pipeline. During the flow process, the fluid in the axial direction exchanges heat, and there is a significant temperature difference between the fluid at different positions, resulting in a larger temperature difference with the concrete. This leads to uneven heat transfer before and after, resulting in a relatively large temperature difference in the concrete along the axial position.
The heat release process of the concrete energy storage system is shown in Figure 2. During the heat release process, the initial temperature of the concrete energy storage system is 533K, the velocity of the air fluid in the main pipeline is 3.5m/s, and the air inlet temperature is 373K. As shown in the figure, the system completes the heat release process at t=216min.
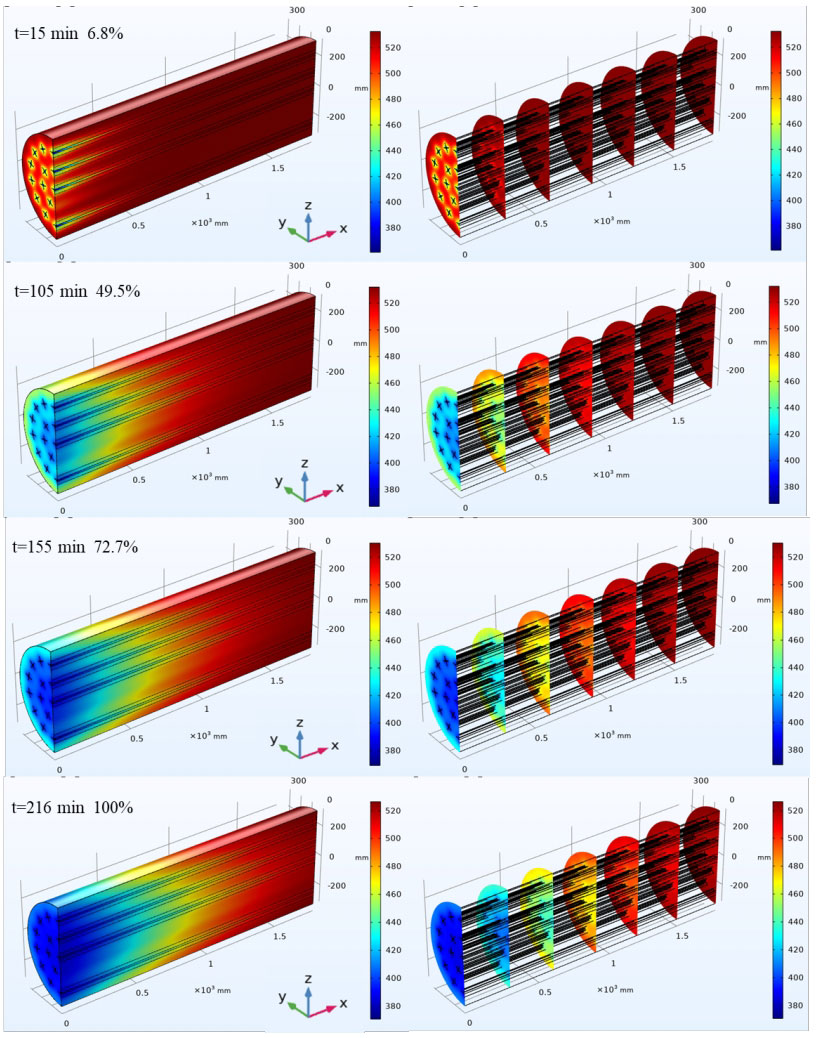
During the heat release process, concrete transfers heat to the air fluid, heating the air. At x=0 mm, the fluid temperature is the lowest, at which point the temperature difference between the fluid and the concrete is the highest, and the heat transfer between the two is also the fastest. Therefore, the temperature of the concrete at this location also decreases the fastest, resulting in the lowest temperature. Along the direction of air flow, the temperature difference between the fluid and concrete decreases, and the heat transfer rate between the two also decreases. The fluid is continuously heated by high-temperature concrete along the flow direction, and high-temperature gas flows out of the energy storage system unit. Therefore, based on the above heat transfer process, during the heat release process, the temperature of the concrete unit increases along the direction of fluid flow. Similar to the heat storage process, the temperature difference between concrete at different positions along the axial direction is relatively large. However, for the radial direction, the farther away from the center point, the higher the temperature. This is because the heat exchange tubes at the center point are dense, and the concrete transfers more heat to the fluid, resulting in a greater decrease in temperature. The radial temperature difference is much smaller than the axial temperature difference, which is similar to the reason for the heat storage process above.
2. Analysis of variance and model diagnosis
As shown in the formula, the least squares method is used to estimate model parameters. Due to the ability to eliminate the increase in model R2 caused by adding unnecessary variables, the adjusted R2 (𝑅^ 2 𝑎 dj) is used to evaluate the fitting effect of the model. Predicting R2 can be used to evaluate the predictive ability of a model, calculated through a formula.
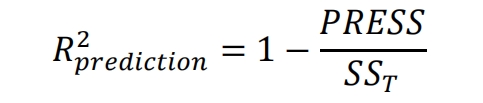
Among them, 𝑃 RES is the sum of squared error predictions. Subtract the predicted values calculated using the model from the simulated results to form a series of prediction error values, and the sum of squares of these error values is the result of the sum of squares of the error prediction. The F-test is used to verify the accuracy of the model. If the value of Prob>F is less than 0.05, it indicates that the model is effective and can also obtain design variables that have a significant impact on the response value. From the perspective of model fitting effect, for the response variables of heat storage time 𝑡𝑐ℎ𝑎, energy storage Q and energy storage efficiency 𝜂, the values of model 𝑅^ 2 𝑎 dj are 99.27%, 99.81%, and 99.52%, respectively. These statistical results indicate that each model can effectively describe the simulated response.
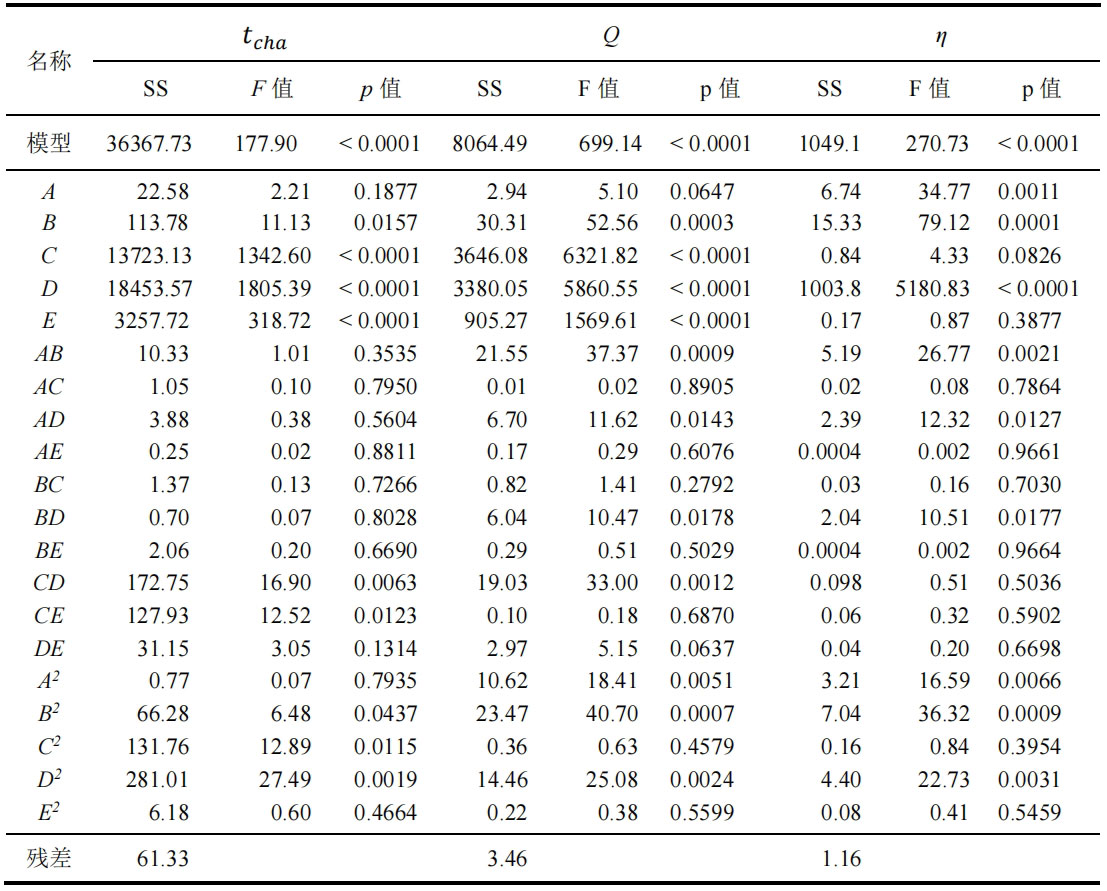
The analysis of variance results of the response surface model are shown in Table 3-2. From the F and P values of the model, it can be concluded that all three models are valid. For each influencing factor, when the P-value is less than 0.05, it indicates that the variable parameters in the model have a significant impact on the response indicators. Specifically, parameters B, C, D, E, CD, CE, B2, C2, and D2 have a significant impact on heat storage time. The parameters B, C, D, E, AB, AD, BD, CD, A2, B2, and D2 have a significant impact on energy storage. The parameters A, B, D, AB, AD, BD, A2, B2, and D2 have a significant impact on the thermal storage efficiency. From the above results, it can be seen that not only individual variables, but also the interaction of some variables can have a significant impact on the response value. There are differences in the influencing factors for different response indicators. Therefore, it is necessary to conduct in-depth analysis of the impact of different factor interactions on response variables.
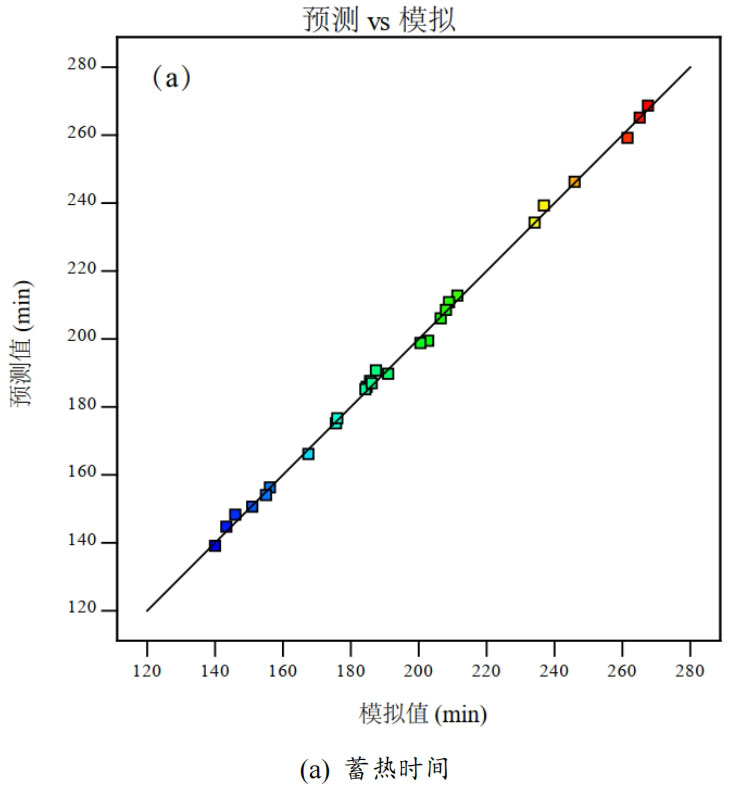
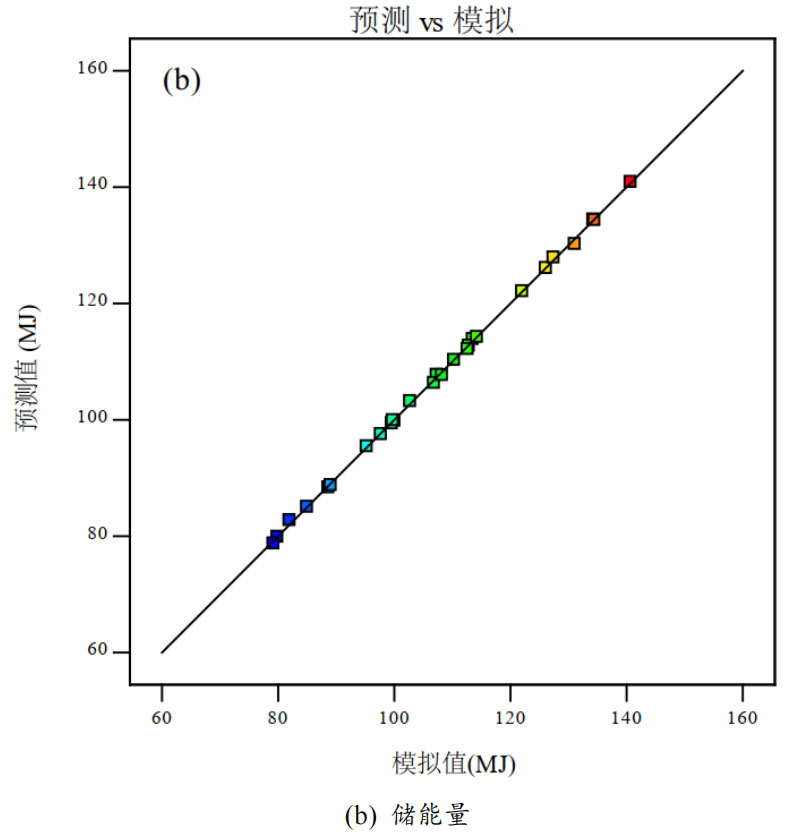
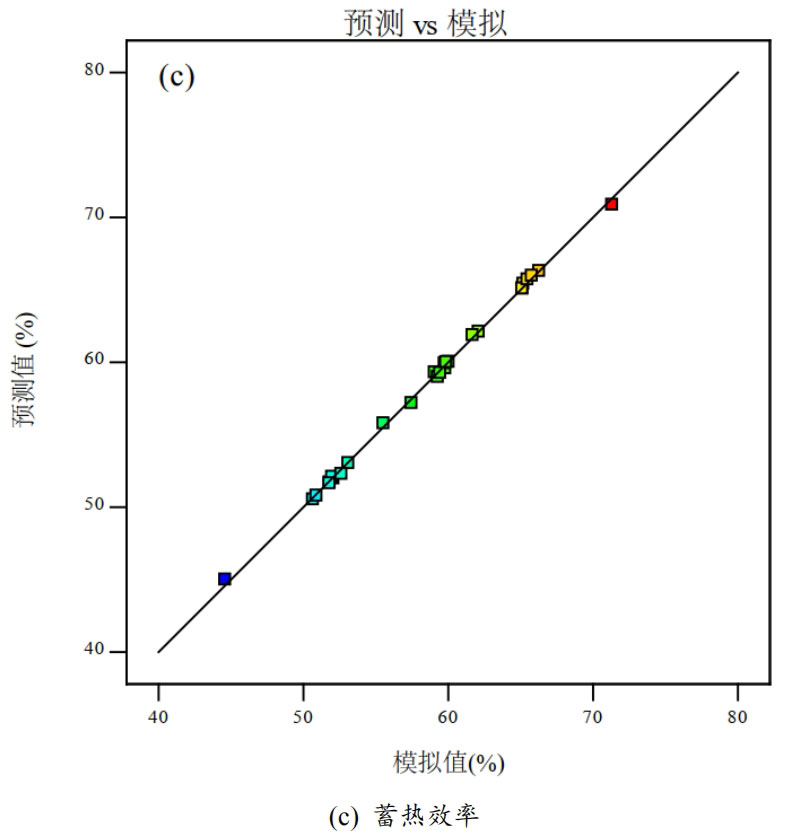
The reduction values of these three models are 95.25%, 98.79%, and 96.87%, respectively, indicating reliable predictive performance. Based on the predicted values of the model and the calculated values from the simulation results, we use the diagonal function y=x to analyze the relationship between the two. From Figure 3, it can be seen that for the three thermal performance indicators of thermal storage time, energy storage, and thermal storage efficiency, the predicted values of thermal performance indicators at each design point were obtained using the above regression model, and then compared with the calculated values from simulation results. It can be seen that most of the design points are distributed near the diagonal, indicating that the predicted values obtained using the response surface model are very close to the calculated values from the simulation results, and the model has good predictive performance.
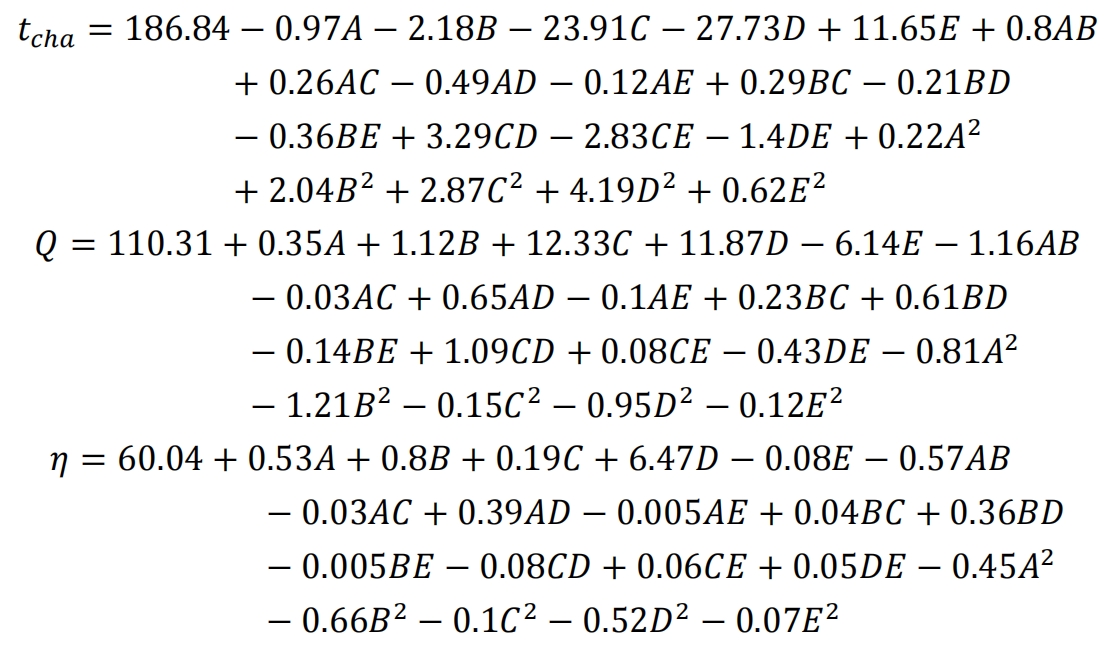
According to the response surface model, the equation form fitted with encoding factors is as follows:
3. Analysis of the impact of factors on response indicators
(1) The factor effect of heat storage time
From the results of the analysis of variance, it can be seen that among single factors, fluid velocity D has the greatest impact on heat storage time. Among the two factor interactions, CD has the greatest impact on heat storage time. Analyze the specific effects of fluid inlet temperature and flow velocity on heat storage time using 3D surface and contour maps.
Except for the variables of fluid flow rate and inlet temperature, the center point values of other variables remain unchanged, and the response surface and contour map of the heat storage time with the change of fluid inlet temperature and flow rate settings are obtained, as shown in Figure 4. From Figure 4, it can be seen that the effect of CD interaction on heat storage time is significant. As the inlet temperature and flow rate of the fluid increase, the interaction of CD increases, and the heat storage time of the energy storage system decreases. Increasing the inlet temperature of the fluid can increase the temperature difference between the fluid and the concrete. The larger the temperature difference, the more heat the fluid transfers to the concrete per unit time, and the faster the temperature rise. The higher the fluid flow rate, the stronger the convective heat transfer ability between the fluid and the pipeline, and the faster the concrete heating rate. Therefore, the heat storage process of the energy storage system is completed in a short period of time.
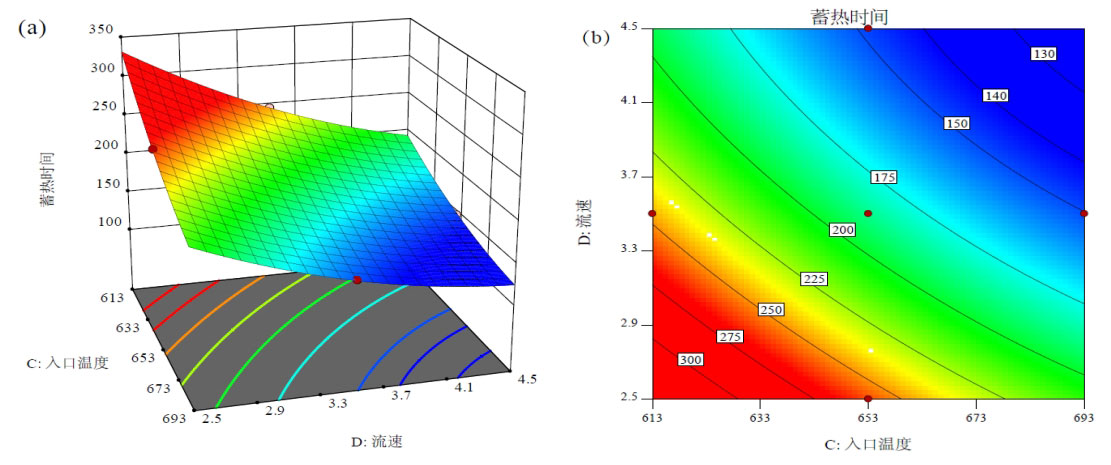
When the fluid flow rate is constant, the inlet temperature of the fluid is the main variable affecting the heat storage time. The inlet temperature of the fluid is sensitive to changes in fluid flow velocity during heat storage at low water levels. As the inlet temperature of the fluid increases, the sensitivity of heat storage time to changes in fluid flow velocity decreases. This is because when the inlet temperature of the fluid is low, the temperature difference between the fluid and the concrete is smaller, the heat conduction is slower, and the heat storage time is longer. Increasing the flow rate can improve heat transfer efficiency and reduce heat storage time. As the inlet temperature of the fluid increases, the temperature difference between air and concrete increases, and the heat conduction effect is obvious. The effect of improving heat transfer efficiency by increasing the flow rate is weakened. However, as the fluid temperature increases, the density of the air fluid decreases, the heat carried per unit volume of air decreases, and the heat transferred from the fluid to the concrete also decreases. But overall, the reduction in heat storage time caused by temperature difference is more significant.
(2) The factor effect of energy storage
From the analysis of variance results, it can be seen that single factors B, C, D, and E have a significant impact on energy storage. Among them, single factor C (inlet temperature) has the greatest impact. Among the four significant two factor interactions, the interaction of AB (number of fins and pipes) has the greatest impact on energy storage. Use surface and contour maps to analyze in detail the impact of AB term on energy storage.
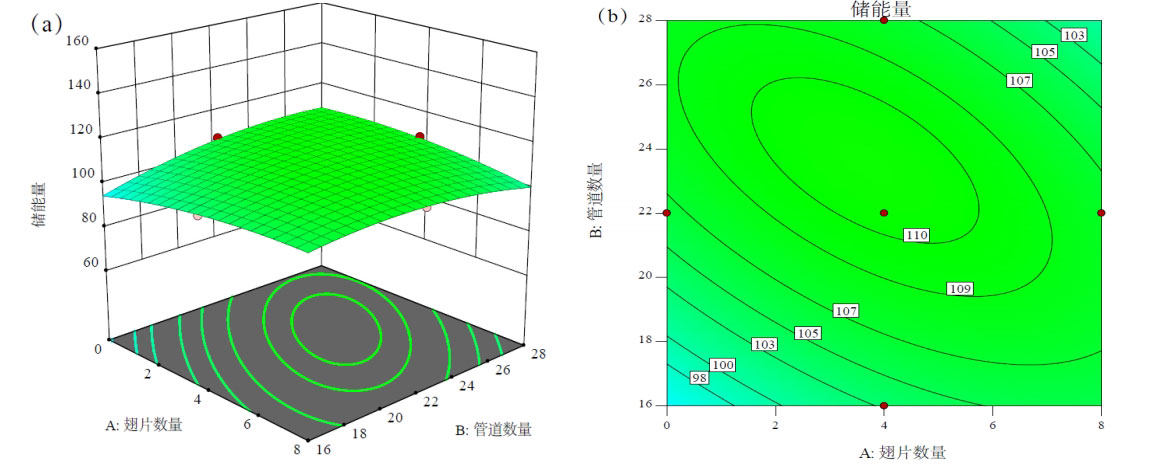
From Figure 5, it can be seen that there is a quadratic parabolic relationship between heat transfer capacity and heat storage capacity. As the number of pipes and fins increases, the heat transfer capacity of the system increases, but the energy storage capacity of the system also decreases. The increase in the number of pipelines increases the contact area between the fluid and concrete, and the addition of fins can improve thermal permeability, both of which can enhance the heat transfer rate of the system. Within a certain period of time, as the number of fins and pipes increases, the system heats up faster, and the temperature difference from the initial temperature also increases, resulting in more energy storage. However, as the number of fins and pipes increases, the amount of concrete decreases, and the capacity of the energy storage system decreases. Meanwhile, as the number of pipelines increases, the fluid velocity in the pipeline decreases, leading to a decrease in heat transfer efficiency between the fluid and concrete. From the formula, it can be seen that energy storage is related to the capacity of the energy storage system (𝜌𝑠𝐶𝑝, 𝑠) and the temperature difference (∆𝑇). So, when the number of fins and pipes exceeds a certain amount, although the heat transfer efficiency of the system increases, the capacity of the energy storage system decreases, leading to a decrease in the system’s energy storage. When the number of pipes exceeds 22, the heat transfer enhancement effect caused by the increase in the number of pipes is less than the decrease in heat transfer efficiency caused by the decrease in flow rate. Therefore, the situation where the maximum energy storage is shown in Figure 5 is not when the number of pipes and fins is the highest. From Figure 5, it can be seen that the number of fins is 4, the number of pipes is 22, and the energy storage capacity of the system for 360 minutes is approximately 110MJ.
(3) The Factor Effect of Energy Storage System Efficiency
From the results of analysis of variance, it can be seen that single factors A, B, and D have a significant impact on the efficiency of energy storage systems. Among them, D (fluid velocity) has the greatest impact on the efficiency of energy storage systems. AB has the greatest impact on the efficiency of energy storage systems among the two factor interactions.
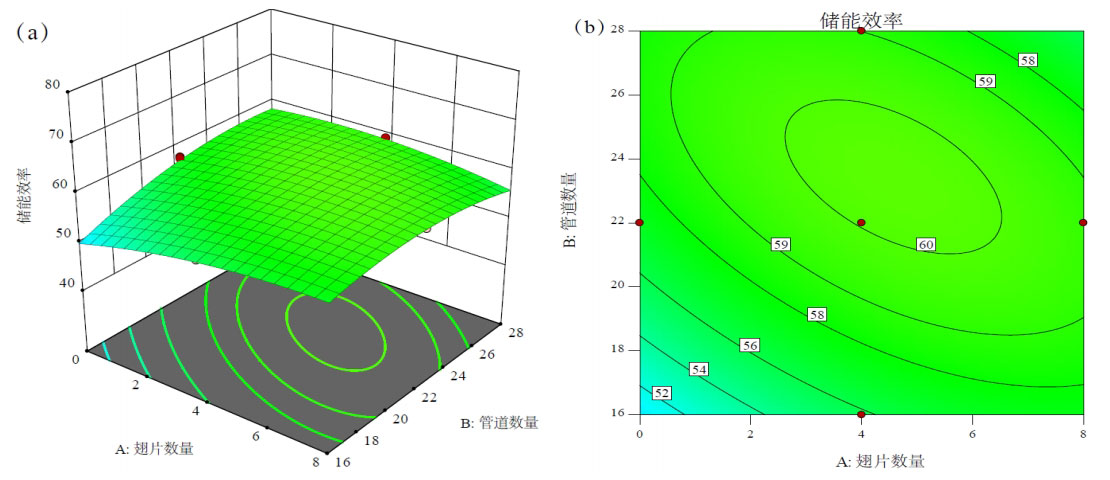
Figure 6 shows the surface and contour maps of the interaction between the number of fins and the number of pipes. When the number of fins and pipes is at a low level, as the number of fins and pipes increases, the heat transfer capacity of the system is enhanced, and the efficiency of the energy storage system is improved. However, when the number of system pipelines exceeds 22, increasing the number of fins cannot effectively improve the efficiency of the energy storage system. This is because flow rate is also an important factor affecting the efficiency of the energy storage system. According to the equivalent flow rate, as the number of pipelines increases, the flow velocity of the fluid in the pipeline decreases. The decrease in flow rate leads to a decrease in heat transfer efficiency between the fluid and the pipeline, resulting in a longer time required for the system to reach a certain temperature. The above phenomenon indicates that the direct effect of increasing the number of pipelines is enhanced heat transfer, but at the same time, it can also cause a decrease in fluid flow velocity inside the pipeline, leading to a decrease in heat transfer. The results of these two actions determine the efficiency of the energy storage system. From Figure 6, it can be seen that the number of pipes and fins in the system is set to 22 and 4, respectively, indicating the optimal efficiency of the energy storage system.
4. Multi objective optimization analysis
From the above analysis, it can be concluded that there are various factors that affect the energy storage efficiency of energy storage systems, and there are differences in the influencing factors of different thermal performance indicators. In multi-objective optimization, the objectives compete with each other, so only when at least one objective weakens can another objective be improved. In order to optimize the overall situation of the system, it is necessary to consider multiple indicators simultaneously and find the parameter combination that satisfies the optimal situation.
Use the expected function to obtain the optimal situation of the system. The expected value range of the expected function is from 0 to 1, and the closer the expected value is to 1, the closer the predicted response value is to the optimal under these parameter combinations. According to the response characteristics, there are three forms of expected functions, which are expected large features, expected small features, and target values. Based on the thermal performance indicators of concrete energy storage systems, the expected value of heat storage time is determined using the expected small characteristic, and the expected value of energy storage and energy storage system efficiency is determined using the expected large characteristic. Calculate the joint objective function 𝐷 for three response indicators, the value of 𝐷 is calculated by combining the expected values of the three response indicators, which is the geometric mean of the expected values of the three response indicators. When calculating 𝐷, it is necessary to assign weights to the three response indicators, because in the thermal performance evaluation of concrete energy storage systems, the three indicators are equally important. Therefore, equal weights are given to the minimum heat storage time, maximum energy storage, and energy storage system efficiency. The value of the joint objective function 𝐷 depends on different combinations of parameter values.
Based on the above parameter constraints and target settings, the optimal parameter selection for the thermal performance of the energy storage system is: 4 fins, 22 pipelines, 672.8K fluid inlet temperature, 4m/s fluid flow rate in the main pipeline, and 463K initial temperature. The optimal heat storage time obtained is 138.9 minutes. At 360 minutes, the energy storage and energy storage system efficiency of the system are 140.7 MJ and 65.9%, respectively. The expected value of the expected function is 0.956. In the optimized parameter combination, the maximum fluid velocity in the main pipeline is taken, and the minimum initial temperature of the system is taken.
In order to optimize the overall performance of the system, it is also necessary to consider optimizing the heat release process. During the heat release process, the initial temperature of the concrete energy storage system unit is the average temperature of the system at the end of heat storage, and the fluid inlet temperature is within the range of 353 K to 393 K. The parameter design adopts the same design method as the heat storage process, with the minimum heat release time as the optimization objective, to obtain the optimal parameter combination. The optimal parameters for the heat release process are as follows: HTF inlet temperature is 353K, fluid flow rate (in the main pipeline) is 4m/s, and the number of fins and tubes is 4 and 22, respectively. The optimal heat release time is 159.7 minutes, and the expected value of the expected function is 1.
During the heat storage process, the inlet temperature and velocity of the fluid should be increased as much as possible. The higher the inlet temperature and flow rate, the faster the heat exchange between the fluid and the pipe wall, and the shorter the heat storage time. Under high temperature conditions, the thermal properties of concrete are affected by temperature. As the temperature increases, the thermal conductivity of concrete decreases. Within a certain period of time, the lower the initial temperature, the faster the concrete temperature rises, and the higher the efficiency of the energy storage system. Therefore, it is necessary to choose a suitable working temperature range to maximize the thermal storage performance of the system.
5. Summary
A three-dimensional concrete energy storage system was numerically simulated to observe the internal temperature distribution during the heat storage and release process, and various thermal performance indicators were calculated. The impact and statistical significance of design factors on response indicators were analyzed based on the response surface model. In order to obtain the optimal design parameters of the system, joint optimization is used to process the minimum heat storage time, maximum energy storage, and maximum energy storage system efficiency indicators. Compared with previous research, the proposed method can provide reference for the optimization design of concrete sensible heat storage systems. The main conclusions are as follows:
(1) Observing the temperature distribution and completion status of the concrete sensible heat storage system during the heat storage and release process. Heat transfer is more uniform in the radial direction than in the axial direction. Along the direction of fluid flow, the fluid temperature decreases, and the heat transfer rate decreases with the decrease in temperature difference between air and concrete.
(2) A quadratic regression model was established using response surface methodology to investigate the relationship between influencing factors and heat storage time, energy storage, and heat storage efficiency. The rationality of the model was verified through variance analysis, and significant factors affecting various performance indicators were obtained. The model has good predictive ability.
(3) From the analysis of variance results, it can be seen that there are differences in the influencing factors of different response indicators. In addition to individual factors, the interaction between different factors can also have a significant impact on response indicators. Specifically, fluid velocity is the most important factor affecting heat storage time and energy storage system efficiency, and fluid inlet temperature is the most important factor affecting energy storage. In the interaction, the interaction between fluid velocity and inlet temperature has a significant impact on heat storage time, while the interaction between the number of pipes and fins has a significant impact on energy storage and the efficiency of energy storage systems.
(4) In the joint optimization based on heat storage process, considering the minimum heat storage time, maximum energy storage, and maximum heat storage efficiency, the optimal parameter combination for the system is: 4 fins, 22 pipes, fluid inlet temperature of 672.8K, fluid velocity of 4m/s, and initial system temperature of 463K.
(5) An increase in the number of pipes can increase heat conduction, but as the number of pipes increases, the fluid velocity in the channel decreases and the heat transfer rate decreases. So, the more pipes there are, the better. When the thermal performance of the heat storage and heat release processes is optimal, the number of pipes and fins selected in both processes is consistent, so that the overall performance of the system is optimal during the cycling process.