
The purpose of battery thermal management is to control the battery temperature within a certain range through reasonable design. Therefore, it is first necessary to understand the mechanism of battery heat generation and construct a battery thermal model. This chapter first elaborates on the structure, working principle, heat generation mechanism, and heat transfer characteristics of lithium-ion batteries, and then provides a detailed introduction to the thermal model. A CFD model for lithium-ion batteries was established, and the temperature distribution under different discharge rates was simulated and analyzed, and compared with experimental results for verification.
1. Structure and working principle of lithium-ion batteries
1.1 Lithium ion battery structure
Lithium ion batteries are mainly composed of positive electrode materials, negative electrode materials, separators, electrolytes, and shells. They can be divided into stacked and wound types according to different manufacturing processes. During the initial charging and discharging operations of the battery, there will be a reaction between the negative electrode and the electrolyte to form an SEI film, which can protect the battery.
Positive electrode materials are generally composed of transition metal oxides embedded with lithium, commonly including lithium iron phosphate, lithium manganese oxide, lithium cobalt oxide, and ternary materials. Currently, using long time lithium iron phosphate batteries, their advantages include long lifespan, ability to cycle more than 1000 times, good high-temperature performance, and fast charging and discharging. The negative electrode is generally made of carbon materials such as graphite, metal oxides, and carbon fibers, and its ability to embed and remove lithium ions determines the size of the battery capacity.
Electrolyte has high ionic conductivity and is an important component of batteries, located on both sides of the separator and responsible for transferring charges between positive and negative electrodes. The activity of different electrolytes varies significantly, affecting the operating temperature range, energy density, and service life of the battery.
The diaphragm is located between the positive and negative electrodes, and its main function is to prevent short circuits of electrons through the internal circuit, allowing lithium ions to pass through and ensure normal chemical reactions. The diaphragm itself is not conductive, which to some extent reduces the conductivity between the positive and negative electrodes. When the battery temperature is too high, it can automatically disconnect the positive and negative poles, providing protection.
1.2 Working principle of lithium-ion batteries
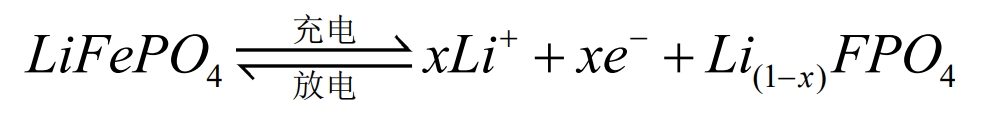
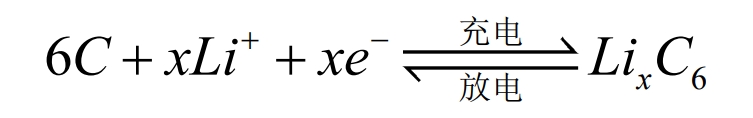
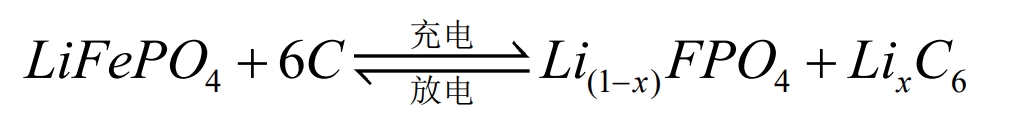
The operation of lithium-ion batteries relies on the movement of lithium ions between the positive and negative electrodes. During the charging and discharging process, Li+is intercalated and de intercalated back and forth between the two electrodes. Taking lithium iron phosphate (LiFePO4) battery as an example, the positive and negative electrode electrochemical reactions and the total reaction equation during the charging and discharging process are as follows:
Positive pole:
Negative electrode:
Total battery reaction:
During battery charging, Li+is removed from the positive electrode and embedded into the negative electrode through the electrolyte. The negative electrode is in a lithium rich state, and the more lithium ions are embedded in the negative electrode, the greater the charging capacity. When the battery is discharged, the opposite is true. Li+detaches from the negative electrode and moves through the electrolyte to the positive electrode. The positive electrode is in a lithium rich state, and the more lithium ions are embedded in the positive electrode, the greater the discharge capacity. In the external circuit, it manifests as charge transfer movement to form a current.
2. Thermal model of lithium-ion batteries
2.1 Heat generation mechanism of lithium-ion batteries
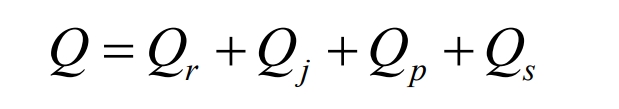
Lithium ion batteries undergo continuous chemical reactions during the charging and discharging process, which cannot avoid the generation of heat. From the current research, the heat sources are mainly divided into four parts: chemical reaction heat Qr, ohmic heat Qj, polarization heat Qp, and side reaction heat Qs. The total heat Q can be expressed by the following formula:
Reaction heat Qr: The heat generated by the insertion and detachment of Li+into the positive and negative electrodes during the operation of a lithium-ion battery. It is exothermic during discharge and endothermic during charging. The calculation formula is as follows:
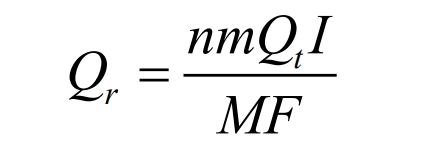
In the formula, Qt is the algebraic sum of the heat generated by the positive and negative electrodes in the electrochemical reaction, W; N is the number of individual batteries; M is the electrode mass, g; I is the current magnitude, A; M is the molar mass, g/mol; F is the Faraday constant, 96484.5C/mol.
Ohmic heat Qj: The resistance generated by Li+flowing through materials such as positive and negative poles, electrolytes, and separators is represented by the irreversible heat generated by the resistance, which is positive in both charging and discharging. The calculation formula is as follows:
In the formula, Re is the ohmic internal resistance, Ω.
Polarization heat Qp: When the current flows through the positive and negative electrodes, the potential deviates from the equilibrium potential, resulting in polarization phenomenon on the electrode surface. The heat generated by this polarization reaction is called polarization heat. The calculation formula is as follows:
In the formula, Rp is the equivalent virtual polarization internal resistance, Ω.
Side reaction heat Qs: During the charging and discharging process of the battery, there will be side reactions, including the heat generated by electrolyte decomposition at high temperatures and electrode material decomposition during overcharging and discharging. Generally, the side reaction heat of batteries during normal operation is very small and can be ignored.
2.2 Heat transfer characteristics of lithium-ion batteries
According to the basic theory of heat transfer, there are three ways of heat transfer, namely heat conduction, convective heat transfer, and thermal radiation. During the charging and discharging process of lithium-ion batteries, heat is generated internally, which is transferred to the battery surface through thermal conduction. The heat is then carried away by air through convection and radiation. Due to the fact that the battery temperature is not very high during normal operation, the heat generated by the radiative heat exchanger is minimal and generally ignored. The heat transfer process during the charging and discharging process of lithium-ion batteries satisfies energy balance, where the thermodynamic increase of the battery is equal to the heat flow rate generated inside the battery minus the heat flow rate dispersed to the environment.
Due to the complex internal heat generation during actual charging and discharging of lithium-ion batteries, for the convenience of calculation, the following assumptions are made for the physical properties of lithium-ion batteries in this article:
(1) The physical properties of each material inside the battery are uniform, and the thermal conductivity is anisotropic but of equal magnitude in the same direction;
(2) The density, specific heat capacity, and thermal conductivity of the battery are constants and are not affected by temperature;
(3) The internal radiation heat transfer effect of the battery is very small and negligible.
Inside the battery, heat conduction is the main form of heat transfer. The energy conservation equation for three-dimensional unsteady heat transfer in lithium-ion batteries in a three-dimensional Cartesian coordinate system is expressed as follows:
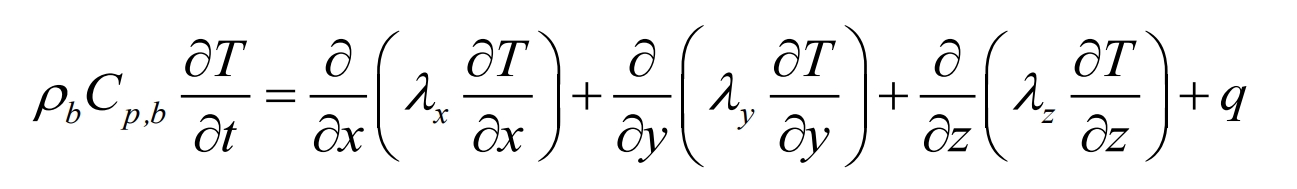
In the equation, ρ B is the battery density, kg/m3; Cp, b is the specific heat capacity of the battery, J/(kg Å K); T is the temperature, K; T is time, s; λ X, λ Y, λ Z thermal conductivity, W/(m Å K); Q is the body heat source, W/m3.
Lithium ion batteries have multiple components and different physical parameters. For the convenience of calculation, the physical parameters of the battery can be equivalently calculated.
(1) Specific heat capacity Cp, b
The specific heat capacity of lithium-ion batteries can be calculated using the mass weighting method based on the specific heat of the internal components, and the expression is as follows:
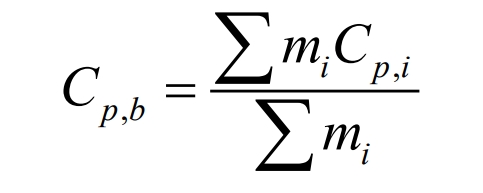
In the formula, mi and Cp, i are the mass and specific heat capacity of each component material of the battery, respectively.
(2) Density ρ B
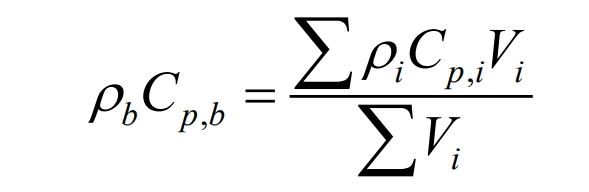
In the formula, Vi is the volume of each constituent material.
(3) Thermal conductivity
The thermal conductivity of batteries is anisotropic and difficult to measure through experimental methods. Therefore, the equivalent method proposed by Chen et al. was used for calculation, and the expression is as follows:
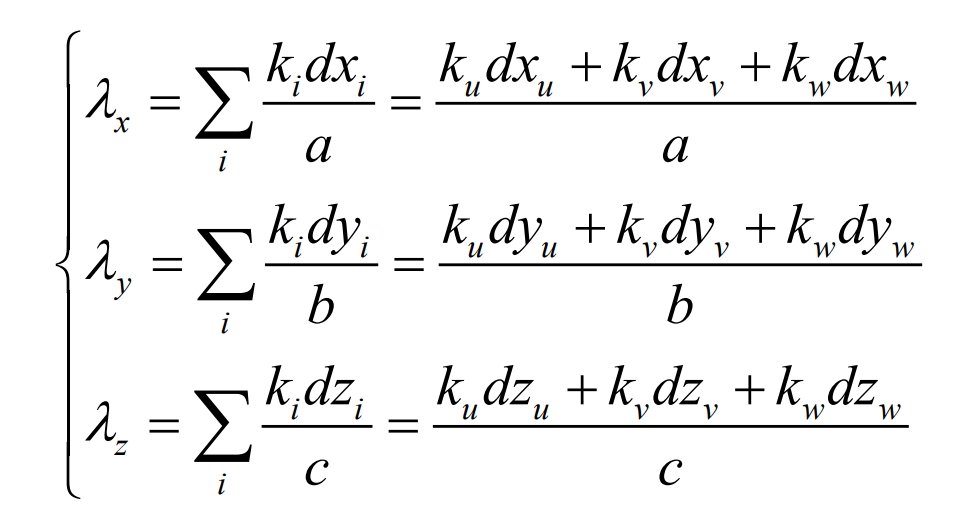
In the equation, λ X λ Y and λ Z represents the thermal conductivity of the battery along the x, y, and z directions, respectively; The subscripts u, v, and w represent the positive electrode, negative electrode, and diaphragm materials, respectively; a. B and c represent the thickness of the battery in the x, y, and z directions.
| Material | Density (kg/m3) | Specific heat capacity (J/kg · K) | Thermal conductivity (W/m · K) | UDS-0 | UDS-1 |
| Battery body | 1934.2 | 1399 | λx=λy =10, λz=1 | 1.19×10^6 | 9.83×10^5 |
| Positive electrode | 2719 | 871 | 202.4 | — | — |
| Negative electrode | 8978 | 381 | 387.6 | — | — |
Due to the complex internal structure of lithium-ion batteries and the difficulty of simulation, the battery has been simplified. The simplified battery consists of the main body of the battery and the positive and negative poles. The thermal physical parameters of the lithium-ion battery used in this article are shown in Table 1.
2.3 Lithium ion battery thermal model
In order to understand the thermal behavior of lithium-ion batteries and better design thermal management methods, it is necessary to model lithium-ion batteries. The use of numerical methods for thermal modeling of lithium-ion batteries can reduce the number of experiments, improve efficiency, and reduce costs.
Lithium ion batteries are difficult to model due to their multiple regions and physical properties. The charging and discharging process of lithium-ion batteries includes electrochemical reactions, charge transfer, material diffusion, current distribution, and thermal energy conservation. The transport of lithium ions in active materials occurs at the atomic scale, and its simulation is a complex multi-physical and multi-scale problem. The multi scale multi domain (MSMD) method can be used to solve multi physical problems in different domains.
For the MSMD model, many electrochemical submodels have been reported in literature, mainly including the Newman, Tiedemann, Gu, and Kim (NTGK) model, equivalent circuit (ECM), and Newman pseudo two-dimensional (P2D) model.
The NTGK model is a semi empirical electrochemical model. In the model, the volume current conductivity is a function of the potential difference between positive and negative electrodes. Assuming that these two parameters follow a polynomial format, the discharge depth is a variable in this function.
Specifically, the polarization curve of the battery can be obtained through experiments, and these two parameters can be fitted through experimental data curves. The NTGK model has been widely used for three-dimensional thermal modeling of lithium-ion batteries, especially for the thermal modeling of prismatic lithium-ion batteries.
In order to predict battery temperature, it is first necessary to solve the transportation equation, which controls the current flux as follows:
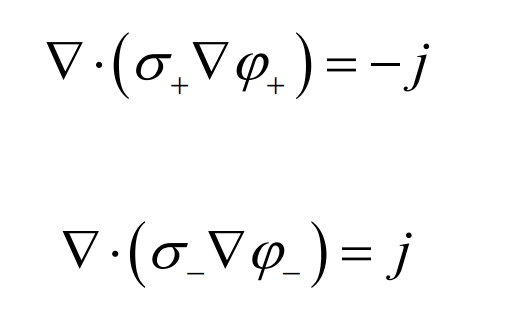
In the equation, σ+ and σ- Is the effective conductivity; φ+ and φ- Is the phase potential of the positive and negative electrodes. The equations at different scales are linked by the volume current conduction density j. The volume current conduction density can be calculated using an electrochemical model.
In the NTGK model, the volume current conduction density j and phase potential φ+ and φ- The relationship equation between them represents:
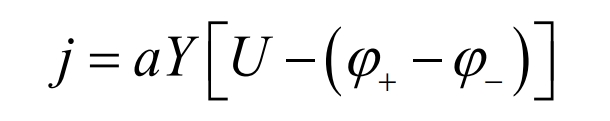
In the formula, a is the specific area of the electrode sandwich plate in the battery; Y and U are model parameters, which are functions of the depth of discharge (DoD). The DoD expression is:
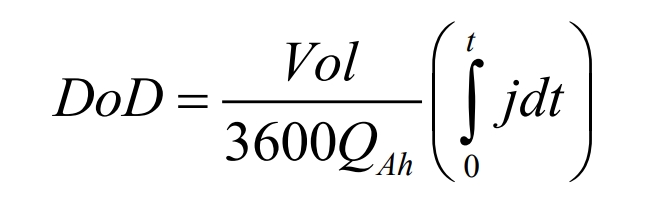
In the formula, Vol is the battery capacity; QAh is the total battery capacity. For a given battery, the current voltage (I-V) response curve can be obtained through experiments, and then U and Y can be determined through curve fitting. The expressions for U and Y are as follows:
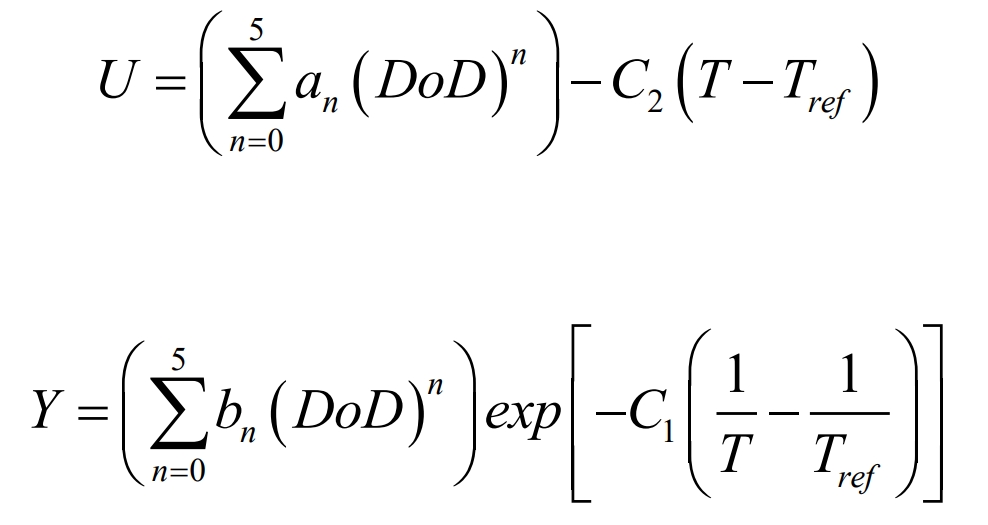
In the equation, C1 and C2 are specific constants of the NTGK model, and Tref is the reference temperature.
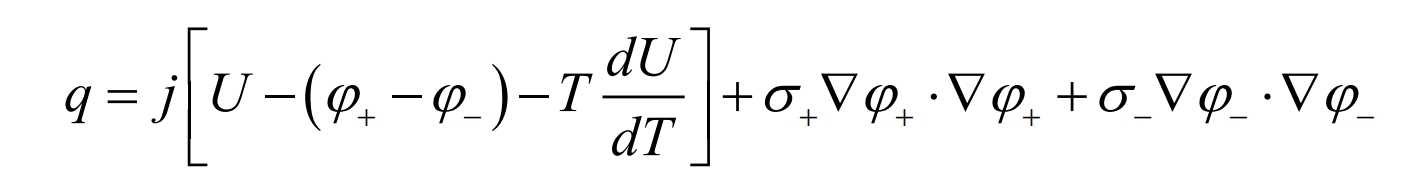
In the NTGK model, the heat of lithium-ion batteries consists of electrochemical reaction heat and ohmic heat. The electrochemical volumetric heat source qE can be divided into irreversible heat source terms and reversible heat source terms, and the expression is as follows:
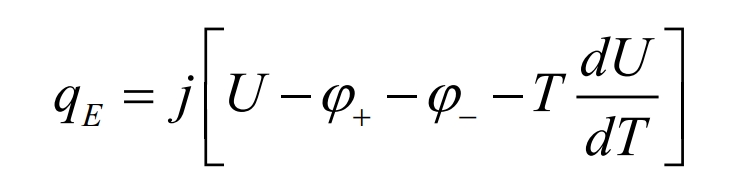
In the equation, j [U- φ+-φ-] Is an irreversible heat source term- JT dU/dT is the reversible heat source term.
Then, the ohmic heat of the battery is added, and the heat source term of the battery can be expressed as:
3. Fundamentals of Computational Fluid Dynamics Theory
Computational Fluid Dynamics (CFD) is a product of the combination of modern fluid mechanics, numerical mathematics, and computer science. It approximates the differential and integral terms of the control equations of fluid mechanics as discrete algebraic forms, and uses computers to solve discrete algebraic equations to obtain numerical solutions at discrete time/space points.
The CFD method can be used to numerically solve fluid flow and heat transfer problems, obtaining the distribution of physical quantities such as velocity, pressure, and temperature. Fluid flow is governed by three fundamental conservation laws, namely the conservation of mass, momentum, and energy.
(1) Conservation of mass
The mass conservation equation, also known as the continuity equation, represents that the increment of mass in a microelement per unit time is equal to the net mass of the fluid flowing into the microelement at the same time interval. The expression is as follows:
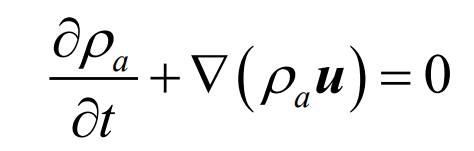
In the equation, ρ A represents air density, kg/m3; T is time, s; U is the velocity vector, m/s.
(2) Conservation of momentum
The momentum conservation equation, also known as the Navier Stokes equation, describes the flow of viscous fluids. The momentum conservation equation is essentially Newton’s second law, which can be expressed as the rate of increase in fluid momentum over time in a microelement equal to the sum of various external forces acting on the microelement. The expression is as follows:
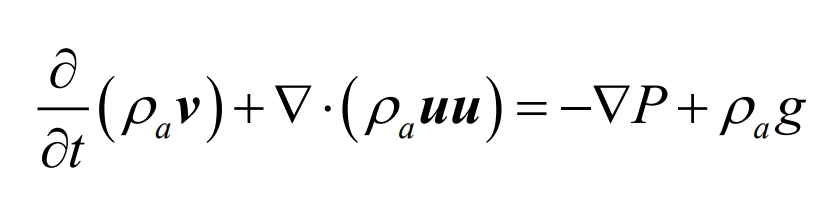
In the formula, p represents pressure, Pa; G represents the acceleration of gravity, m/s2.
(3) Conservation of energy
The conservation of energy is actually the first law of thermodynamics, and the equation expression is as follows:
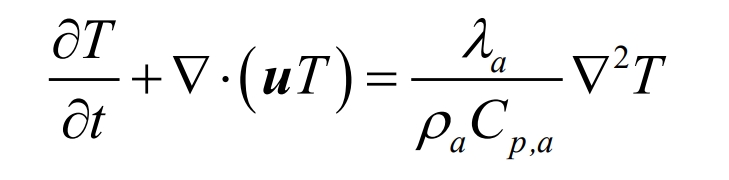
In the equation, λ A is the air thermal conductivity, W/(m Å K); Cp, a is the specific heat capacity of the air, J/(kg Å K).
4. Numerical simulation of individual lithium-ion batteries
Perform CFD numerical simulation research on individual lithium-ion batteries. The entire CFD simulation process includes preprocessing (establishing geometric models, meshing, defining materials and boundary conditions), solver, and post-processing parts.
4.1 Geometric model and mesh division
This article selects a commercial square lithium iron phosphate battery with a nominal capacity of 50Ah and a nominal voltage of 3.2V. The specific parameters are shown in Table 2.
| Parameter | Value |
| Battery width | 135mm |
| Battery height | 185mm |
| Battery thickness | 30mm |
| Pole height | 12mm × 5mm |
| Nominal capacity | 50Ah |
| Nominal voltage | 3.2V |
| Mass | 1380g |
| Internal resistance | ≤ 1.5m Ω |
| Charging cut-off voltage | 3.65V |
| Discharge cut-off voltage | 2.5V |
Firstly, a three-dimensional geometric modeling of a single lithium-ion battery is conducted, divided into three regions: the battery body, positive pole, and negative pole. The three-dimensional model and dimensions are shown in Figure 1.
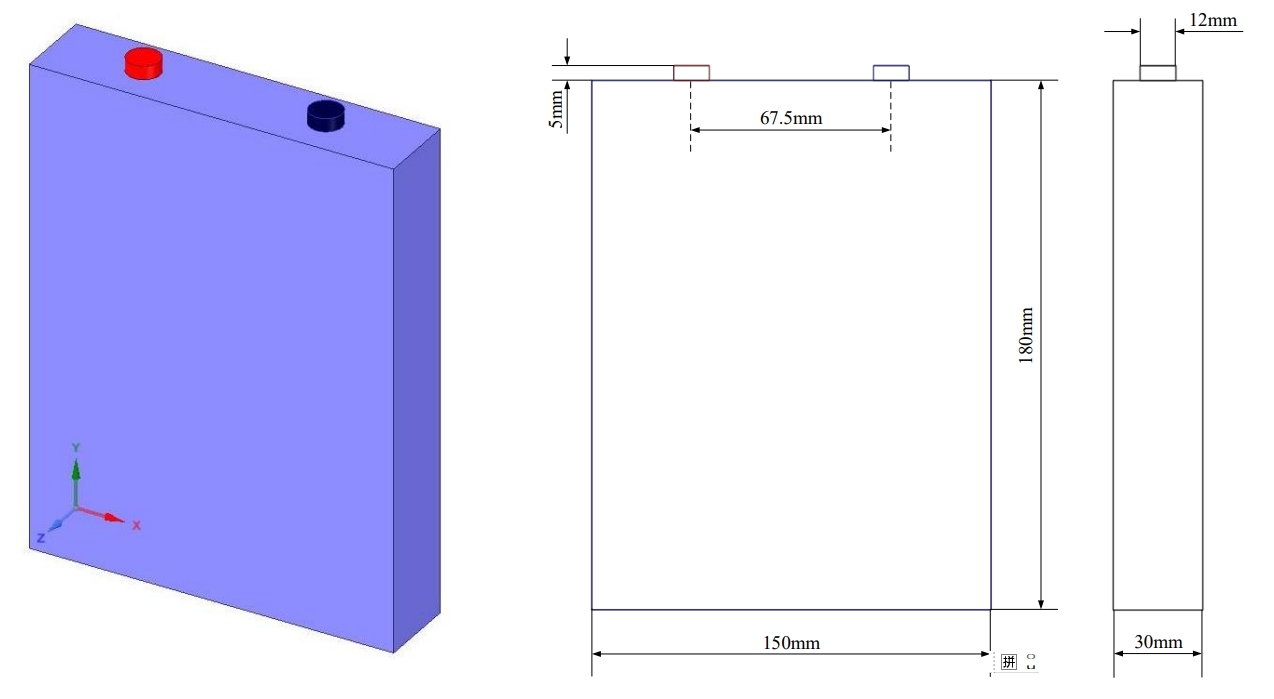
Divide the established geometric model into grids, and use unstructured grids for both the battery body and positive and negative pole sections. The grid size for the main body of the battery is set to 2mm, and the grid size for the pole part is set to 1mm. According to the above settings, the single cell battery is divided into grids, generating 94550 grids with a maximum unit mass of 1 and an average unit mass of 0.97535. The closer the grid unit quality is to 1, the better the grid quality. It can be seen that the quality of the single cell battery grid is relatively high, and the grid model is shown in Figure 2.

4.2 Heat source setting
In Section 2, the heat generation mechanism of lithium-ion batteries was introduced, and the NTGK model used in this article was elaborated. Import the single cell battery grid model into CFD simulation software, set up transient research, open the energy equation, and call up the NTGK model. Set the battery capacity, charge and discharge cutoff voltage, and match the active and positive and negative electrode areas of the battery. The two important parameters U and Y in the NTGK model are fitted using voltage data of batteries at different discharge rates. The expression is shown in the formula, and the fitting results are listed in Table 3.
| Parameter | Value | Parameter | Value |
| a0 | 3.307691 | b0 | 945.6434 |
| a1 | -0.98847 | b1 | 3416.86 |
| a2 | 1.82887 | b2 | 23311.51 |
| a3 | -5.18904 | b3 | -53677 |
| a4 | 6.464672 | b4 | 53419.34 |
| a5 | -3.0029 | b5 | 19070.1 |
| C2 | 0.00095 | C1 | 1800 |
4.3 Initial and boundary conditions
Set the ambient temperature and initial temperature to 25 ℃, with a convective heat transfer boundary condition. Place the battery in air, and the air flow takes away the heat from the battery surface. The boundary condition expression is:
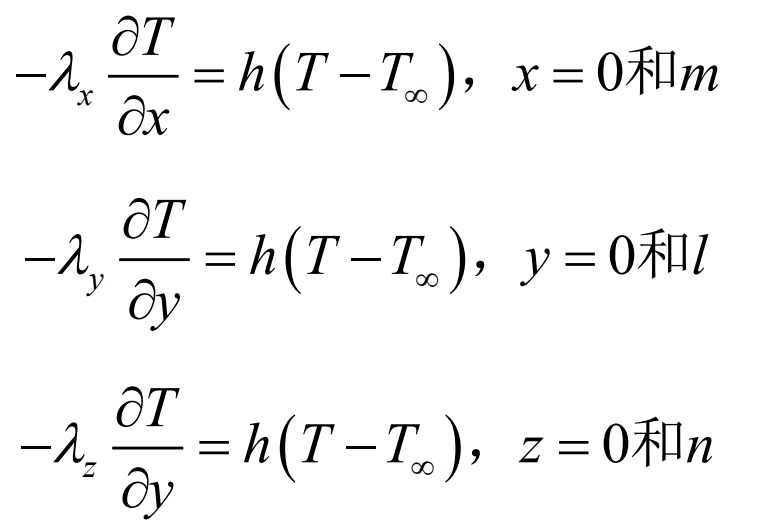
In the formula, T ∞ is the ambient temperature, m, l, and n are the width, height, and thickness of the battery, respectively, and h is the convective heat transfer coefficient. In this paper, 5W/m2 · K is taken.
5. Simulation and experimental verification of monomer lithium-ion batteries
5.1 Single lithium-ion battery discharge experiment
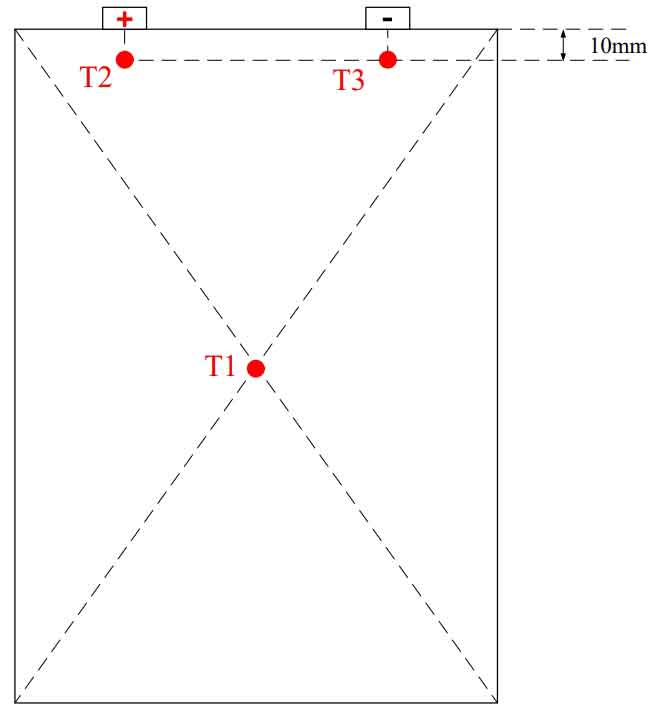
Firstly, experimental testing was conducted on the discharge of a single lithium-ion battery, with discharge rates of 1C, 2C, and 3C. Voltage and temperature data were obtained at different discharge rates through the experiment. The temperature measurement points of the battery are shown in Figure 3. Measurement point T1 is arranged at the geometric center of the battery surface, while measurement points T2 and T3 are respectively arranged 10mm below the positive and negative poles.
The testing steps for the discharge experiment of a single battery are as follows:
(1) Place the battery in a 25 ℃ incubator for 30 minutes;
(2) Charge the battery at a constant current of 25A to a voltage of 3.65V, and then charge at a constant voltage until the current is less than 2.5A;
(3) Place the battery in a 25 ℃ incubator for 2 hours;
(4) Perform 1C rate constant current discharge on the battery, record voltage and temperature data at the measuring point;
(5) Repeat steps (1) – (4) to change the 1C magnification to 2C and 3C magnification, and end the test.
5.2 Experimental results and simulation verification of single lithium-ion batteries
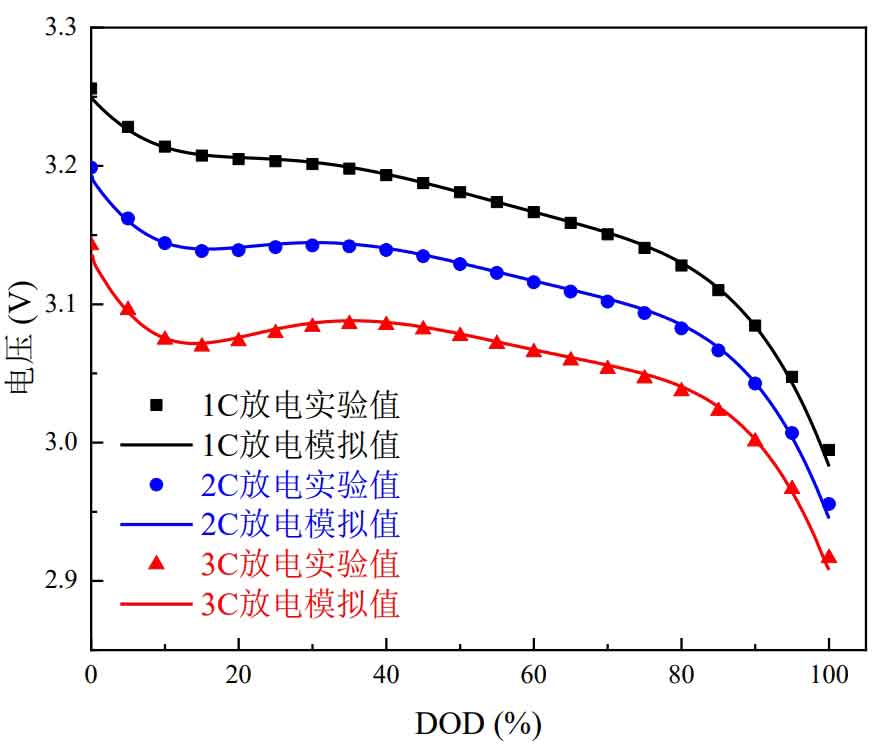
The voltage variation curve with DOD under different discharge rates was obtained through experiments and compared with the simulation results, as shown in Figure 4. It can be seen that the experimental results and simulation results highly overlap with the voltage curve, indicating that the NTGK model has a good prediction of voltage changes.
Compare the temperature changes of the three measuring points measured in the experiment with the simulation results. The comparison results are shown in Figure 5. Figures 5 (a), (b), and (c) show the comparison results of T1, T2, and T3 measuring points, respectively. Figure 5 (d) shows the comparison results of the average temperature values of the three measuring points.
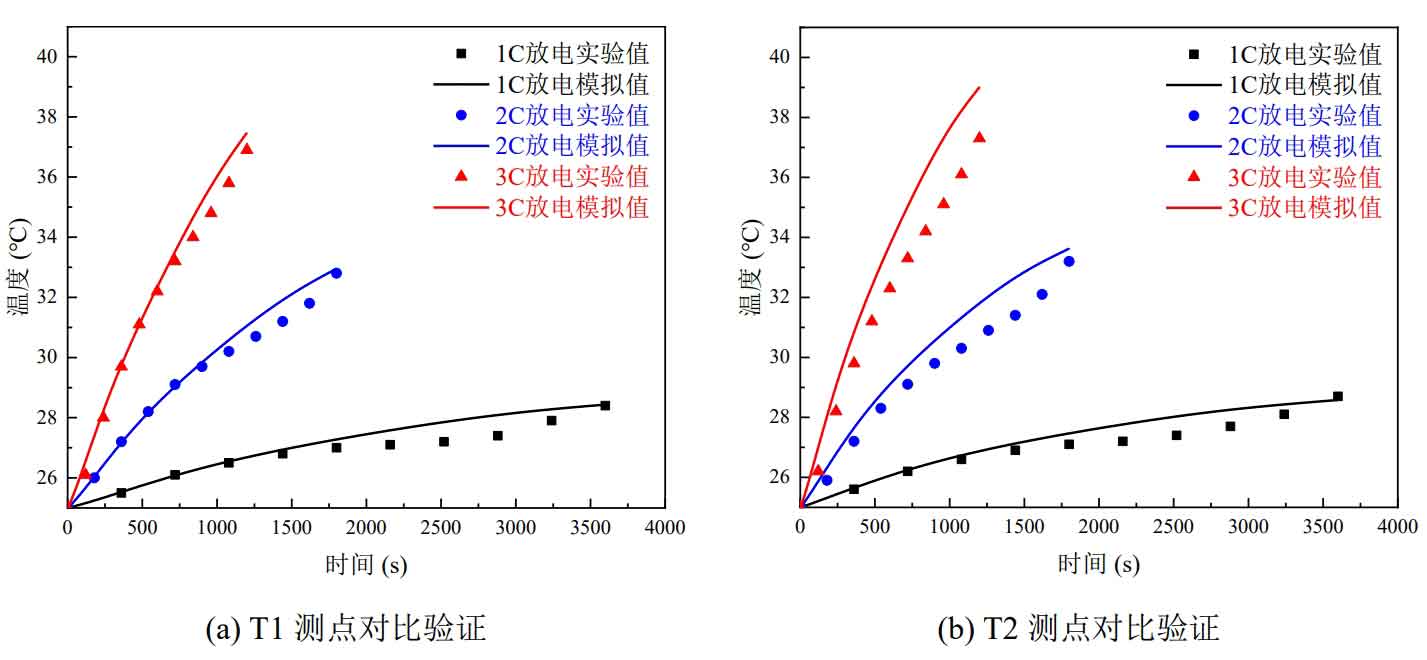
At each discharge rate, the temperatures of measuring points T1, T2, and T3 show an upward trend, indicating that the temperature at the negative electrode is higher than that at the positive electrode and higher than that at the surface center. From Figure 2-5, it can be seen that the temperature change trends of simulation and experiment are roughly the same at different discharge rates at each measuring point. The maximum absolute error of temperature simulation and experimental verification at three measuring points is 1.7 ℃, and the maximum absolute error of average temperature simulation and experimental verification at three measuring points is 1.1 ℃. This demonstrates the accuracy of the discharge simulation results of individual batteries, validates the thermal model of individual batteries, and lays the foundation for the subsequent wind cooling and thermal management simulation work.
5.3 Simulation analysis of individual lithium-ion batteries
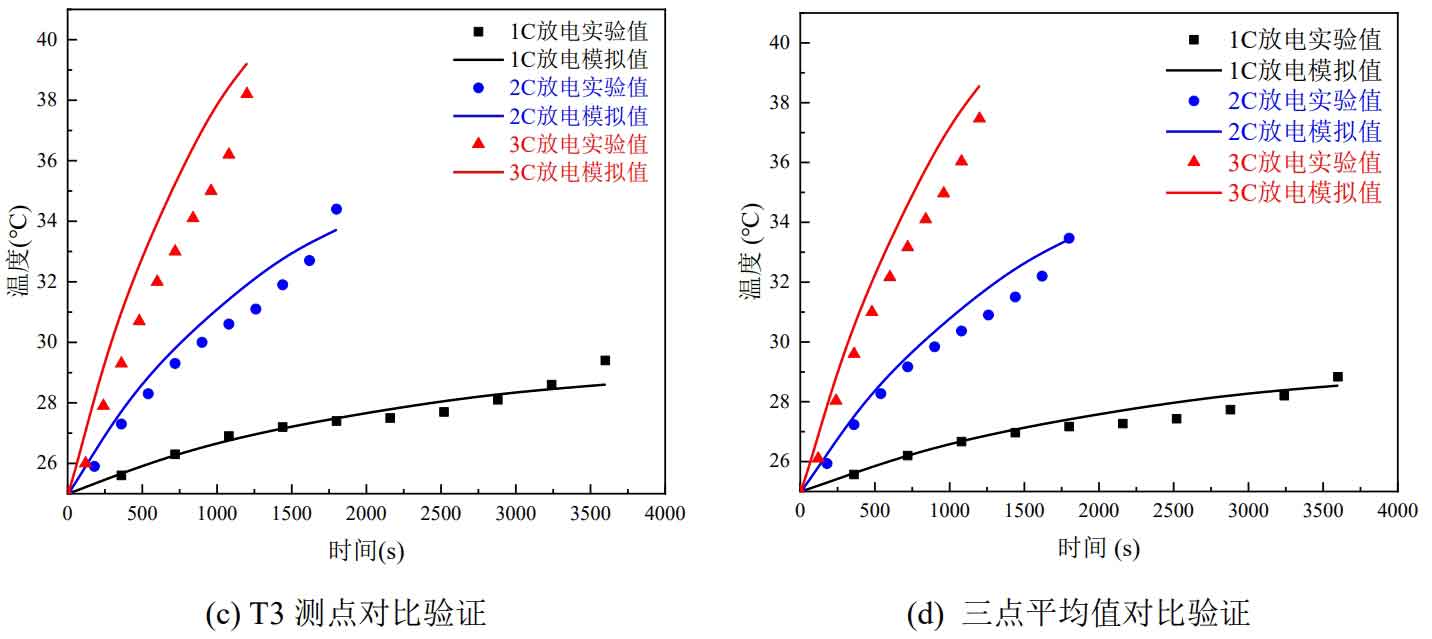
Perform 1C, 2C, and 3C discharge simulations on individual lithium-ion batteries, with simulation times of 3600s, 1800s, and 1200s, respectively. At the end of the simulation, the temperature distribution cloud diagram of the middle section of the z-axis of the battery is shown in Figure 6.
From Figure 6, it can be seen that as the discharge rate increases, the battery temperature increases, and the highest temperature appears below the negative pole. The temperature distribution under different discharge rates is roughly the same, with the temperature continuously increasing along the y-axis positive direction or height direction. At discharge rates of 1C, 2C, and 3C, the temperature rise of the battery is 3.85 ℃, 9.96 ℃, and 17.03 ℃, respectively. As the discharge rate increases, the temperature difference of the individual battery also rapidly increases. The maximum temperature difference during 1C discharge is 0.78 ℃, while the maximum temperature difference during 3C discharge is 5.83 ℃.
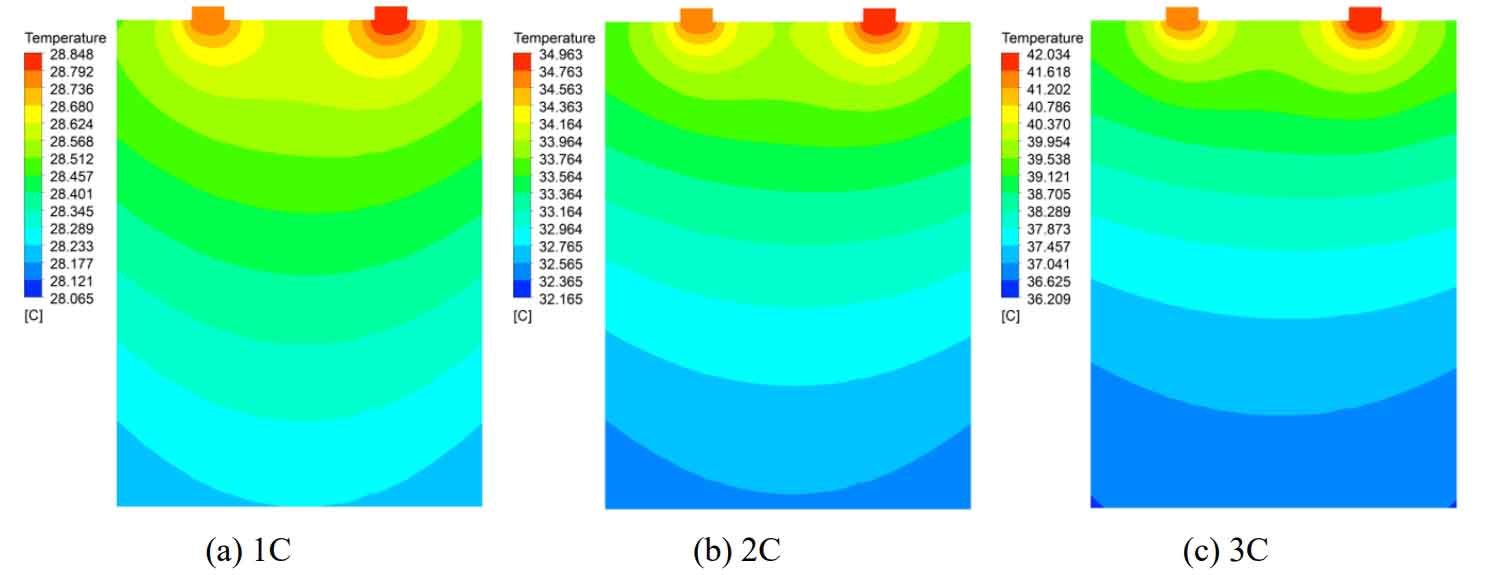
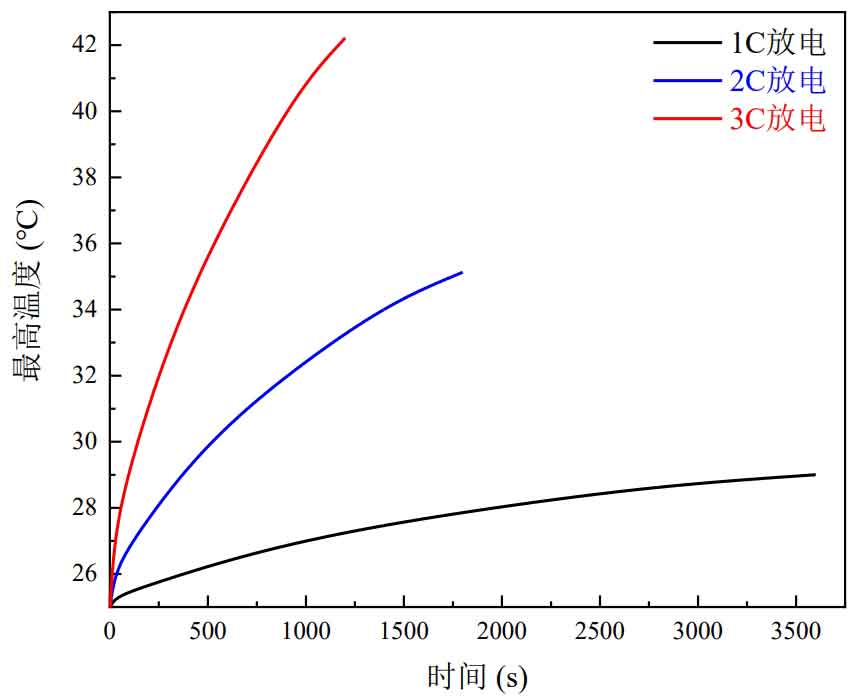
The curve of the maximum temperature of the battery over time is shown in Figure 7. When the battery is discharged at a 3C rate, the temperature rises rapidly, reaching a maximum temperature of 42.03 ℃, which has exceeded the upper limit of the recommended temperature range for lithium-ion batteries. If no thermal management measures are taken, it will affect the battery’s performance.
Briefly introduce the structure and working principle of lithium-ion batteries, and explain their heat generation mechanism and heat transfer characteristics. Introduce the basic concept of CFD and list the expression of control equations. The focus is on discussing the thermal model of lithium-ion batteries, and introducing the principles of the electrochemical model selected in this article, namely the NTGK model. Subsequently, a three-dimensional geometric model of lithium-ion batteries was established and meshed to simulate the temperature field at different discharge rates.
Simulation shows that the highest temperature of lithium-ion batteries occurs below the negative pole, and the battery temperature increases with increasing discharge rate. A lithium-ion battery discharge experiment was established, and the discharge voltage curve and temperature change curve of the measurement points were compared between the experiment and simulation. The maximum absolute error of the average temperature value of each measurement point simulation and experiment under different discharge rates was only 1.1 ℃, which verified the accuracy of the simulation model. The heat generation model of individual lithium-ion batteries can be used for the following research on air cooling and heat dissipation of battery cabinets.