
The global energy storage landscape is undergoing a transformative shift, driven by the rapid adoption of lithium iron phosphate (LiFePO₄) batteries. Recent data from the China Automotive Power Battery Industry Innovation Alliance reveals that LiFePO₄ batteries accounted for 69.3% of total vehicle installations in the first half of 2024, solidifying their dominance over nickel-cobalt-manganese (NCM) ternary batteries. This article explores the technical advantages, market dynamics, and strategic implications of this paradigm shift.
1. Market Dynamics: LiFePO₄ vs. NCM Batteries
The cost-performance ratio of LiFePO₄ batteries has become increasingly compelling, as demonstrated by the following comparative analysis:
| Parameter | LiFePO₄ | NCM |
|---|---|---|
| Energy Density (Wh/kg) | 160-180 | 200-250 |
| Cycle Life | 3,000-5,000 | 1,500-2,500 |
| Thermal Runaway Temp. | 270°C | 150°C |
| Material Cost ($/kWh) | 72-85 | 95-115 |
The total cost of ownership (TCO) advantage can be quantified using:
$$ \text{TCO} = \frac{C_{\text{initial}} + N_{\text{cycles}} \times C_{\text{degradation}}}{\text{Energy Throughput}} $$
Where $C_{\text{initial}}$ represents initial battery cost and $N_{\text{cycles}}$ denotes cycle life.
2. Technological Evolution of LiFePO₄ Batteries
Recent breakthroughs in cathode engineering have enhanced the energy density through nanostructuring:
$$ \text{Specific Capacity} = \frac{nF}{3.6M} $$
Where:
$n$ = number of electrons transferred (1 for LiFePO₄)
$F$ = Faraday constant (96,485 C/mol)
$M$ = molar mass (157.76 g/mol)
Leading manufacturers have achieved 15% improvement in volumetric energy density through:
- Particle size optimization: $d_{50} \leq 2\ \mu\text{m}$
- Carbon coating thickness: $10-20\ \text{nm}$
- Tap density enhancement: $\geq 1.4\ \text{g/cm}^3$
3. Global Supply Chain Restructuring
The lithium iron phosphate battery supply chain demonstrates remarkable vertical integration:
| Component | Localization Rate | Price Trend (2024) |
|---|---|---|
| Cathode Material | 92% | -18% YoY |
| Electrolyte | 85% | -12% YoY |
| Separators | 78% | -9% YoY |
This integration enables cost reduction following the learning curve model:
$$ C(t) = C_0 \times N(t)^{-b} $$
Where $b$ ≈ 0.28 for lithium iron phosphate battery production.
4. Policy Drivers and Standardization
China’s updated Lithium-ion Battery Industry Specifications (2024) mandate:
$$ \text{Energy Density} \geq 155\ \text{Wh/kg} \quad (\text{for power batteries}) $$
This has accelerated R&D investments in LiFePO₄ technology, particularly in:
- Multi-electron transfer systems
- Solid-state hybrid architectures
- AI-driven battery management systems
5. Emerging Challenges and Opportunities
While lithium iron phosphate batteries dominate mid-range EVs ($15,000-$35,000), new technologies are emerging:
| Technology | 2024 Penetration | Projection 2030 |
|---|---|---|
| LiFePO₄ | 69.3% | 58-62% |
| Semi-solid State | 1.1% | 15-18% |
| Sodium-ion | 0.02% | 8-12% |
The future development trajectory can be modeled using:
$$ \frac{dM}{dt} = k(P – M) – \beta S $$
Where:
$M$ = LiFePO₄ market share
$P$ = Price advantage factor
$S$ = Competing technologies’ growth rate
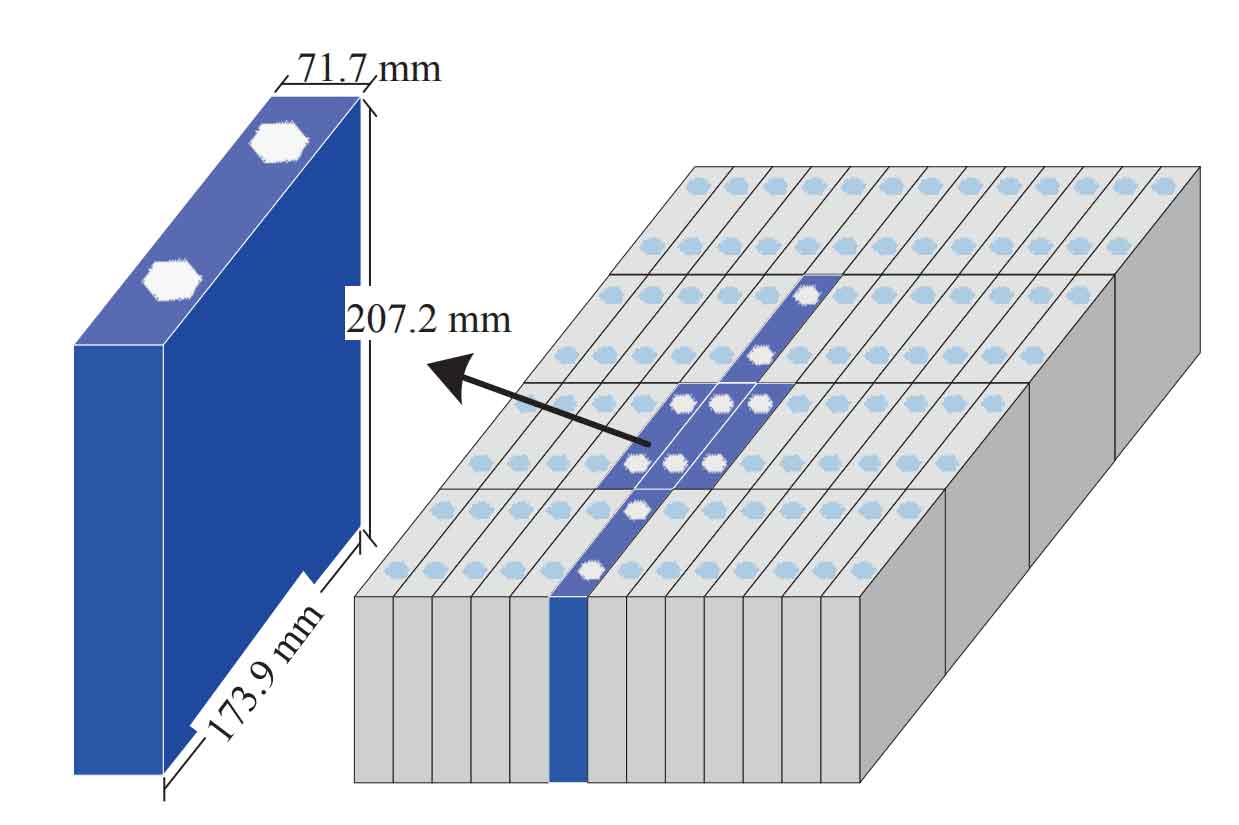
As the industry evolves, lithium iron phosphate batteries will continue to play a pivotal role in energy storage systems, particularly in applications prioritizing safety, cycle life, and cost-effectiveness. Their adaptability to various form factors – from prismatic cells to modular battery packs – ensures continued relevance in the electrification revolution.