
As automakers intensify their focus on solid-state batteries, the industry faces a critical question: Will the 2027 mass-production timeline hold true? This article explores the technological leaps, challenges, and competitive dynamics shaping the future of energy storage.
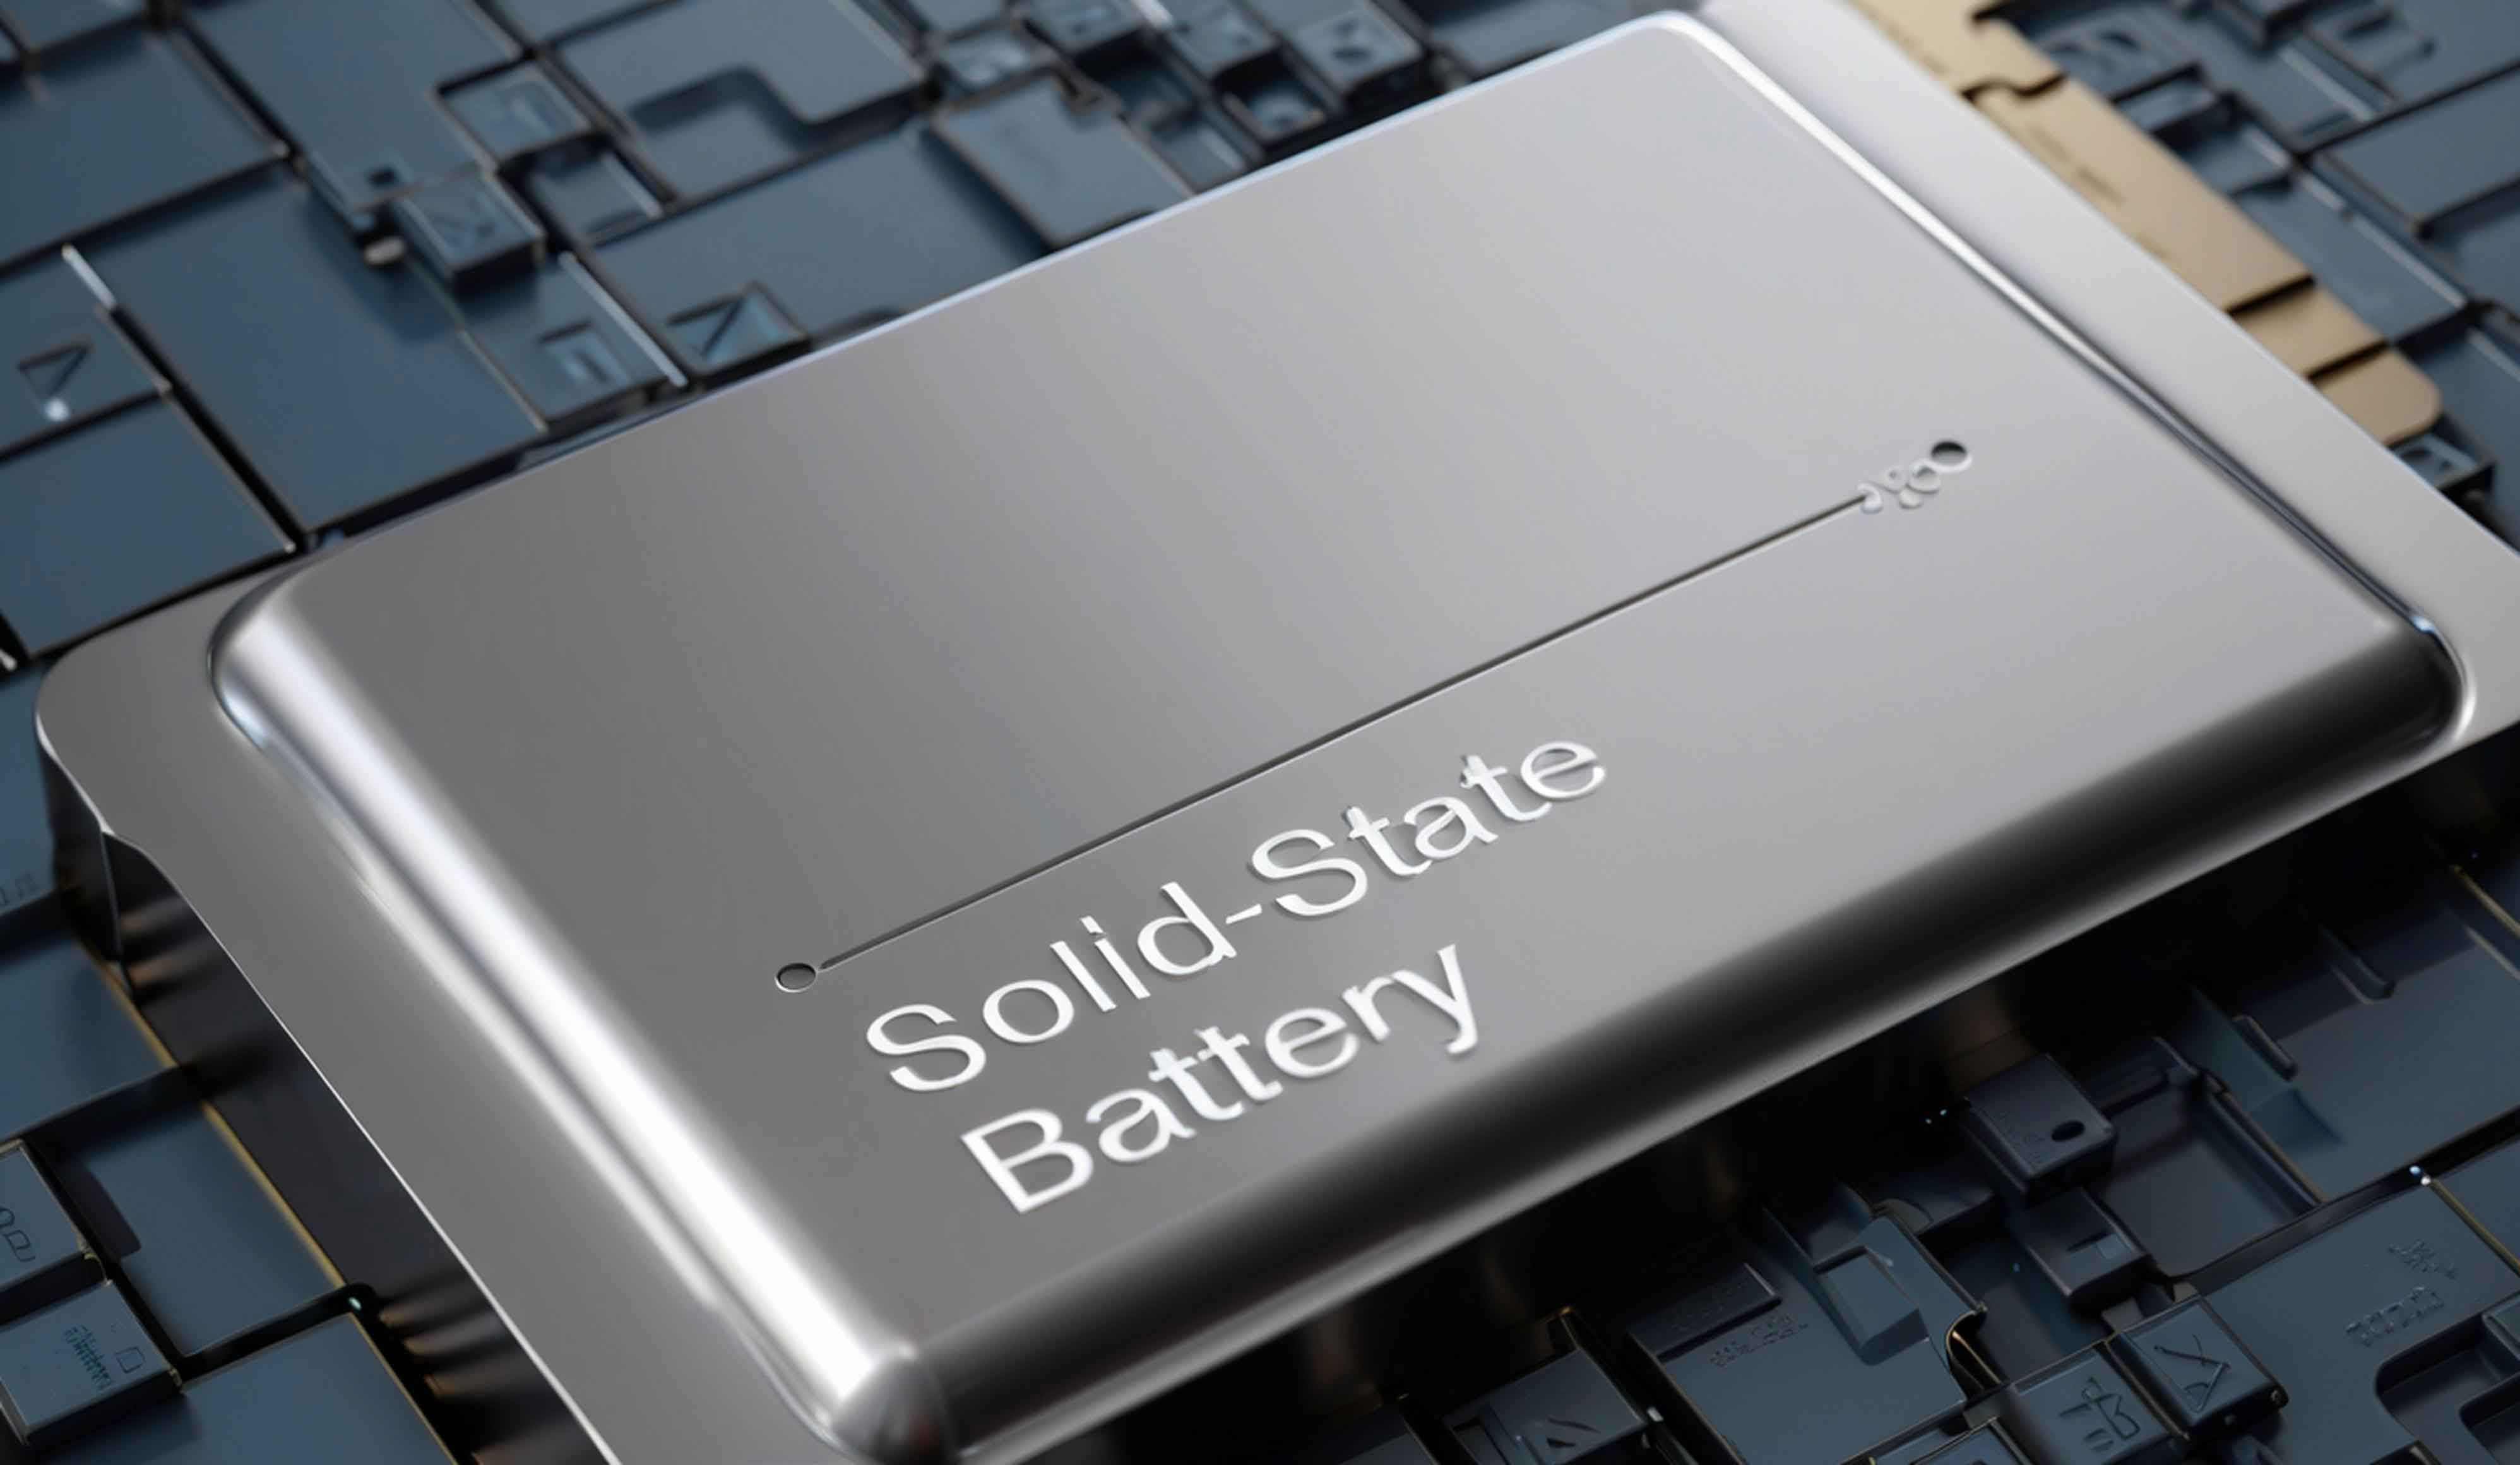
1. Why Solid-State Batteries Matter
Solid-state batteries (SSBs) represent a paradigm shift through two fundamental innovations:
$$ \text{Energy Density (Wh/kg)} = \frac{\text{Capacity (Ah)} \times \text{Voltage (V)}}{\text{Mass (kg)}} $$
Comparative performance metrics:
| Parameter | Liquid Li-ion | Semi-SSBs | Full-SSBs |
|---|---|---|---|
| Energy Density | 250-300 Wh/kg | 300-400 Wh/kg | 400-500+ Wh/kg |
| Charge Rate | 1-2C | 3-4C | 5-10C |
| Cycle Life | 1,000-2,000 | 500-800 | TBD |
2. Automaker Roadmaps
Key players are adopting diverse strategies:
| Company | Technology Partner | Target Energy Density | Launch Timeline |
|---|---|---|---|
| BYD | In-house | 350 Wh/kg | 2026 (semi-SSB) |
| Mercedes-Benz | Factorial Energy | 450 Wh/kg | 2027 prototype |
| NIO | WeLion | 360 Wh/kg | 2024 (semi-SSB) |
The interfacial resistance challenge can be modeled as:
$$ R_{interface} = \frac{\delta}{\sigma_{ionic}} + \frac{\delta}{\sigma_{electronic}} $$
Where δ represents interface thickness and σ denotes conductivity.
3. Manufacturing Hurdles
Current production cost analysis reveals:
| Component | Liquid Li-ion ($/kWh) | Solid-State ($/kWh) |
|---|---|---|
| Electrolyte | 8-12 | 40-60 |
| Cathode | 25-35 | 50-70 |
| Manufacturing | 15-20 | 30-50 |
The total cost equation:
$$ C_{total} = C_{material} + C_{processing} + C_{R\&D} $$
Current estimates suggest solid-state batteries need 5× cost reduction to reach price parity with conventional lithium-ion.
4. Material Science Breakthroughs
Emerging electrolyte materials show promise:
| Material Type | Conductivity (S/cm) | Stability Window |
|---|---|---|
| Oxide-based | 10-3-10-2 | >5V |
| Sulfide-based | 10-2-10-1 | 1.7-2.5V |
| Polymer-based | 10-5-10-3 | 4-4.5V |
The ionic conductivity requirement for practical applications:
$$ \sigma_{ionic} > 10^{-3} \, \text{S/cm} \, \text{at} \, 25^\circ \text{C} $$
5. Industry Consensus vs. Reality
While automakers project 2027 commercialization, technical readiness levels (TRL) tell a different story:
| Development Phase | Current Status | Target |
|---|---|---|
| Material Synthesis | TRL 4-5 | TRL 9 |
| Cell Design | TRL 3-4 | TRL 8 |
| Manufacturing | TRL 2-3 | TRL 7 |
The technology maturation curve follows:
$$ \text{TRL} = \frac{\ln(\text{R\&D Investment})}{\ln(1 + \text{Technical Complexity})} $$
6. Future Outlook
Adoption scenarios based on current progress:
| Scenario | 2027 Penetration | 2030 Penetration |
|---|---|---|
| Conservative | 0.5% | 3-5% |
| Moderate | 1-2% | 8-10% |
| Optimistic | 3-5% | 15-20% |
The market growth equation suggests:
$$ \text{SSB Market Size} = \frac{\text{EV Production} \times \text{Penetration Rate} \times \text{Battery Cost}}{1 – \text{Learning Rate}} $$
As the industry approaches the 2027 deadline, solid-state battery development remains a high-stakes race between material innovation and manufacturing reality. While prototypes demonstrate technical feasibility, true commercialization requires solving the complex equation of performance, durability, and cost – a challenge that will define the next phase of electrification.