
Urban Air Mobility (UAM) and Advanced Air Mobility (AAM) represent transformative visions for future transportation, aiming to alleviate ground congestion through the use of environmentally friendly aerial vehicles. A key enabler for this vision is the electric Vertical Takeoff and Landing (eVTOL) aircraft. Among various eVTOL configurations, tiltrotor or tilt-wing designs offer a compelling blend of efficient forward cruise, enabled by fixed-wing aerodynamics, and the versatile maneuverability of vertical flight. The propulsion of these aircraft hinges entirely on electric systems, with the li ion battery serving as the primary—and often sole—energy source. This fundamental reliance introduces a critical challenge: the intrinsic dynamic discharge behavior of lithium-ion cells, where voltage and available power decay as the state of charge depletes. In this analysis, we establish comprehensive system models, propose a performance evaluation framework that accounts for these dynamics, and rigorously quantify their impact on the operational capabilities of a tiltrotor eVTOL. Understanding this relationship is paramount for accurate mission planning, robust design, and ultimately, realizing the full potential of urban air travel.
The operational profile of a tiltrotor eVTOL is inherently more complex than that of a conventional aircraft or a multi-rotor drone. A typical mission profile, as conceptualized for UAM applications, consists of distinct flight phases: vertical takeoff, hover, transition to forward flight, climb, cruise, descent, transition back to vertical flight, and finally, vertical landing. Each phase imposes unique demands on the propulsion system. The vertical and hover phases require high thrust to weight ratio, demanding high current draw from the li ion battery pack. The cruise phase, while generally requiring less instantaneous power, is the longest in duration and is critically sensitive to the overall energy efficiency of the system. The transition phases involve complex aerodynamic interactions and controlled tilting of rotors or wings. A performance assessment method must therefore be phase-aware. Furthermore, unlike aircraft with fossil fuel propulsion where the vehicle mass decreases during flight, the mass of an eVTOL remains constant as the li ion battery discharges its energy electrochemically without a change in physical mass. This constant mass influences all flight dynamics calculations. The core of an accurate performance model lies in faithfully representing the behavior of the electric powertrain components: the battery pack, the electric motors, and the propellers.
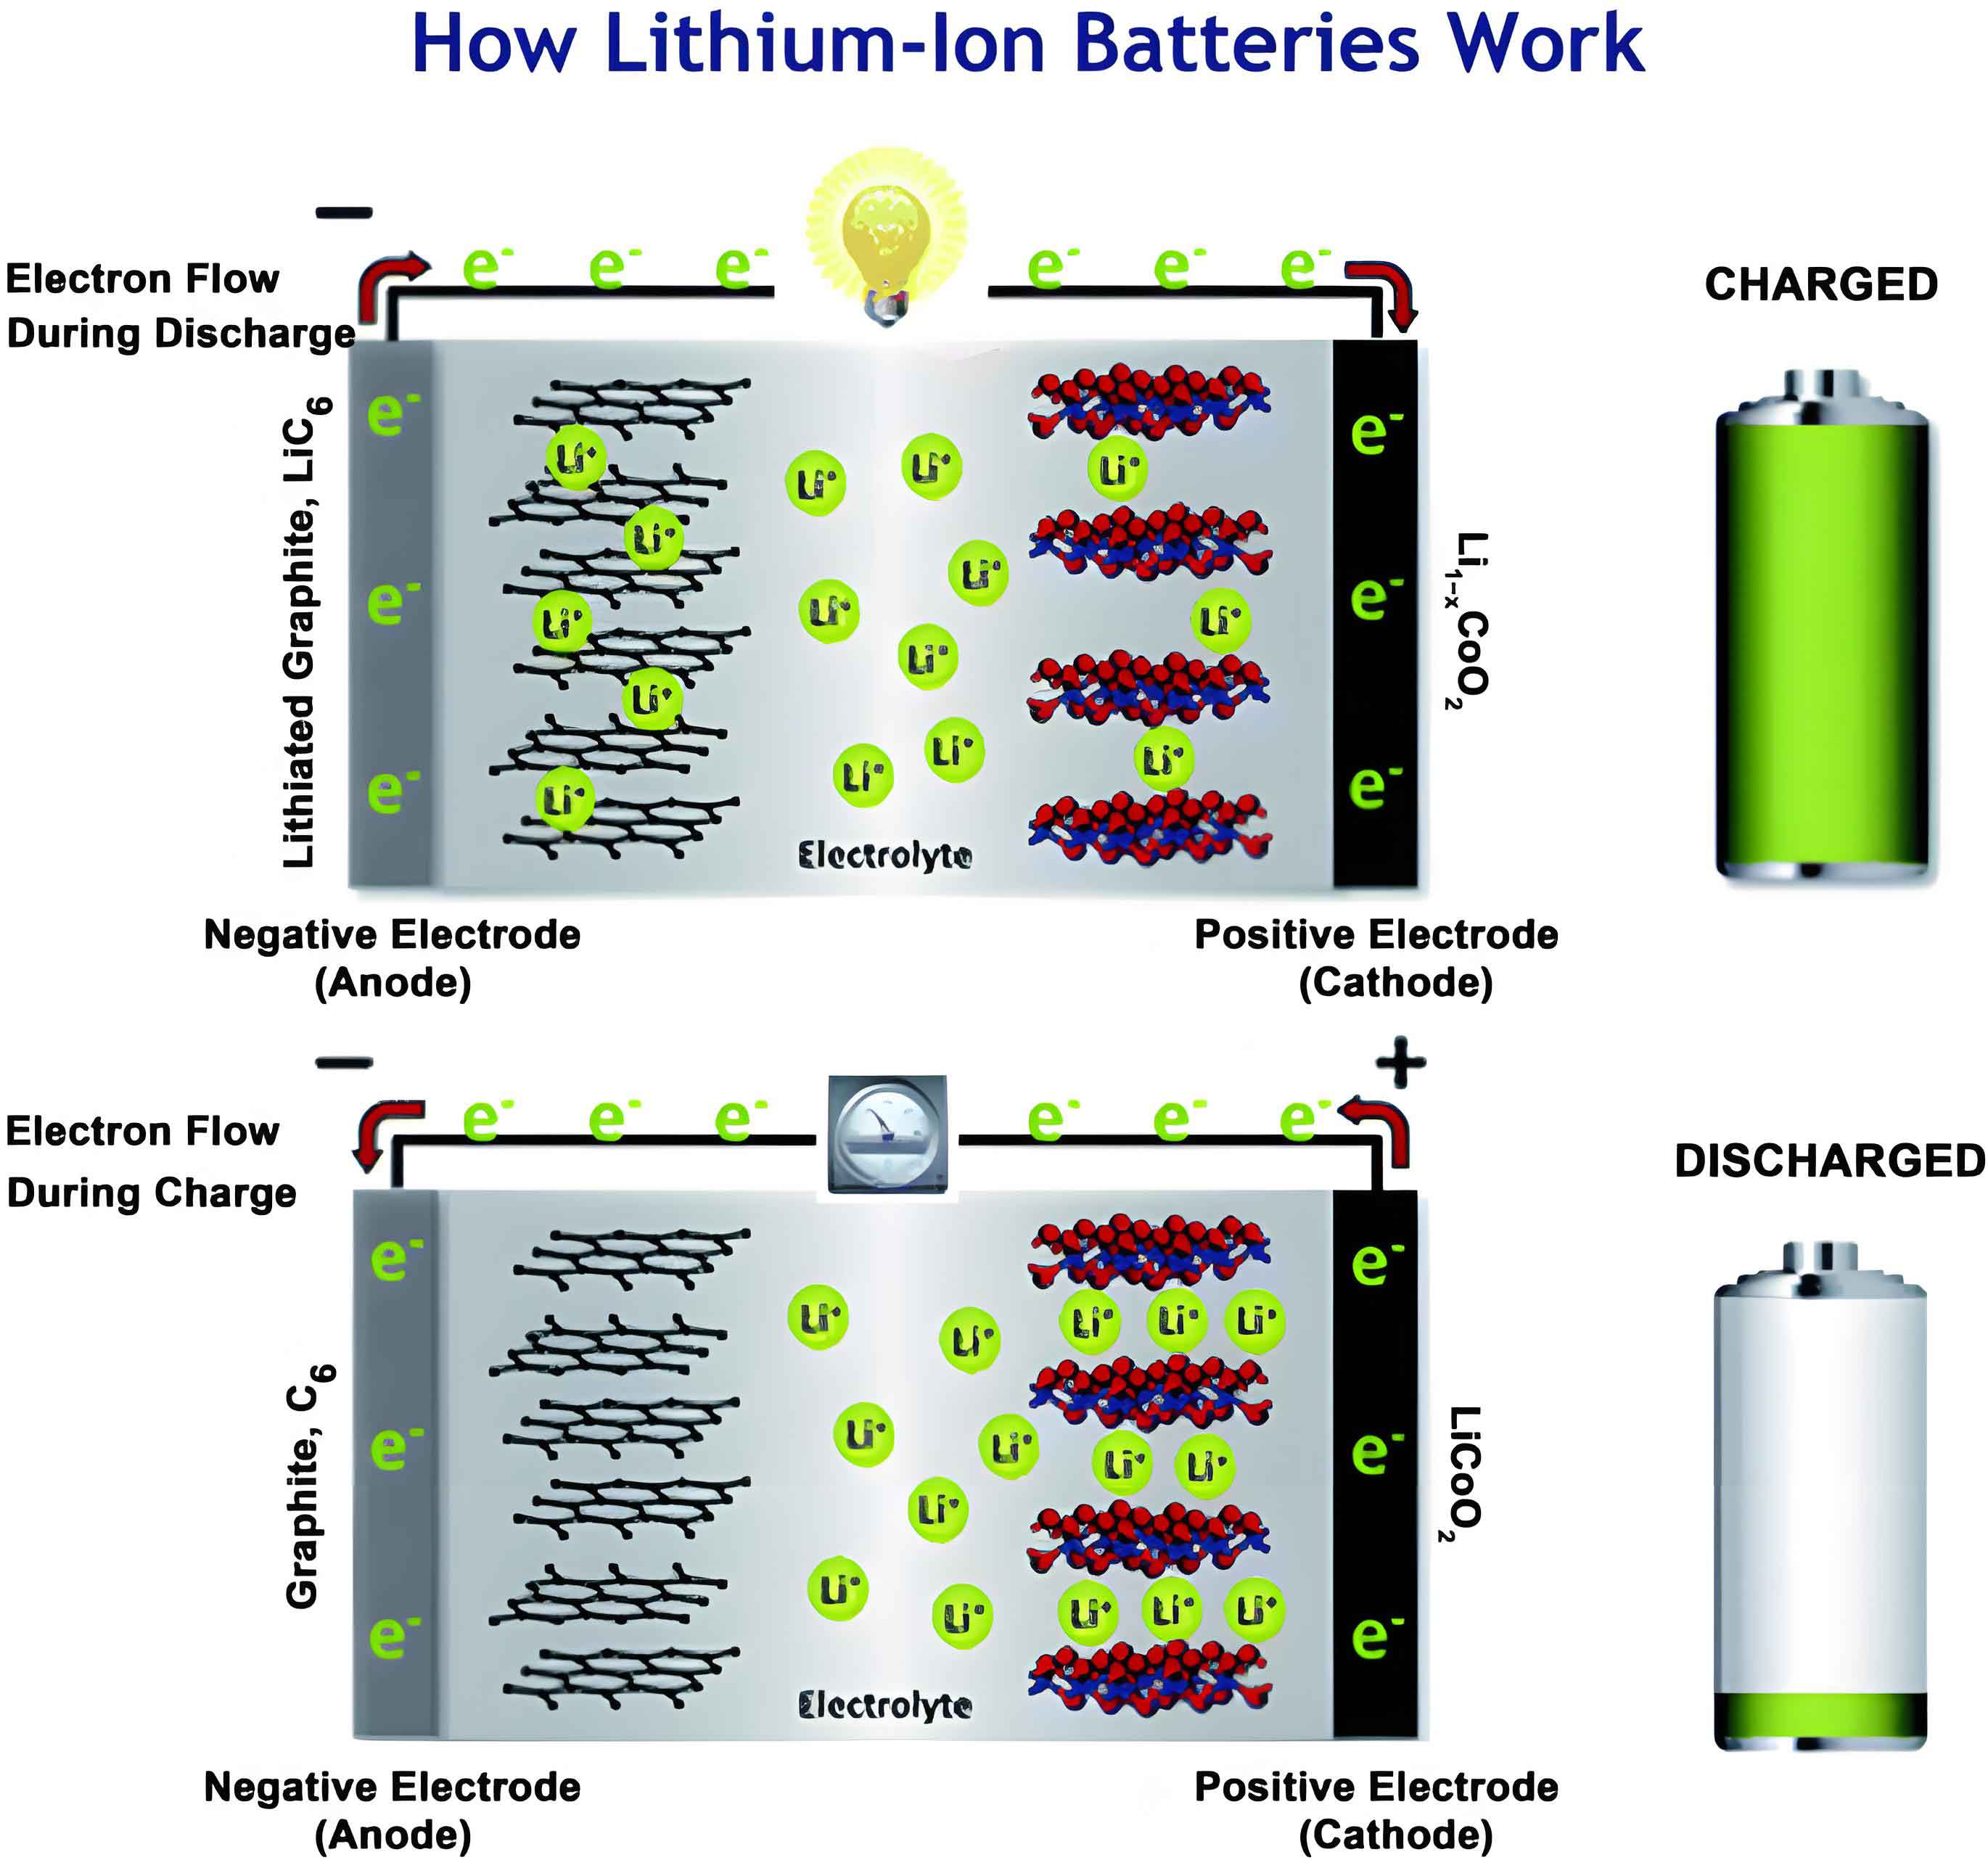
We begin by developing models for the key subsystems. For the li ion battery, we employ an equivalent circuit model that captures its dynamic voltage characteristics. The terminal voltage of a single cell, $U_B$, is expressed as a function of its open-circuit voltage, internal resistance, and polarization effects:
$$U_B = U_{OC} – U_P – I_B R_B$$
Here, $I_B$ is the load current and $R_B$ is the internal resistance. The open-circuit voltage $U_{OC}$ and the polarization voltage $U_P$ are nonlinear functions of the cell’s state of charge (SOC), defined as $\alpha_{soc} = 1 – Q_B / Q_{max}$, where $Q_B$ is the consumed capacity and $Q_{max}$ is the maximum capacity. Based on empirical characterization, these can be modeled as:
$$
\begin{aligned}
U_{OC} &= c_1 \ln(\alpha_{soc}) + e^{-c_2 \alpha_{soc}} + c_3 \alpha_{soc}^3 + c_4 \\
U_P &= \frac{K}{Q_{max}} (Q_B + I_B) (Q_{max} – Q_B) – A \exp(-B Q_B)
\end{aligned}
$$
The parameters $c_1$ through $c_4$, $K$, $A$, and $B$ are derived from experimental discharge data for a specific li ion battery chemistry, such as the common NCR18650. A battery pack is constructed from $N_S$ cells in series and $N_P$ such strings in parallel. The total pack output power is given by:
$$P_{BP} = N_S N_P U_B I_B$$
The dynamic nature is clear: as $Q_B$ increases (SOC decreases), $U_{OC}$ drops and the internal voltage drop $I_B R_B$ and polarization $U_P$ evolve, causing $U_B$ to fall for a given current $I_B$, or conversely, forcing $I_B$ to rise to maintain a required power $P_{BP}$.
| Parameter | Symbol | Value | Unit |
|---|---|---|---|
| Open-circuit voltage coefficient | $c_1$ | 0.581 | – |
| Open-circuit voltage coefficient | $c_2$ | 6.569 | – |
| Open-circuit voltage coefficient | $c_3$ | 0.109 | – |
| Open-circuit voltage coefficient | $c_4$ | 3.798 | – |
| Maximum Capacity | $Q_{max}$ | 3.3 | Ah |
| Exponential zone amplitude | $A$ | 0.086 | V |
| Exponential zone time constant inverse | $B$ | 56.302 | Ah$^{-1}$ |
| Polarization constant | $K$ | 0.010 | $\Omega$ |
| Internal Resistance | $R_B$ | 0.030 | $\Omega$ |
The electric motor, typically a high-efficiency permanent magnet synchronous motor, is modeled via its steady-state equivalent circuit. The governing equations relate voltage $U_M$, current $I_M$, speed $n$ (in RPM), and output torque $M_M$:
$$
\begin{aligned}
U_M &= \frac{n}{K_V} + I_M R_M \\
M_M &= K_T (I_M – I_{M0})
\end{aligned}
$$
where $K_V$ is the speed constant, $K_T$ is the torque constant, $R_M$ is the motor resistance, and $I_{M0}$ is the no-load current. The propeller performance is characterized by non-dimensional coefficients. The thrust $T_s$ and power consumed $P_{cons}$ for a propeller of diameter $D_R$ operating at speed $n$ in air of density $\rho$ are:
$$
\begin{aligned}
T_s &= \rho C_T n^2 D_R^4 \\
P_{cons} &= \rho C_P n^3 D_R^5
\end{aligned}
$$
The thrust coefficient $C_T$ and power coefficient $C_P$ are functions of the advance ratio $\lambda = v / (n D_R)$, where $v$ is the freestream velocity. The relationship $C_T(\lambda)$ can often be approximated by a quadratic fit for performance calculations: $C_T = c_{t1}\lambda^2 + c_{t2}\lambda + c_{t3}$. These component models form the foundation for our phase-by-phase performance analysis.
The performance analysis is segmented according to the flight phases of a tiltrotor eVTOL. In the multi-rotor mode (vertical takeoff, hover, vertical landing), the aircraft behaves like a helicopter. During vertical takeoff, the required thrust must overcome weight and aerodynamic drag. The maximum vertical climb rate $v_{VT,max}$ is determined by the maximum available thrust $T_{VT,max}$ from all rotors:
$$v_{VT,max} = \sqrt{ \frac{2(T_{VT,max} – mg)}{\rho S_{eq} C_{D,VT}} }$$
where $m$ is the aircraft mass, $S_{eq}$ is an equivalent drag area, and $C_{D,VT}$ is the drag coefficient in vertical flight. For each propeller operating at a speed $n_{VT,i}$, the consumed power $P_{con,VT,i}$ is calculated. This power demand is traced back through the motor model (Eq. 9-10) to determine the required motor currents and voltages, and finally to the li ion battery pack to solve for the instantaneous pack current $I_{BP,VT}$ using the dynamic voltage model. This process explicitly links propeller load to battery state.
Hover performance is often assessed using the Figure of Merit (FM), the ratio of ideal induced power to actual power consumed. However, more critically for endurance, the battery current in hover is not constant. As the li ion battery discharges, its voltage $U_B$ decreases. To maintain the precise propeller RPM needed to generate thrust equal to weight, the motor must draw more current to compensate for the lower voltage, as per the motor equation. Consequently, the battery pack current $I_{BP,Hov}$ increases over the duration of a hover, even if the aircraft remains stationary. This is a direct manifestation of the dynamic discharge characteristic. During vertical descent at low speeds, propellers can enter a vortex ring state, making momentum theory invalid. Empirical corrections are used to estimate the induced velocity $v_{VL,in}$ and the power consumed: $P_{con,VL,i} = (mg/N_R)(v_{VL,in} – v_{VL})$, which again is linked back to the battery through the powertrain models.
The transition mode involves tilting the propellers or wings while the aircraft accelerates or decelerates in level flight. This is a complex flight regime requiring simultaneous force and moment balance. For a given tilt strategy $\varepsilon(v)$ and airspeed $v_{Tr}$, the required thrust from each propeller $T_{Tr,i}$ to maintain level flight is found by solving the longitudinal equilibrium equations, which can be expressed in matrix form $\mathbf{Ax} = \mathbf{b}$. The propeller speed $n_{Tr,i}$ needed to produce this thrust is then solved from the quadratic relationship $C_T(\lambda)$:
$$n_{Tr,i} = \frac{-b_{n} – \sqrt{b_{n}^2 – 4a_{n}c_{n}}}{2a_{n}}$$
with $a_n = c_{t3}\rho D_{R,i}^4$, $b_n = c_{t2}\rho D_{R,i}^3 v_{Tr}$, and $c_n = c_{t1}\rho D_{R,i}^2 v_{Tr}^2 – T_{Tr,i}$. The power for each propeller follows, leading to the battery current demand $I_{BP,Tr}$.
In fixed-wing mode (climb, cruise, descent), the aircraft operates like a conventional airplane. The climb analysis is straightforward, but cruise performance requires careful treatment due to the li ion battery dynamics. Cruise range and endurance are not simple linear functions of initial energy because the efficiency of the powertrain changes as the battery voltage drops. We adopt a discrete analysis method. The cruise phase is divided into small segments based on increments of battery consumed capacity, $\Delta Q_B$. For each segment $j$ at airspeed $v_{Cr,j}$, the required thrust (equal to aircraft drag $D_{Fix,j}$) is distributed among the propellers. The corresponding propeller speed $n_{Cr,i,j}$ and power $P_{con,Cr,i,j}$ are computed. Using the motor and battery models with the current segment’s cumulative capacity $Q_{B,j}$, the required battery pack current $I_{BP,Cr,j}$ is determined. The total cruise time $t_{Cr}$ and range $R_{Cr}$ are then summed over all $N_{Q_B}$ segments:
$$
\begin{aligned}
t_{Cr} &= \sum_{j=1}^{N_{Q_B}} \frac{3600 N_S}{I_{BP,Cr,j}} \Delta Q_B \\
R_{Cr} &= \sum_{j=1}^{N_{Q_B}} \frac{3600 N_S v_{Cr,j}}{I_{BP,Cr,j}} \Delta Q_B
\end{aligned}
$$
This formulation shows that maximizing endurance requires minimizing $I_{BP,Cr,j}$ across segments, while maximizing range requires minimizing $I_{BP,Cr,j} / v_{Cr,j}$. The dynamic nature of the li ion battery causes $I_{BP,Cr,j}$ to increase from one segment to the next as $Q_B$ increases, even at constant airspeed and drag, thereby reducing the effective range and endurance per unit of remaining capacity.
To quantitatively analyze the impact, we consider an example tilt-wing eVTOL configuration with a mass of 2300 kg, six propellers, and a li ion battery pack comprising 229 series and 144 parallel groups of 3.3 Ah cells. Applying our performance method yields critical insights. First, the battery pack current required to maintain a constant power output increases significantly over time. For instance, during a simulated hover, the battery current increases by approximately 3.67% per minute. In cruise, the relative difference between the initial and final battery current can exceed 20% for a long-duration segment.
| Flight Phase | Duration (min) | Start Pack Current (A) | End Pack Current (A) | Relative Increase |
|---|---|---|---|---|
| Vertical Takeoff | 1.67 | 1465.1 | 1540.5 | 5.15% |
| Cruise | 85.17 | 196.6 | 236.4 | 20.27% |
| Hover | 0.50 | 1978.5 | 2014.7 | 1.83% |
| Vertical Descent | 1.67 | 1190.4 | 1251.0 | 5.09% |
Second, the maximum available power density of the li ion battery pack degrades with discharge. When the battery is required to deliver its maximum allowable current, the output power is $P_{max} = U_B(Q_B) \cdot I_{max}$. Since $U_B$ decreases with $Q_B$, $P_{max}$ also decreases. Our analysis shows that the average available power density during hover and vertical descent phases is only about 78% of that available at the beginning of the mission during vertical takeoff. This has a direct bearing on performance ceilings, such as maximum climb rate or hover capability in one-engine-inoperative scenarios later in a flight.
| Flight Phase | Average Power Density (W/kg) | Relative to Takeoff Phase |
|---|---|---|
| Vertical Takeoff | 737.1 | 100% |
| Transition | 726.7 | 98.6% |
| Climb | 722.6 | 98.0% |
| Cruise | 659.1 | 89.4% |
| Hover | 579.7 | 78.6% |
| Vertical Descent | 558.0 | 75.7% |
Third, the effective cruise efficiency diminishes. The incremental range and endurance achieved per unit of battery capacity consumed ($\Delta R / \Delta Q_B$, $\Delta t / \Delta Q_B$) are not constant. As the battery discharges into its lower state-of-charge regions, the increasing current for the same aerodynamic power reduces these increments. In our example, the incremental endurance and range at the end of the cruise segment were approximately 16% and 17% lower, respectively, than at the beginning. This non-linear relationship is crucial for accurate mission planning and reserve energy management.
Finally, the dynamic characteristic dictates a prudent operational limit for the li ion battery. Discharge curves typically show a rapid voltage drop after a “knee point,” often around 80-85% depth of discharge. Operating beyond this point not only stresses the cells but also leads to a drastic increase in current for power demand, potentially violating maximum current limits. Therefore, for a robust design, the cruise phase should be terminated, and sufficient reserve capacity allocated for transition, hover, landing, and contingencies, well before the battery reaches this knee point. Setting the cruise termination capacity at around 80% of the total capacity is a typical practice to ensure safe performance in later flight phases while maintaining acceptable range.
In conclusion, the dynamic discharge characteristics of the li ion battery are not a secondary effect but a primary driver in the performance assessment and operational planning of tiltrotor eVTOL aircraft. Our integrated modeling and analysis demonstrate that these dynamics lead to: (1) a time-increasing current demand to maintain constant power in all flight phases, (2) a significant reduction in available peak power density over the course of a mission, particularly critical for vertical flight, and (3) a non-linear degradation of cruise efficiency, where the useful range and endurance per unit of energy are higher at the start of cruise than at the end. These effects mandate that performance predictions for eVTOLs must move beyond simple constant-efficiency or constant-voltage assumptions. Accurate models of the li ion battery dynamics, coupled with detailed powertrain and aerodynamic models, are essential for credible mission analysis, sizing of battery packs, establishing realistic performance guarantees, and ensuring safe operational procedures. As the UAM industry progresses, acknowledging and designing for these inherent characteristics of lithium-ion energy storage will be fundamental to achieving reliable and predictable aircraft performance.