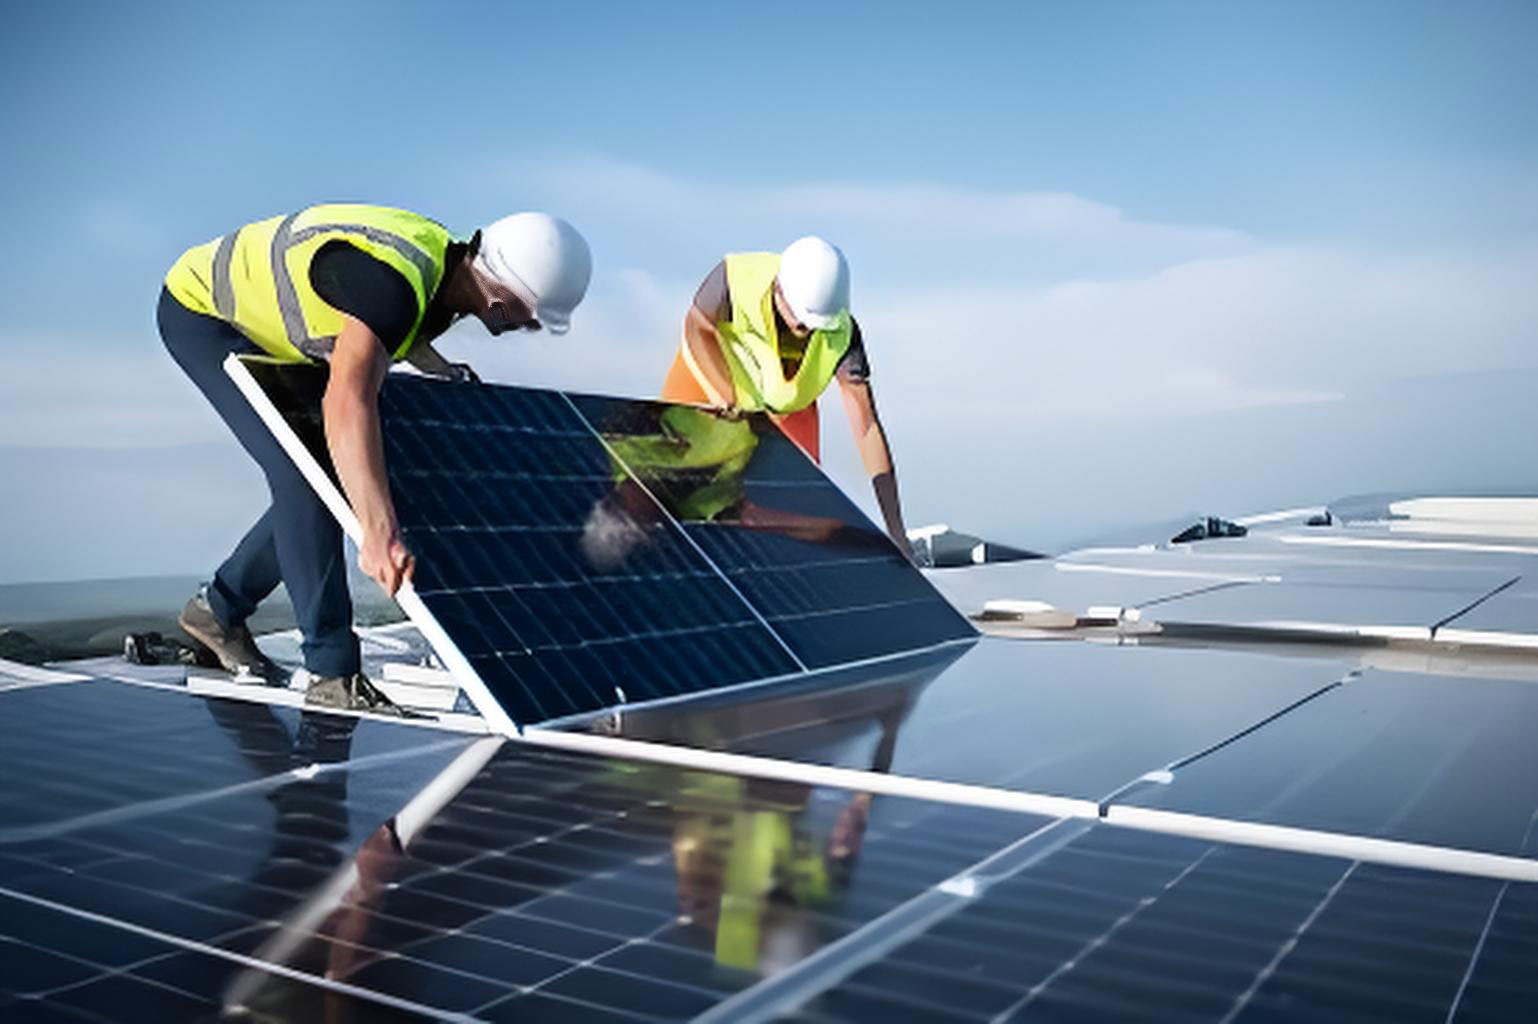
As global solar energy adoption accelerates, the industry faces an impending challenge: managing end-of-life solar panels. By 2040, cumulative solar panel waste is projected to reach 253 GW (approximately 200 million metric tons), creating both environmental risks and economic opportunities. This article explores the technical, economic, and policy dimensions of solar panel recycling, emphasizing innovations, barriers, and scalable solutions.

1. The Scale of Solar Panel Waste
Solar panels typically operate for 25–30 years before efficiency declines necessitate replacement. China’s photovoltaic (PV) market alone anticipates 18 GW (140,000 metric tons) of retired panels by 2030. Table 1 summarizes global projections:
| Year | Retired Capacity (GW) | Waste Mass (Million Metric Tons) |
|---|---|---|
| 2025 | 8 | 0.6 |
| 2030 | 18 | 1.4 |
| 2040 | 253 | 20.0 |
The recycling market is projected to exceed $150 billion by 2040, driven by material recovery value:
- **Silicon (Si):** 85–95% purity achievable via advanced separation.
- **Silver (Ag):** 98% recovery rate using hydrometallurgical processes.
- **Glass:** 100% reusable in construction or new panels.
2. Technical Challenges in Solar Panel Recycling
Solar panels comprise layered materials (Figure 1):
- **Tempered glass (75% by weight)**
- **EVA (ethylene-vinyl acetate) encapsulant (10%)**
- **Silicon cells (5%)**
- **Aluminum frame (8%)**
- **Backsheet (2%, often fluoropolymer-based)**
2.1 Separation Techniques
Current methods face trade-offs between efficiency and environmental impact:
| Method | Process Description | Recovery Rate | Limitations |
|---|---|---|---|
| Mechanical | Crushing, sieving | 60–70% | Low purity; mixed waste |
| Thermal | Pyrolysis (400–600°C) to burn EVA | 85–90% | Toxic fumes (HF, NOx) |
| Chemical | Solvent dissolution (e.g., HNO₃, NaOH) | >95% | High cost; wastewater issues |
A hybrid approach combining thermal and chemical treatments maximizes yield:Total Recovery Efficiency=ηthermal×ηchemical−Eloss
Where ηthermal = 0.9, ηchemical = 0.95, and Eloss = 5% (energy loss).
3. Economic Barriers and Illicit Practices
Recycling profitability hinges on scale and logistics. For a 500-panel batch:Net Profit=∑(Recycled Material Value)−(Transportation+Processing Costs)
- **Transportation:** 20–50/panel for cross-region shipments.
- **Processing:** 10–30/panel (thermal-chemical hybrid).
Small-scale “backyard recyclers” undercut formal operators by avoiding environmental compliance costs, recovering only high-value metals (e.g., Ag, Cu) and dumping toxic residues. This illicit market captures ~40% of retired solar panels in Asia.
4. Policy Frameworks and Industry Initiatives
China’s 2023 Guidelines for Retired Wind and Solar Equipment Recycling mandate:
- **Extended Producer Responsibility (EPR):** Manufacturers fund collection/recycling.
- **Regional Recycling Hubs:** State Grid Corporation plans 15 pilot facilities by 2026.
Corporate innovations include:
- **JinkoSolar’s Circular Supply Chain:** Integrated recycling with 92% material reuse.
- **SPIC’s Zero-Waste Process:** Achieves 99% Si recovery via laser ablation and electrostatic separation.
5. Future Pathways for Solar Panel Recycling
5.1 Design for Recycling (DfR)
Next-gen panels prioritize modularity and material simplicity:
- **Adhesive-Free Encapsulation:** Ultrasonic welding replaces EVA.
- **Standardized Frames:** Bolt-on aluminum for easy disassembly.
5.2 Digital Tracking Systems
Blockchain-enabled lifecycle management ensures traceability:Panel ID→Manufacturer DB→Recycler API
Pilot programs in the EU (PV CYCLE) have boosted recovery rates by 34%.
6. Conclusion
Solar panel recycling is transitioning from a niche service to a cornerstone of circular economy strategies. With technological refinement, policy enforcement, and cross-sector collaboration, the industry can convert 200 million metric tons of future waste into $220 billion in recoverable materials by 2050. The path forward demands urgency: every delayed action exacerbates environmental liabilities and forfeits economic value.
