
With the increasing installation of renewable energy, energy storage systems are receiving high attention from countries around the world. Due to the uncertainty and randomness of the power generation of new energy sources such as photovoltaic and wind power, a high proportion of new energy power systems may have issues such as frequency fluctuations and voltage fluctuations. As a transfer station between power generation supply and load demand, the energy storage system can be funded by the State Grid Sichuan Electric Power Company Technology Project (B3199722000L) to improve the reliability and stability of the system.
There are currently various types of energy storage systems available to support the power system. For example, large-scale energy storage facilities such as pumped storage and compressed air energy storage, as well as electrochemical energy storage facilities such as lithium-ion batteries, sodium sulfur batteries, and all vanadium flow batteries. With the improvement of lithium-ion battery performance and the reduction of cost, lithium-ion batteries, especially lithium iron phosphate batteries, have become the most commonly used batteries at present.
The investment cost of energy storage systems is still high, so it is crucial to accurately evaluate their profitability and optimize operational strategies during planning and operation.We have conducted research on the capacity configuration of photovoltaic and battery energy storage systems (BESS) in smart homes, and established a home energy management system based on optimization algorithms, which can provide configuration reference for users under different electricity pricing mechanisms. A comprehensive value evaluation method for energy storage systems providing multiple services has been proposed, including energy arbitrage, frequency regulation, and reliability improvement. A model and algorithm for user response behavior under time of use pricing were studied. A user side energy storage optimization configuration method considering demand management has been proposed. A multi-objective optimization operation method for distributed energy storage considering user demand response under time-of-use electricity prices was studied.
The life decay process of different storage technologies varies. For example, the capacity of physical energy storage systems such as pumped storage and compressed air storage may slowly decay with mechanical wear. The cycle life of lithium-ion batteries is closely related to the number of cycles, discharge depth, and other factors. The lifespan of all vanadium flow batteries is also related to their operating conditions, but deep cycling does not significantly deteriorate the health status of all vanadium flow batteries as it affects lithium-ion batteries. The process of capacity decay is a key topic in battery related research. The basic factors affecting the attenuation of lithium-ion batteries have been refined, including internal aging mechanisms and influencing factors. A semi empirical model for estimating battery life loss has been proposed. An optimal bidding strategy for BESS considering battery cycle life in the electricity market has been proposed. Discussed the economic impact of battery attenuation on energy storage systems that provide multi scenario applications, and proposed an economic attenuation model to comprehensively quantify the impact of operational strategies. Sorted out the modeling methods for efficiency and life decay of large-scale electrochemical energy storage operation on the power grid side.
The profitability of energy storage systems is closely related to their application scenarios and operational status. Peak valley arbitrage is one of the most common applications of energy storage systems, and its profitability may vary greatly under different pricing mechanisms. Therefore, when evaluating the economy of energy storage projects, a comprehensive technical and economic evaluation framework that considers specific operational strategies and electricity pricing mechanisms is needed. Based on the above research status, firstly, the operating models of different electricity pricing mechanisms and battery attenuation models are summarized; Then, economic analysis indicators and methods for battery energy storage systems under different electricity pricing mechanisms were proposed; Finally, based on actual electricity price data, the economy of battery energy storage systems was analyzed.
1.Energy storage system model
The arbitrage profit that energy storage systems can achieve is closely related to the difference in charging and discharging prices. Energy storage system operators need to optimize their charging and discharging strategies and determine when to charge and discharge batteries to maximize profits. The following introduces the operation modes of energy storage power plants under different electricity pricing mechanisms, including fixed rate, time of use price, and real-time price modes, as well as the operating constraints and life decay models of energy storage systems.
1.1 Fixed Rate
Consumers in the fixed rate mode pay electricity bills at a fixed rate per kilowatt hour within a specified period. This payment method can protect users from the impact of rising energy prices. However, the energy storage system cannot bring profits to users in this way, and due to the energy loss during the power conversion process, it will actually increase users’ electricity bills. In this way, the benefits of installing energy storage systems by users are mainly reflected in improving the reliability or quality of their electricity consumption.
1.2 Time of use electricity price
The implementation of time of use (TOU) electricity pricing mechanism can encourage people to transfer some electricity loads from peak to off peak periods. Under this electricity pricing mechanism, consumers pay different rates during low, flat, peak, and peak periods. Typically, consumers pay lower fees during low periods than standard fixed rates, while paying higher fees during peak and peak periods. If consumers can reduce their electricity consumption during peak and peak periods, or they can use the energy stored in the energy storage system during these times, it can reduce electricity bills and save expenses.
The energy storage operation strategy under the time-of-use electricity price mechanism is simple and clear, that is, charging during low or flat periods, and discharging during peak or peak periods. The profit generated or electricity saved by the energy storage system in a day can be expressed as:
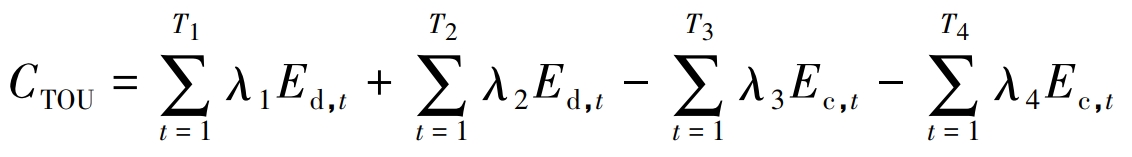
In the equation: λ 1 λ 2 λ 3 and λ 4 refers to the electricity prices during peak, peak, flat, and low periods; T1, T2, T3, and T4 represent the total hours during peak, peak, flat, and low periods, respectively; Ed, t and Ec, t are the discharge and charging levels at time t.
1.3 Real time electricity price
Real time pricing (RTP) can reflect the supply-demand relationship of electricity, and in regions where real-time pricing is used, the electricity price will change in a short time interval, such as 1 hour. The electricity fees paid by users vary depending on the real-time electricity prices settled by the electricity selling company or other agency in the wholesale market. When the demand for electricity is high, the electricity price is also relatively high. As peak power plants must generate electricity to meet the demand, the operating cost of such power plants is often higher than the operating cost of providing basic load power plants.
Users usually receive a quote one day in advance or within a shorter period of time. Users of energy storage systems can optimize battery operation by predicting electricity prices, thereby charging batteries at relatively low prices and discharging them at higher prices. The profit of energy storage batteries under real-time electricity pricing mechanism for one day is:
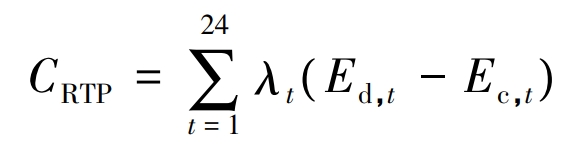
In the equation, λ T is the electricity price at time t under the real-time electricity pricing mechanism.
1.4 Operational constraints
The state of charge (SOC) of a battery is an important indicator for monitoring battery operation. It represents the ratio of the remaining capacity of the battery to the rated capacity Er, which depends on the previous capacity and current operating status of the battery. The state of charge St at time t is represented by equations (3) – (6).
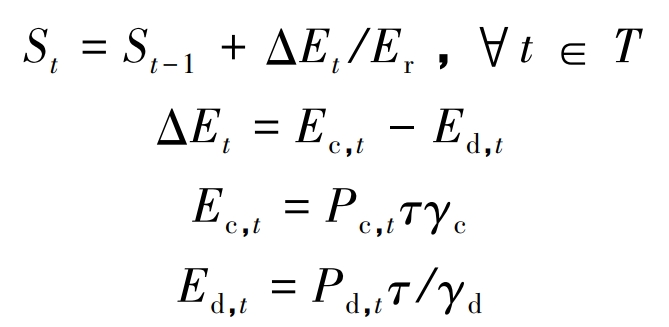
In the equation: γ C and γ D represents the charging and discharging efficiency of the battery; Pc, t and Pd, t are the charging and discharging power, respectively; τ Is the time interval. The operation of a battery is constrained by its energy storage capacity, charging power, and discharge power limitations, which are represented by equations (7) – (10).
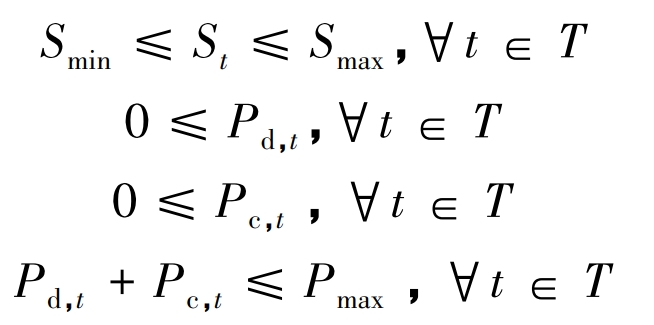
In the formula, Smin and Smax are the minimum and maximum values of SOC, which may vary depending on storage technology and operational strategies; Pmax is the maximum charging and discharging power, determined by the limitations of the power conversion system.
1.5 Battery attenuation model
The proposed battery attenuation model is used here. This model considers the effects of cycle times, depth of discharge (DOD), and average SOC of cycles on battery life. The model is shown in equations (11) – (18).
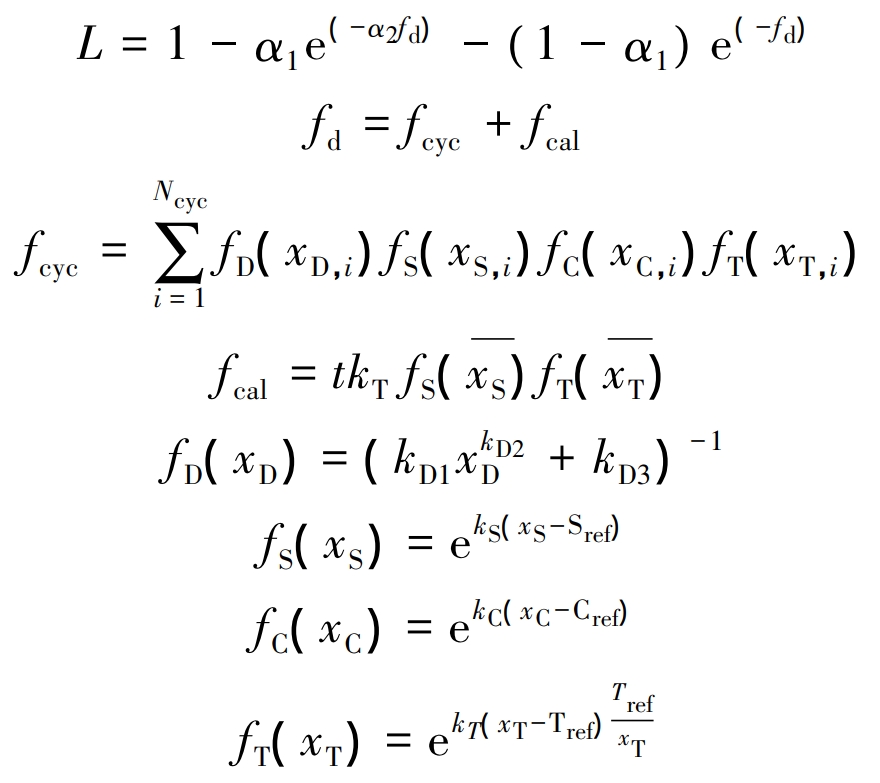
In the formula, fD (xD), fS (xS), fC (xC), and fT (xT) represent the relationship between battery attenuation and DOD, SOC, charge discharge rate, and temperature, respectively; Ncyc is the number of cycles; KD1, kD2, kD3, kS, kC, and kT are the coefficients of the corresponding pressure model; Sref, Cref, and Tref are reference values in the pressure model.
2.Economic analysis
This chapter describes the economic analysis model and related indicators of energy storage systems, including capital cost, operation and maintenance cost, standardized energy storage cost, investment payback period, net present value, etc.
2.1 Capital cost
The cost of funds includes fixed expenses incurred during the procurement, installation, and delivery process of the energy storage system, mainly including the costs of batteries, power conversion system (PCS), and balance of system (BOS). The calculation formula is:
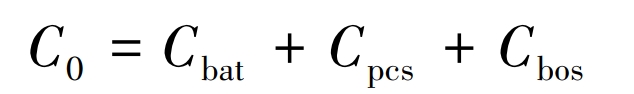
In the formula, Cbat, Cpcs, and Cbos are the unit costs of the battery, power conversion system, and balance system, respectively. Cbat is determined by the unit price per kilowatt hour of the battery; The price of power electronic devices, including battery systems that convert electricity from DC/AC to AC/DC, is related to the price per kilowatt; Cbos generally includes expenses incurred for electrical balance systems, structural balance systems, etc.
2.2 Operation and maintenance costs
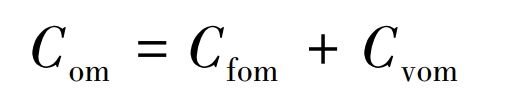
The operation and maintenance costs of battery energy storage systems include equipment status monitoring, fault detection and cleaning, component replacement, etc. The annual operation and maintenance cost Com can be calculated as the sum of fixed operation and maintenance cost Cfom and variable operation and maintenance cost Cvom, or expressed as a percentage of capital cost.
2.3 Levelized energy storage cost
Levelized cost of storage (LCOS) can be defined as the total cost of the entire lifecycle divided by the total energy or power provided at the end of the lifecycle, i.e.:
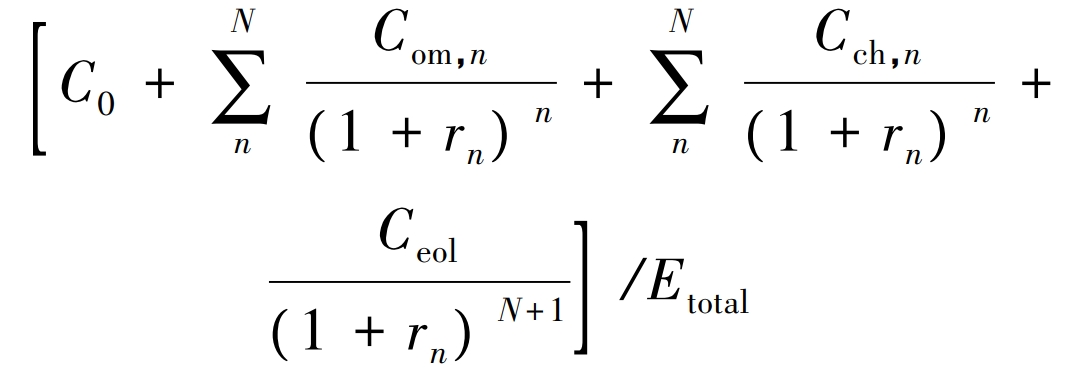
In the formula: Com, n is the operation and maintenance cost for the nth year; Cch, n is the charging cost for the nth year; Ceol is the cost of scrapping; Rn is the discount rate for the nth year; Etotal is the energy throughput throughout the entire lifecycle.
The charging cost was not taken into account when calculating LCOS here, as charging costs may vary under different pricing mechanisms. Therefore, the levelized energy storage cost CLCOS is:
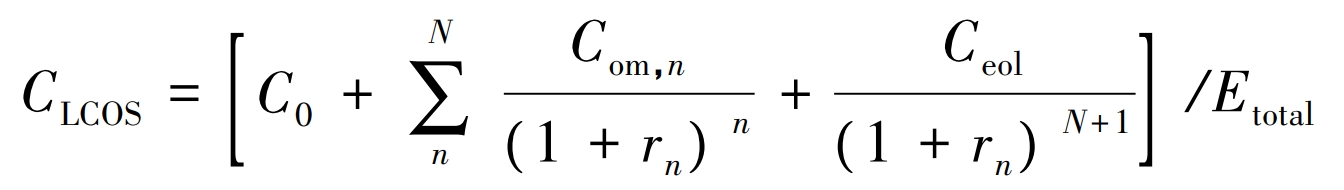
The defined LCOS can be used to calculate the minimum charge discharge price difference that can generate profits, which is divided by LCOS by round-trip efficiency.
2.4 Investment payback period
The investment payback period represents the time required to recover investment costs, expressed as:
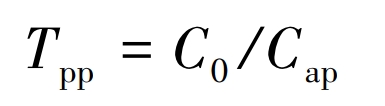
In the formula, Cap is the annual investment return. The discounted payback period is another indicator for measuring investments, which can take into account the time value of money.
2.5 Net Present Value
Net present value (NPV) is a commonly used evaluation indicator that considers the time value of money and converts future cash flows into today’s monetary value. It provides a useful measure for the potential profitability of a project. The net present value (VNPV) of energy storage projects is:
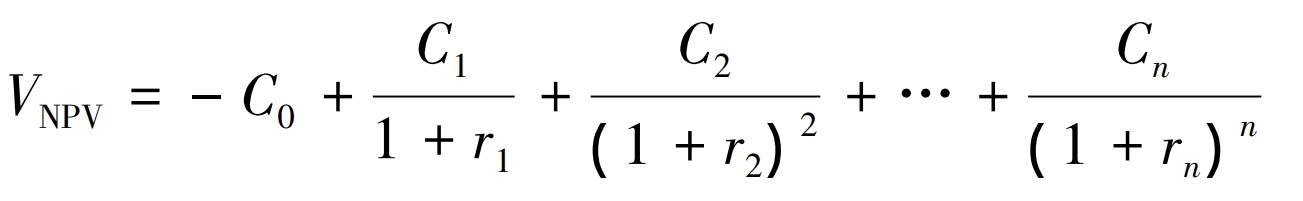
In the formula, Cn is the net cash flow, which can be calculated by subtracting the operating costs from the annual income obtained.
3.Example analysis
3.1 Electricity Price
Use two sets of hourly electricity price data and one set of real-time electricity price data for case study. Table 1 lists the electricity rates that small businesses are required to pay for each time period under a time of use electricity price contract signed with ConEdison in the United States. Under this contract, the peak hours are from 8:00 am to 10:00 am from Monday to Friday, and all other hours are considered non peak hours. Table 2 lists the time of use electricity price rates for commercial users of 100 kVA and above in Jiangsu Province, China in 2020.
For battery energy storage systems participating in spot trading in the electricity market, the maximum revenue can be estimated using the historical nodal marginal price (LMP). Here, historical data from the PJM region of the United States is used to evaluate the arbitrage situation of energy storage systems under real-time electricity pricing mechanisms.
3.2 Site selection and capacity determination
| Time period | Electricity price/(USD · (kWh) ^-1) |
| Peak hours (summer) | 0.348 4 |
| Peak hours (excluding summer) | 0.171 6 |
| Low point period (throughout the year) | 0.012 8 |
When planning the capacity of energy storage systems, both capacity and power requirements should be analyzed simultaneously. The capacity of the energy storage system is limited by conditions such as the carrying capacity of the substation, customer needs, capital scale, and floor area. According to recent predictions from the National Renewable Energy Laboratory in the United States and quotes from battery manufacturers, the capital cost is approximately $300/kWh, and the operation and maintenance cost is approximately 2.5% of the capital cost.
| Time period | Electricity price/(USD · (kWh) ^-1) |
| Peak hours (8:00-12:00, 17:00-21:00) | 0.161 |
| Flat section (12:00-17:00, 21:00-24:00) | 0.096 |
| Low valley period (0:00-8:00) | 0.044 |
In the example, the battery energy storage system is installed on the commercial user side, and the primary purpose of installation is to save electricity costs. In examples 1-3, the SOC of the battery is limited to a range of 10% to 90%. The parameters of the example system and the benefits of each case under different electricity pricing mechanisms are shown in Table 3. According to the analysis of returns, the returns that investors receive from the spot market are much lower than those under the time of use electricity price contract. The main reason is that under the time of use electricity price mechanism, if the peak valley electricity price difference is large enough, the energy storage system can continuously and stably obtain significant arbitrage profits; Under the real-time electricity pricing mechanism, based on the market supply and demand balance and clearance mechanism, the intraday price difference is mostly lower than the price difference under the compared time of use electricity pricing contract, resulting in a lower daily average peak valley price difference and poor profitability in the spot market. However, different electricity markets and regions may have different fluctuations in electricity prices, so in some regions, the arbitrage benefits obtained by energy storage systems from the spot market may be higher than those under the time of use electricity price mechanism. The number of cycles per day is also an important factor affecting revenue, and different battery types also have different revenue situations. In this example, attenuation data of lithium manganese oxide batteries are used for analysis, and other types of batteries may have longer cycle life and better economic returns.
| Parameters | Example 1 | Example 2 | Example 3 |
| System power/MW | 1 | 1 | 1 |
| System capacity/MWh | 1 | 2 | 4 |
| Charge discharge rate | 1 | 0.5 | 0.25 |
| Capital Cost/USD | 300 000 | 570 000 | 1 110 000 |
| Operation and maintenance cost/(USD · a ^ -1) | 7 500 | 15 000 | 30 000 |
| ConEdison Revenue/USD | 547 796 | 1 108 887 | 2 230 769 |
| Time of use electricity price mechanism (Jiangsu Province) revenue/USD | 310 506 | 628 548 | 1 264 462 |
| Real time electricity price revenue/USD | 58 954 | 171 508 | 258 659 |
3.3 Energy storage system operation strategy
Unlike traditional generators, the lifespan degradation of batteries is closely related to their operating conditions. This example compares the lifespan and energy throughput under different operating strategies by adjusting the maximum and minimum SOC constraints, as shown in Table 4.
| Strategy | SOC constraint/% | Time of use electricity price mechanism lifespan/a | Time of use electricity price mechanism energy throughput/MWh | Time of use electricity price mechanism: SOH/% after 1 year | Real time electricity pricing mechanism lifespan/a | Real time electricity pricing mechanism energy throughput/MWh | Real time electricity pricing mechanism SOH/% after 1 year |
| Strategy 1 | 0-80 | 10 | 2 920.0 | 98.0 | 6 | 5 002.8 | 96.4 |
| Strategy 2 | 5-85 | 10 | 2 902.1 | 98.0 | 5 | 4 794.9 | 96.0 |
| Strategy 3 | 10-90 | 10 | 2 850.0 | 97.9 | 5 | 3 995.4 | 95.9 |
| Strategy 4 | 15-95 | 10 | 2 709.5 | 97.8 | 5 | 3 789.2 | 95.7 |
| Strategy 5 | 20-80 | 10 | 2 190.0 | 98.1 | 7 | 4 359.6 | 97.0 |
By comparing the lifespan of strategies 1-4 with the state of health (SOH) after the first year, it can be seen that the smaller the SOC operating value, the slower the decay. However, it is worth noting that the lower the SOC, the lower the backup energy that can be released from the battery, and the lower the reliability value that can be provided. By comparing the results of Strategy 1 and Strategy 5, it can be seen that the smaller the SOC operating range, i.e. the smaller the DOD, the longer the lifespan. But the total energy throughput may be smaller, which will lead to a decrease in profits. Therefore, when formulating battery operation strategies, users need to comprehensively consider relevant constraints and operational objectives.
3.4 Economic Analysis
According to the above analysis, the energy storage returns in the PJM market in the United States are much smaller than the initial investment, meaning that only participating in the spot market for energy storage is not enough to recover investment costs. Therefore, further analysis will be conducted on the economic performance of energy storage systems under the mechanisms of ConEdison and Jiangsu Province’s time of use electricity pricing. Assuming a 1 MW/1 MWh battery energy storage system is charged and discharged once a day, with SOC limited to a range of 10% to 90%, after calculation and analysis, it can be concluded that the LCOS of this project is 0.1229 USD/kWh. The investment payback period and discount payback period of ConEdison clients are 6.3 years and 9.1 years, respectively. The payback period for investors in Jiangsu Province will be longer than the lifespan of the battery system, and investors should also seek other application scenarios to earn profits. Table 5 presents the analysis results. It should be noted that real-time electricity pricing policies in various regions may change, and investors should estimate profits based on the latest policies.
| Index | Valve |
| Capital Cost/USD | 300 000 |
| Operation and maintenance cost/(USD · a ^ -1) | 7 500 |
| Discount rate/% | 8 |
| Energy throughput/MWh | 2 850 |
| Levelized energy storage cost/(USD · (kWh) ^ -1) | 0.122 9 |
| Lifetime/a | 10 |
| Total revenue/USD | 547 796 |
| Investment payback period/a | 6.3 |
| Discount payback period/a | 9.1 |
| Project Net Present Value/USD | 19 398 |
4.Conclusion
A technical and economic analysis model for battery energy storage systems considering battery life decay is proposed above. This model can be used to study the energy throughput, standardized energy storage costs, and project profitability of battery energy storage systems under different electricity pricing mechanisms and operating strategies. An example analysis based on actual electricity prices and cost data shows that:
1) The arbitrage space under the real-time electricity price mechanism may be lower than that under the time of use electricity price mechanism, even if the daily peak valley electricity price difference in the spot market is much higher than the electricity price difference under the time of use electricity price mechanism. However, due to the insufficient duration of the high electricity price difference, it will not be enough to generate sufficient profits.
2) For systems with the same power, the higher the capacity, the slower the attenuation rate. And for the type of lithium-ion battery studied, the lower the limit values of maximum and minimum state of charge, the longer the lifespan. This study can provide reference for the planning and operation of battery energy storage systems.