
In the context of advancing engineering education and fostering student innovation, I have designed and implemented a real-time parameter measurement teaching experiment platform for the solar system based on photovoltaic (PV) panels. This initiative stems from practical teaching needs, aiming to address the limitations of conventional measurement instruments used in experimental settings, which are often single-function devices incapable of automated data logging and precise trend visualization. My platform integrates pedagogical research, scientific exploration, and hands-on experimentation into a cohesive unit, offering a cost-effective, highly adaptable, and user-friendly tool. It serves dual purposes: as a dedicated teaching apparatus for instructors to elucidate the characteristics of a solar system and deepen students’ understanding of solar energy utilization, and as a functional prototype for commercial PV panel testing, presenting significant potential for adoption in university laboratories and the photovoltaic industry.
The core objective of this platform is to measure the real-time operational parameters of a solar photovoltaic panel under simulated or real illumination. The key parameters of interest include output voltage ($V_{pv}$), output current ($I_{pv}$), and consequently, the generated electrical power ($P_{pv}$) and conversion efficiency ($\eta_{pv}$). The instantaneous electrical power is calculated as:
$$P_{pv}(t) = V_{pv}(t) \times I_{pv}(t)$$
The photovoltaic conversion efficiency is a critical figure of merit, defined as the ratio of the electrical power output to the incident solar power ($P_{in}$) on the panel’s surface area ($A$). If the irradiance is $G$ (in W/m²), then $P_{in} = G \times A$. Thus, the efficiency is given by:
$$\eta_{pv}(t) = \frac{P_{pv}(t)}{P_{in}(t)} \times 100\% = \frac{V_{pv}(t) \times I_{pv}(t)}{G(t) \times A} \times 100\%$$
A primary challenge in educational settings is tracking how these parameters, especially $\eta_{pv}$, change with factors like irradiance, temperature, and load. My platform solves this by automating the measurement and logging process.
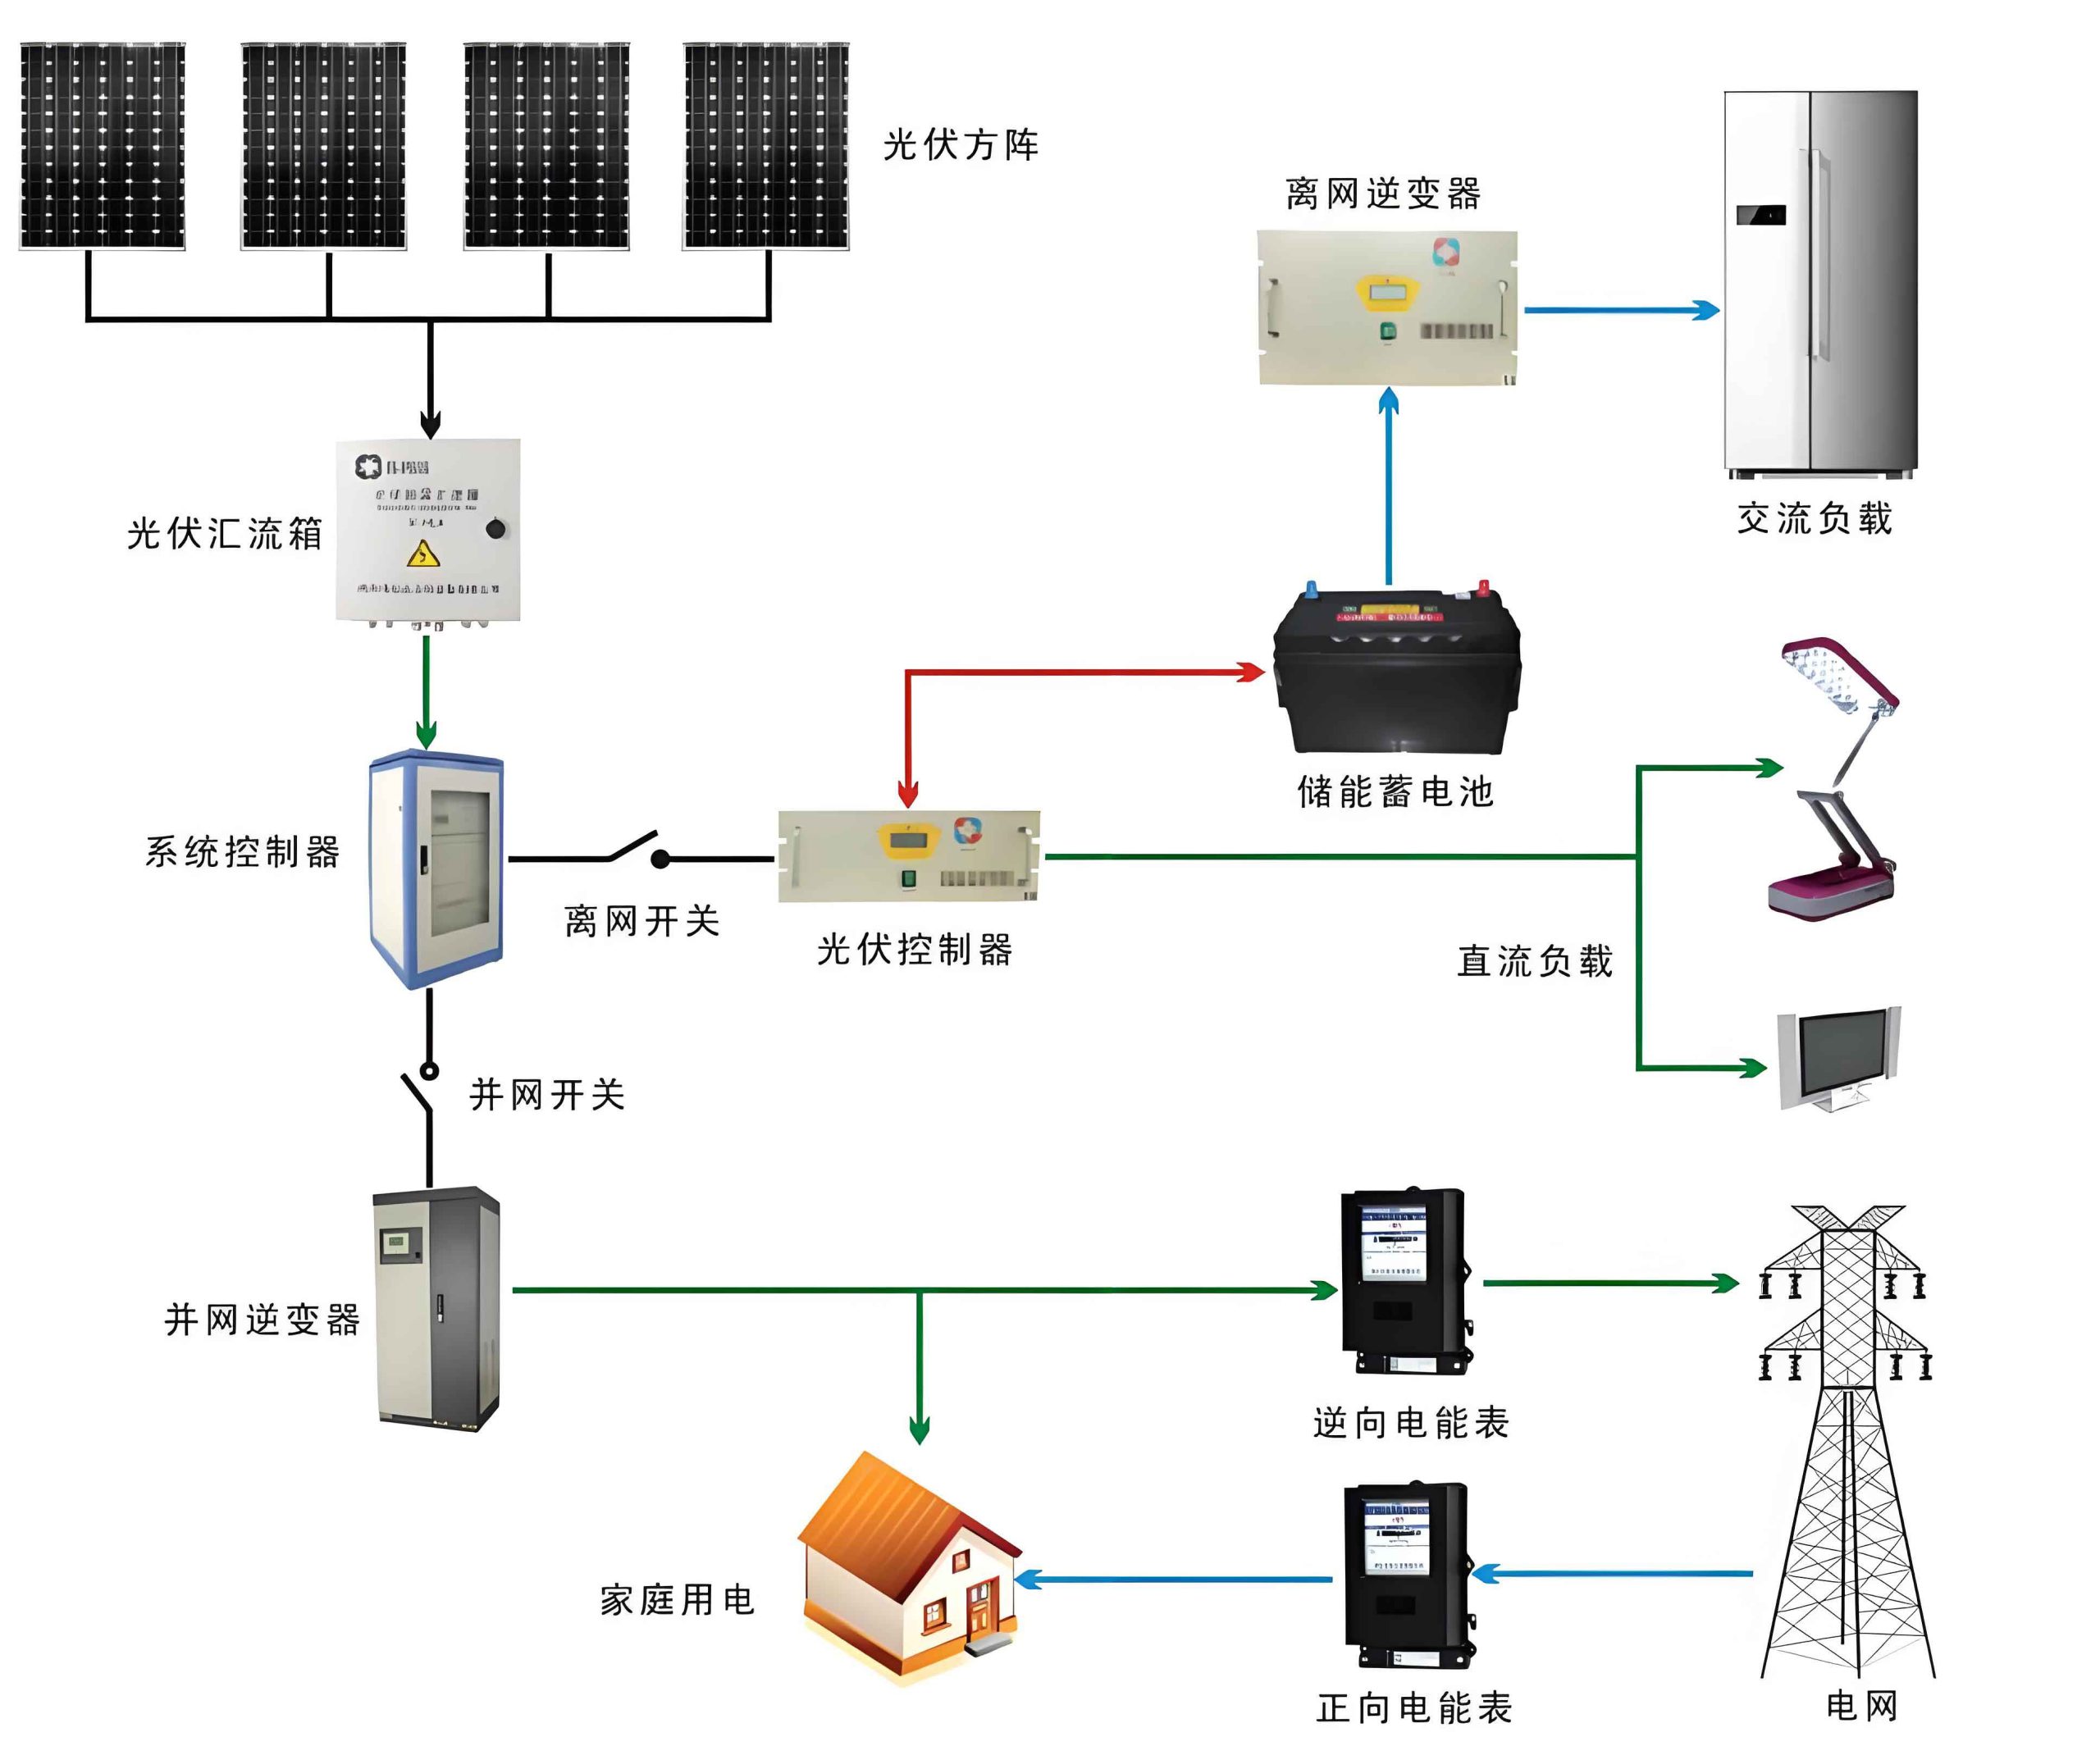
The system architecture is modular and built around a Programmable Logic Controller (PLC), which acts as the central data acquisition and control unit. The major components are:
- Solar Photovoltaic Panel: A standard 10W monocrystalline silicon panel serves as the device under test (DUT) in the solar system.
- Light Source: A 500W halogen tungsten lamp simulates solar irradiance, providing a broad-spectrum light suitable for basic experiments.
- Signal Conditioning: Current and Voltage Input Isolators (Transmitters) are crucial. They safely isolate the raw DC signals from the PV panel, convert them into standardized analog signals (e.g., 4-20 mA or 0-10 V), and transmit these to the PLC’s analog input module. This protects the sensitive PLC circuitry.
- Programmable Logic Controller (PLC): The brain of the platform. It reads the standardized analog signals via its Analog-to-Digital Converter (ADC) modules.
- Load Bank: A variable resistive load is connected to the PV panel output, allowing students to simulate different operating points and trace the Current-Voltage (I-V) characteristic curve of the solar system.
- Software & Computer: A dedicated software environment (often provided by the PLC manufacturer) is used for programming the PLC’s logic and, more importantly, for creating a Human-Machine Interface (HMI). This HMI displays real-time readings, logs data to a file, and generates trend graphs.
The operational principle is straightforward yet powerful. The halogen lamp illuminates the PV panel. The panel generates electricity, which is delivered to the variable load. The isolators continuously sample the voltage across and the current through the load (or directly from the panel). These conditioned signals are read by the PLC’s analog input module at a high sampling rate. The PLC program, developed by me, scales these digital readings back to engineering units (Volts and Amperes). It then performs real-time calculations for power and efficiency using the formulas mentioned earlier. All this data is sent to the connected computer via a programming cable. The custom software interface presents the data numerically and graphically, enabling students to visualize, for instance, how $\eta_{pv}$ drops as the panel temperature rises due to prolonged illumination—a key learning objective in solar system education.
The innovative aspects of this teaching platform are multifaceted. First, it merges industrial automation technology (PLC) with renewable energy experimentation, exposing students to cross-disciplinary concepts in instrumentation, control, and energy systems within a single solar system lab. Second, its functionality surpasses basic multimeters by enabling simultaneous multi-parameter monitoring, automatic data recording over time, and dynamic plotting. This allows for the investigation of transient phenomena and long-term performance trends in a solar system. Third, the automated graph generation eliminates manual plotting errors and saves considerable time, allowing students to focus on analysis and interpretation of the solar system’s behavior.
Pedagogical Applications and Research Outcomes
This platform has proven instrumental in facilitating advanced undergraduate projects and research, moving beyond routine demonstrations to enabling genuine inquiry-based learning and innovation in solar system technology.
Application 1: Measuring Parameters for Up-Conversion Modified Nano-TiO₂ Self-Cleaning PV Panels.
A significant limitation of conventional silicon-based solar systems is their poor utilization of the infrared (IR) spectrum, which constitutes a large portion of solar energy. A student project utilized my platform to evaluate a novel panel design aimed at enhancing the solar system’s spectral response and reducing maintenance. The project involved coating the glass cover of a standard PV panel with a thin film of Er³⁺/Yb³⁺/Li⁺ doped nano-TiO₂. This coating serves a dual purpose: it acts as a self-cleaning (hydrophilic) layer, and more importantly, as an up-conversion material. Up-conversion materials absorb lower-energy IR photons and emit higher-energy visible photons, which the silicon cell can then convert more efficiently. The platform was used to compare the performance of the modified panel against a standard one under identical simulated irradiance from the halogen lamp. Key parameters like short-circuit current ($I_{sc}$), open-circuit voltage ($V_{oc}$), and the fill factor ($FF$) were measured precisely. The fill factor, calculated from the I-V curve data captured by the platform, is given by:
$$FF = \frac{P_{max}}{I_{sc} \times V_{oc}} = \frac{V_{mp} \times I_{mp}}{I_{sc} \times V_{oc}}$$
where $P_{max}$ is the maximum power point, and $V_{mp}$ and $I_{mp}$ are the voltage and current at that point. The experiment allowed for a quantitative assessment of whether the up-conversion layer led to a measurable increase in $I_{sc}$ and overall $\eta_{pv}$, demonstrating the practical value of spectral engineering in a solar system.
Application 2: Performance Measurement of a Novel Hybrid PV/T System.
Another critical issue in solar system operation is the temperature-induced efficiency loss. A graduate research project focused on a hybrid Photovoltaic/Thermal (PV/T) system designed to cool the PV panel (improving $\eta_{pv}$) and simultaneously capture waste heat as usable thermal energy. The system combined air and water cooling channels on the back of the panel. My experiment platform was central to evaluating its effectiveness. The platform measured the electrical output parameters of the PV panel under different cooling modes: no cooling, air-cooling, and water-cooling. The temperature of the panel back-surface was also monitored using a thermocouple (with signal fed through an appropriate isolator to the PLC). The data clearly showed the inverse relationship between cell temperature and voltage/output power. The electrical efficiency gain from active cooling could be quantified. Furthermore, by measuring the temperature rise and flow rate of the cooling water, the thermal energy recovered could be calculated, allowing for the determination of the overall combined PV/T efficiency of the solar system:
$$\eta_{PV/T} = \frac{P_{electrical} + Q_{thermal}}{P_{in}}$$
where $Q_{thermal} = \dot{m} c_p \Delta T$, with $\dot{m}$ being the mass flow rate of water, $c_p$ its specific heat capacity, and $\Delta T$ its temperature rise. A simplified performance comparison is summarized in the table below, based on typical experimental data obtained using the platform.
| Cooling Mode | Avg. PV Temp. (°C) | Avg. Electrical Efficiency ($\eta_{pv}$) | Thermal Output | Approx. Overall $\eta_{PV/T}$ |
|---|---|---|---|---|
| No Cooling | ~70 | 14.5% | None | 14.5% |
| Air-Cooling | ~55 | 15.8% | Low-grade heat | ~18% |
| Water-Cooling | ~40 | 16.5% | Usable hot water | ~40%* |
* The overall efficiency is significantly higher as it captures both electrical and high-grade thermal output, demonstrating a major advantage of an integrated solar system.
Platform Characteristics and Advantages
The developed platform exhibits several key features that make it particularly suitable for educational environments and applied research on solar systems.
Cost-Effectiveness and Scalability: The platform is constructed from commercially available, off-the-shelf industrial components. There are no custom-made or prohibitively expensive proprietary instruments. This low cost lowers the barrier to implementation for educational institutions and allows for easy replication or scaling (e.g., testing multiple panels in an array configuration). Component replacement is straightforward.
Clarity in Teaching: The open-frame design and modular nature make every component—the PLC, isolators, wiring, load—visible and accessible. Students can physically trace signal paths from the solar system’s PV panel to the computer screen, reinforcing theoretical concepts in data acquisition, signal processing, and control systems. The automated data presentation removes the tedium of manual recording, freeing time for discussion and analysis.
Modularity and Extensibility: This is perhaps the platform’s greatest strength. The hardware and software are inherently modular. The PLC can accommodate additional analog or digital I/O modules. Sensors for irradiance ($G$), ambient temperature, wind speed, or panel back-surface temperature can be seamlessly integrated by adding appropriate transmitters. The software’s HMI and data logging routines can be modified or expanded without altering the core hardware. This allows educators to design progressively complex experiments. For instance, students could be tasked with integrating a pyranometer and programming the software to calculate and log real-time efficiency $\eta_{pv}(t)$ automatically. This fosters innovation and deeper engagement with the intricacies of a solar system.
Conclusion
The solar photovoltaic panel real-time parameter measurement teaching experiment platform I have developed successfully bridges a gap in practical engineering education. It transforms the study of solar system fundamentals from a static, observation-based activity into a dynamic, data-rich, and investigative experience. By leveraging industrial-grade PLC technology within an accessible educational framework, the platform equips students with hands-on skills in measurement, automation, and data analysis relevant to modern renewable energy systems. Its applications in evaluating advanced concepts like up-conversion layers and hybrid PV/T systems underscore its value as a tool for fostering innovation. The platform’s low cost, clarity, and high extensibility make it a compelling solution for enhancing laboratory instruction in energy-related disciplines, ultimately contributing to the development of a skilled workforce capable of advancing solar system technologies.