
In modern energy systems, li-ion batteries have become a cornerstone technology due to their high energy density, long cycle life, and low self-discharge rate. They are extensively deployed in electric vehicles, grid energy storage stations, and portable electronic devices. However, the performance of li-ion batteries degrades over time due to irreversible electrochemical reactions, which can lead to reduced efficiency, safety hazards, and increased maintenance costs. Accurately estimating the State of Health (SOH) of li-ion batteries is crucial for battery management systems to ensure optimal operation, prolong lifespan, and prevent failures. SOH is defined as the ratio of current maximum capacity to initial capacity, representing the battery’s aging level. Traditional SOH estimation methods, such as direct measurement techniques, rely on laboratory tests like capacity or impedance measurements, but they are often impractical for real-time applications. Model-based approaches, including adaptive filtering and data-driven methods, have gained attention. Among these, data-driven methods leverage operational data like voltage, current, and temperature to extract health indicators and build estimation models without requiring intricate electrochemical models. This paper proposes a novel SOH estimation method for li-ion batteries based on health factors and an improved Long Short-Term Memory (LSTM) neural network optimized by Particle Swarm Optimization (PSO). By selecting relevant health factors and enhancing LSTM through PSO, we aim to achieve high accuracy and robustness in SOH estimation across various operating conditions.
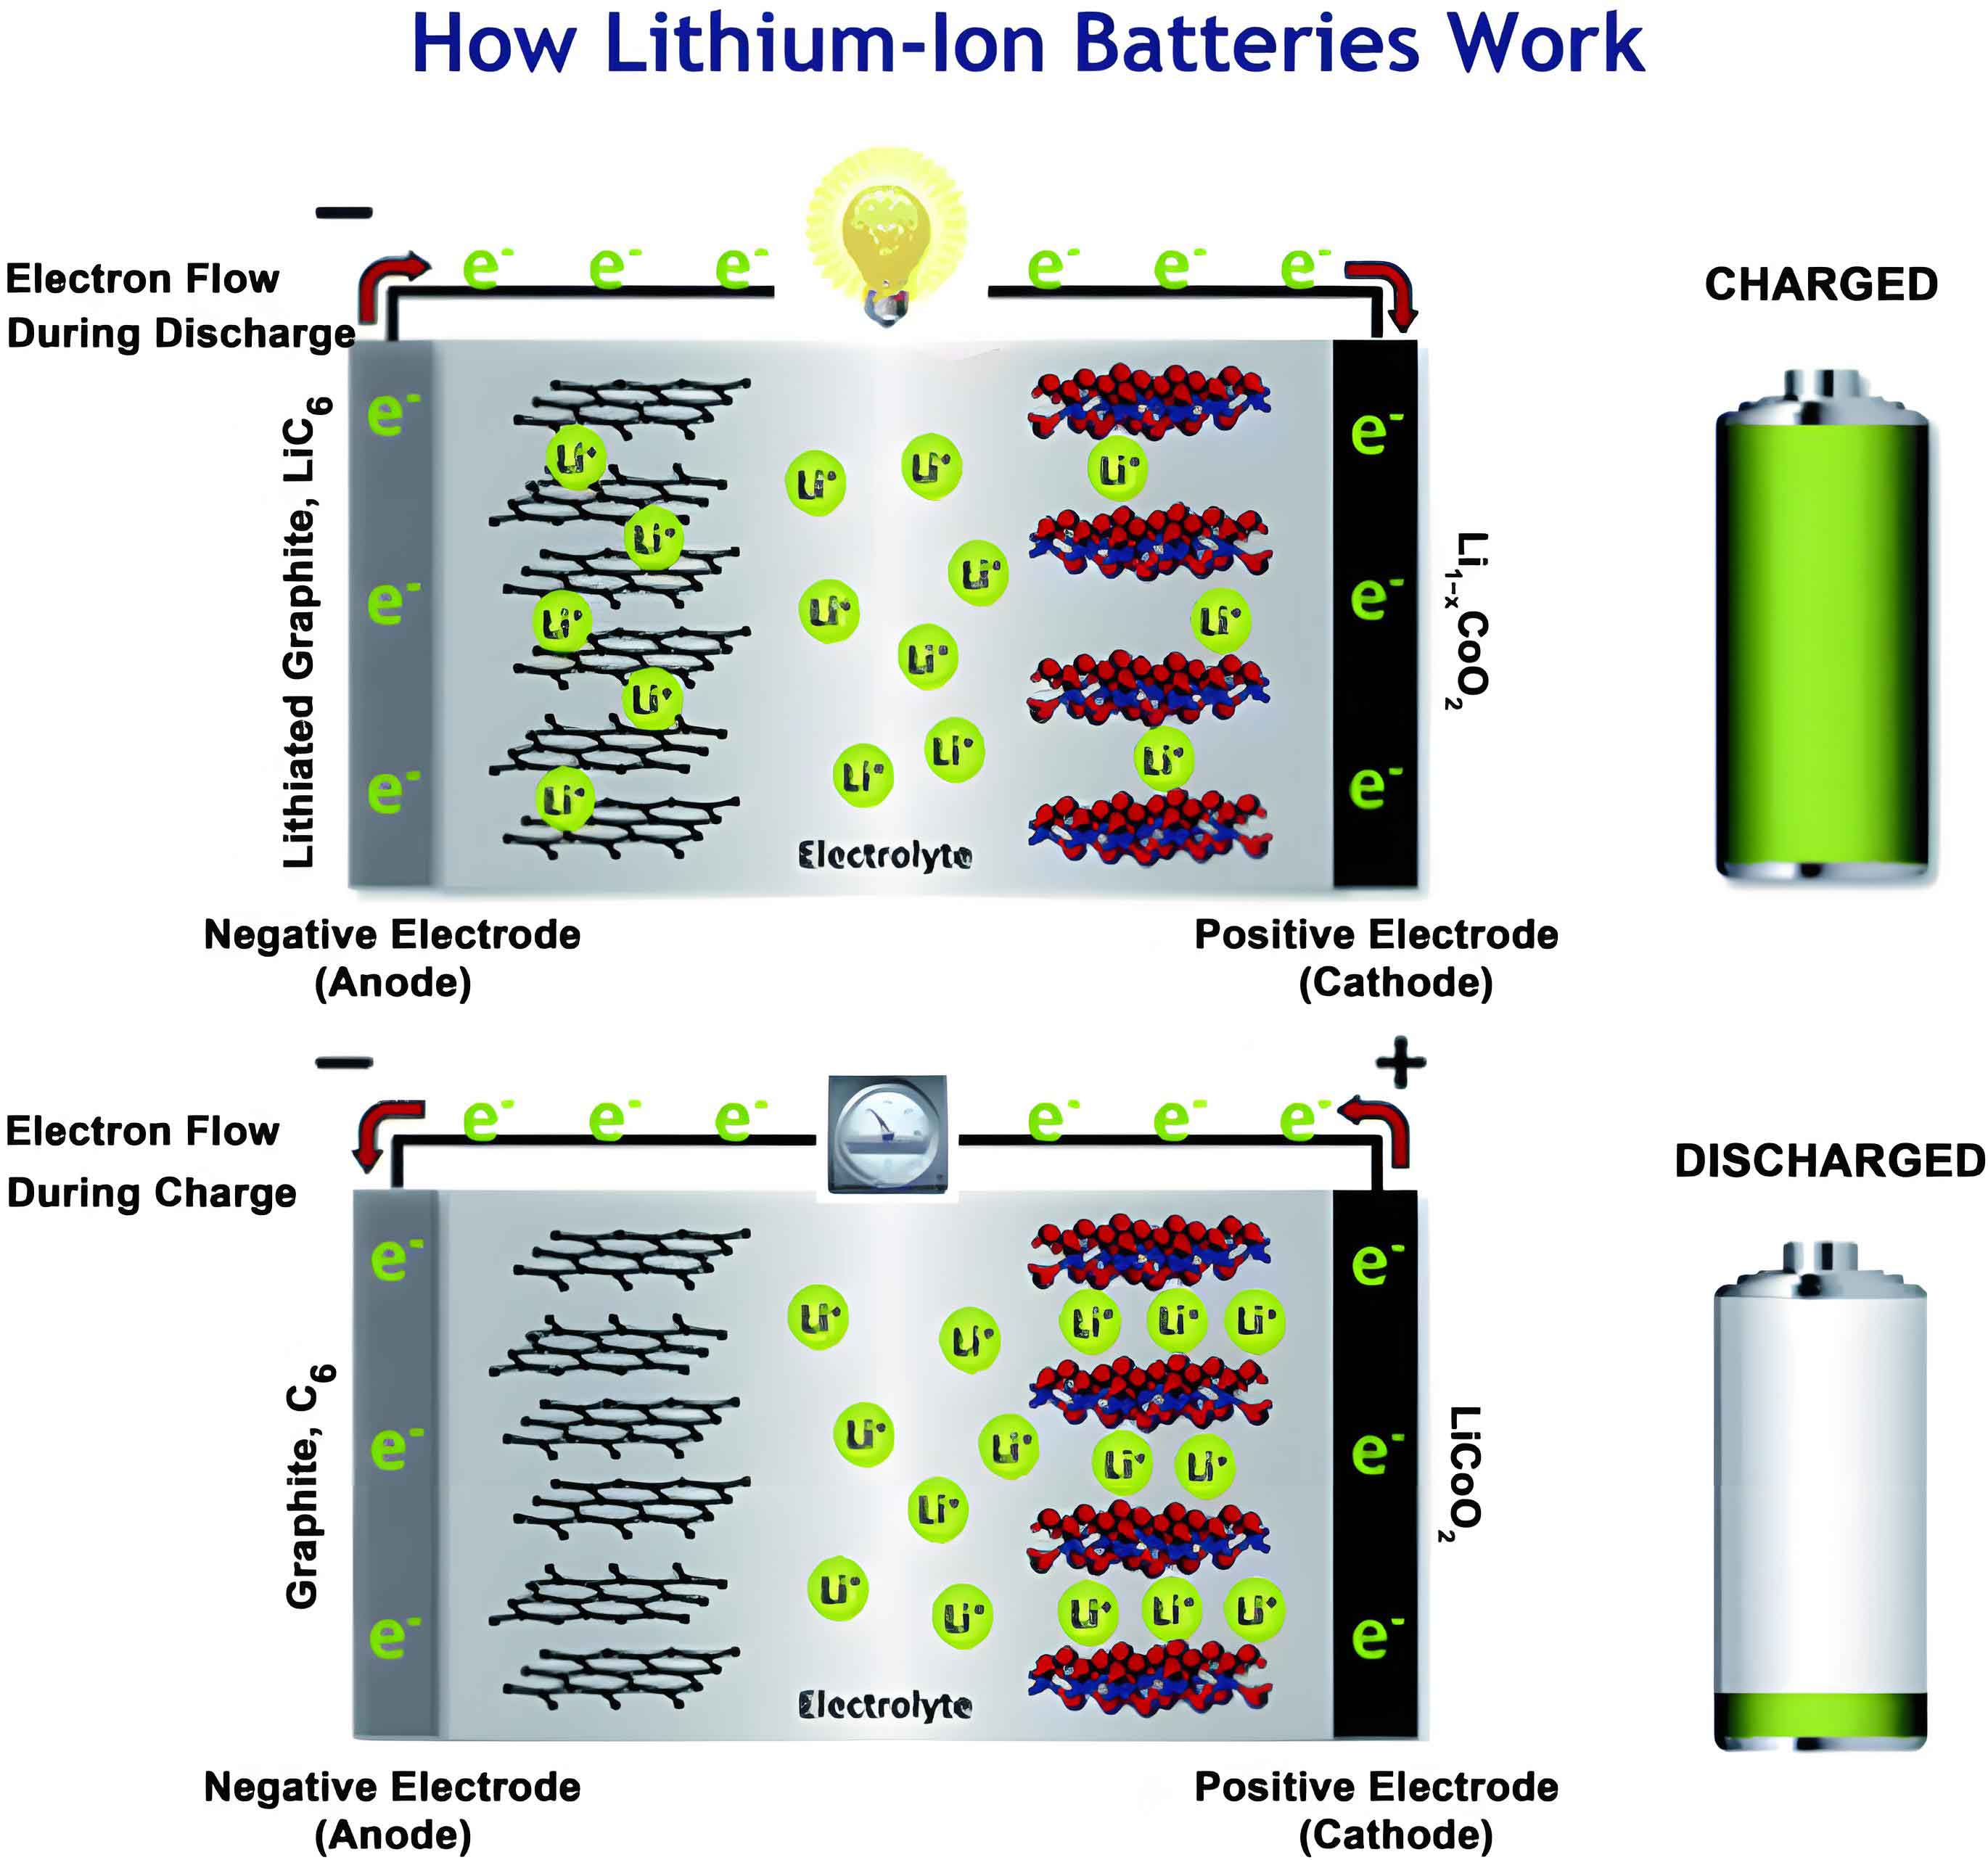
The growing adoption of li-ion batteries in renewable energy integration and transportation underscores the need for reliable SOH monitoring. In grid-scale energy storage, li-ion batteries help balance supply and demand, but their degradation can impact system stability. Similarly, in electric vehicles, battery health directly influences driving range and safety. Existing SOH estimation techniques can be categorized into direct methods and indirect methods. Direct methods involve periodic capacity tests, which are time-consuming and disruptive. Indirect methods include model-based approaches like equivalent circuit models or electrochemical models combined with filters such as Kalman filters, but these require accurate parameter identification and may struggle with complex operating conditions. Data-driven methods, on the other hand, utilize machine learning algorithms to learn patterns from historical data. For instance, support vector machines, Gaussian process regression, and neural networks have been applied. Specifically, LSTM networks excel at handling time-series data, making them suitable for battery aging analysis. However, standard LSTM models often suffer from suboptimal hyperparameter settings, which can affect estimation performance. To address this, we integrate PSO to automate hyperparameter tuning, thereby improving the LSTM’s adaptability to li-ion battery data characteristics.
Our approach begins with the extraction of health factors from charging data of li-ion batteries. Charging processes are typically more consistent than discharging ones, as they often follow standardized protocols. We analyze voltage-time, current-time, and temperature-time curves during constant current-constant voltage (CC-CV) charging. From these curves, we derive ten health factors that capture different aspects of battery aging. These factors include both measured and computed metrics, such as the area under the current-time curve, time durations for CC and CV phases, maximum temperature, and features from incremental capacity (IC) analysis. To validate their relevance, we calculate the Pearson correlation coefficient (PCC) between each health factor and SOH. A high absolute PCC value indicates strong correlation, confirming the suitability of these factors for SOH estimation. The selected health factors are then normalized to a [0,1] range to ensure consistent scaling for model input.
The core of our estimation model is the PSO-LSTM network. LSTM is a type of recurrent neural network designed to capture long-term dependencies in sequential data. Its architecture includes gates (forget gate, input gate, output gate) that regulate information flow, mitigating issues like gradient vanishing. The mathematical formulation of an LSTM unit at time step t is as follows:
$$
\begin{aligned}
f_t &= \sigma(W_f \cdot [h_{t-1}, x_t] + b_f) \\
i_t &= \sigma(W_i \cdot [h_{t-1}, x_t] + b_i) \\
\tilde{C}_t &= \tanh(W_C \cdot [h_{t-1}, x_t] + b_C) \\
C_t &= f_t \cdot C_{t-1} + i_t \cdot \tilde{C}_t \\
o_t &= \sigma(W_o \cdot [h_{t-1}, x_t] + b_o) \\
h_t &= o_t \cdot \tanh(C_t)
\end{aligned}
$$
where \(x_t\) is the input vector (health factors), \(h_t\) is the hidden state, \(C_t\) is the cell state, \(W\) and \(b\) are weight matrices and bias vectors, and \(\sigma\) denotes the sigmoid activation function. However, the performance of LSTM heavily depends on hyperparameters like the number of hidden neurons, learning rate, and training epochs. Manual tuning is often tedious and may not yield optimal results. Therefore, we employ PSO, a metaheuristic optimization algorithm inspired by bird flocking behavior, to automatically search for the best hyperparameter combination. In PSO, a population of particles explores the search space, updating their positions based on individual and global best solutions. The velocity and position update equations are:
$$
\begin{aligned}
v_{ij}(t+1) &= w \cdot v_{ij}(t) + c_1 r_1 (p_{ij}(t) – x_{ij}(t)) + c_2 r_2 (p_{gj}(t) – x_{ij}(t)) \\
x_{ij}(t+1) &= x_{ij}(t) + v_{ij}(t+1)
\end{aligned}
$$
where \(v_{ij}\) and \(x_{ij}\) are velocity and position of particle i in dimension j, \(w\) is inertia weight, \(c_1\) and \(c_2\) are acceleration coefficients, \(r_1\) and \(r_2\) are random numbers, \(p_{ij}\) is personal best, and \(p_{gj}\) is global best. We define the hyperparameters as a particle: \(x = [ls, lr, ep, lrdf, lrdp]\), where \(ls\) is hidden layer size, \(lr\) is initial learning rate, \(ep\) is maximum epochs, \(lrdf\) is learning rate drop factor, and \(lrdp\) is learning rate drop period. The fitness function for PSO is the mean squared error (MSE) between estimated and true SOH values on a validation set. After optimization, the best hyperparameters are used to train the LSTM model, resulting in the PSO-LSTM estimator.
To evaluate our method, we utilize publicly available datasets from NASA and MIT. These datasets contain cycling tests of li-ion batteries under controlled conditions, including charge-discharge profiles with measurements of voltage, current, temperature, and capacity. SOH is computed as:
$$
\text{SOH}(\%) = \frac{C_k}{C_0} \times 100\%
$$
where \(C_0\) is initial discharge capacity and \(C_k\) is capacity at cycle k. We extract health factors from charging segments for multiple cycles. For example, from the NASA B0005 battery, we derive factors such as area under current-time curve during entire charge, CC phase, and CV phase; time durations for CC and CV; maximum temperature; voltage change over fixed intervals; ratio of CC time to total charge time; peak value of IC curve; and voltage at IC peak. The PCC analysis for B0005 battery reveals strong correlations, as summarized in Table 1.
| Health Factor | Correlation Coefficient | Health Factor | Correlation Coefficient |
|---|---|---|---|
| Area under current-time curve (total charge) | 0.9077 | Time duration of CV charging | -0.9115 |
| Area under current-time curve (CC phase) | 0.9392 | Ratio of CC time to total charge time | 0.9444 |
| Area under current-time curve (CV phase) | -0.9875 | Maximum temperature during charge | -0.9353 |
| Voltage change over fixed time | -0.9603 | Peak value of IC curve | 0.8817 |
| Time duration of CC charging | 0.9396 | Voltage at IC peak | 0.9558 |
All health factors show absolute PCC values above 0.8, indicating high relevance for SOH estimation of li-ion batteries. Similar trends are observed for other batteries like B0018. After extracting health factors, we split the data into training and testing sets. To assess robustness, we experiment with different proportions: 70%, 60%, and 50% of cycles for training, with the remainder for testing. The PSO-LSTM model is trained on normalized health factors, and SOH estimates are generated for test cycles. Performance metrics include root mean square error (RMSE), mean absolute error (MAE), mean absolute percentage error (MAPE), and MSE, defined as:
$$
\begin{aligned}
\text{RMSE} &= \sqrt{\frac{1}{n} \sum_{i=1}^{n} (y_i – \hat{y}_i)^2} \times 100\% \\
\text{MAE} &= \frac{1}{n} \sum_{i=1}^{n} |y_i – \hat{y}_i| \times 100\% \\
\text{MAPE} &= \frac{100\%}{n} \sum_{i=1}^{n} \left| \frac{y_i – \hat{y}_i}{y_i} \right| \\
\text{MSE} &= \frac{1}{n} \sum_{i=1}^{n} (y_i – \hat{y}_i)^2 \times 100\%
\end{aligned}
$$
where \(y_i\) is true SOH, \(\hat{y}_i\) is estimated SOH, and n is number of test samples. Lower values indicate better accuracy.
Simulation results demonstrate the effectiveness of PSO-LSTM for li-ion battery SOH estimation. For the NASA B0005 battery, with 70% training data, the estimated SOH curves closely align with reference values, and errors are mostly within ±1%. Similar accuracy is achieved with 60% and 50% training data, showing the model’s robustness to limited training samples. The error distributions are consistently tight, affirming the reliability of our method. Comparative analysis with standard LSTM and feed-forward neural networks (FNN) highlights the superiority of PSO-LSTM. For instance, with 70% training data on B0005, PSO-LSTM achieves RMSE of 0.58%, while LSTM and FNN yield 1.75% and 2.69%, respectively. This represents reductions of 66.9% and 78.5% in RMSE. Similar improvements are observed for MAE, MAPE, and MSE across different training proportions, as detailed in Table 2.
| Training Ratio | Method | B0005 Battery | B0018 Battery | ||||||
|---|---|---|---|---|---|---|---|---|---|
| RMSE (%) | MAE (%) | MAPE (%) | MSE (%) | RMSE (%) | MAE (%) | MAPE (%) | MSE (%) | ||
| 70% | PSO-LSTM | 0.58 | 0.41 | 0.57 | 0.23 | 0.82 | 0.68 | 0.91 | 0.13 |
| LSTM | 1.75 | 1.61 | 2.25 | 0.25 | 1.52 | 1.27 | 1.70 | 0.25 | |
| FNN | 2.69 | 2.13 | 3.00 | 0.39 | 1.90 | 1.51 | 2.02 | 0.31 | |
| 60% | PSO-LSTM | 0.63 | 0.45 | 0.61 | 0.076 | 0.66 | 0.50 | 0.66 | 0.31 |
| LSTM | 2.33 | 2.11 | 2.90 | 0.28 | 2.63 | 2.29 | 3.06 | 0.37 | |
| FNN | 3.77 | 3.05 | 4.20 | 0.40 | 2.43 | 1.91 | 2.55 | 0.34 | |
| 50% | PSO-LSTM | 0.78 | 0.45 | 0.59 | 0.30 | 0.47 | 0.34 | 0.45 | 0.06 |
| LSTM | 3.92 | 3.52 | 4.79 | 1.50 | 4.18 | 3.52 | 4.68 | 0.52 | |
| FNN | 4.24 | 3.73 | 5.09 | 0.46 | 3.80 | 3.47 | 4.59 | 0.47 | |
For the B0018 li-ion battery, PSO-LSTM also exhibits high accuracy, with errors primarily within ±1.5%. The model maintains consistent performance even with reduced training data, underscoring its generalization capability. Furthermore, we conduct a cross-battery test where B0005 data trains the model and B0018 data tests it. PSO-LSTM achieves RMSE of 1.14%, outperforming LSTM (2.3%) and FNN (3%), demonstrating transferability across different li-ion batteries. Additional validation on MIT battery data yields RMSE below 1% for all training ratios, confirming the method’s applicability to diverse datasets.
The success of PSO-LSTM can be attributed to several factors. First, the selected health factors comprehensively capture aging phenomena in li-ion batteries, such as capacity fade and internal resistance growth. For example, the area under the CV current-time curve negatively correlates with SOH, reflecting reduced ability to hold charge. Second, PSO optimization fine-tunes LSTM hyperparameters, enhancing learning efficiency and preventing overfitting. Compared to manual tuning, PSO automates the process, saving time and improving reproducibility. Third, LSTM’s recurrent structure effectively models temporal dependencies in battery cycling data, which is essential for capturing gradual degradation trends. In contrast, FNN lacks memory mechanisms, leading to poorer performance. The integration of these components results in a robust estimator suitable for real-world applications where li-ion batteries operate under varying loads and environmental conditions.
Despite these advantages, challenges remain for li-ion battery SOH estimation. For instance, health factor extraction may require high-frequency data sampling, which could be computationally intensive. Future work could explore lightweight feature selection techniques or online learning adaptations to reduce resource consumption. Additionally, incorporating more diverse operating conditions, such as dynamic driving cycles or extreme temperatures, would further validate the model’s robustness. Other neural network architectures, like convolutional LSTMs or attention-based models, could be investigated to potentially improve accuracy. Moreover, integrating physics-informed constraints into the data-driven framework might enhance interpretability, bridging the gap between empirical and model-based approaches for li-ion battery management.
In conclusion, we have presented a data-driven method for SOH estimation of li-ion batteries using health factors and PSO-LSTM. By extracting ten relevant health factors from charging data and optimizing LSTM hyperparameters with PSO, our approach achieves high estimation accuracy and robustness across multiple datasets. Experimental results on NASA and MIT li-ion battery data show that PSO-LSTM consistently outperforms standard LSTM and FNN, with errors largely within 2%. The method’s effectiveness is maintained even with limited training data, making it promising for practical deployment in battery management systems. As li-ion batteries continue to power the transition to sustainable energy, accurate SOH monitoring will be vital for ensuring reliability and longevity. Our work contributes to this goal by providing a scalable and adaptive solution for li-ion battery health assessment.