
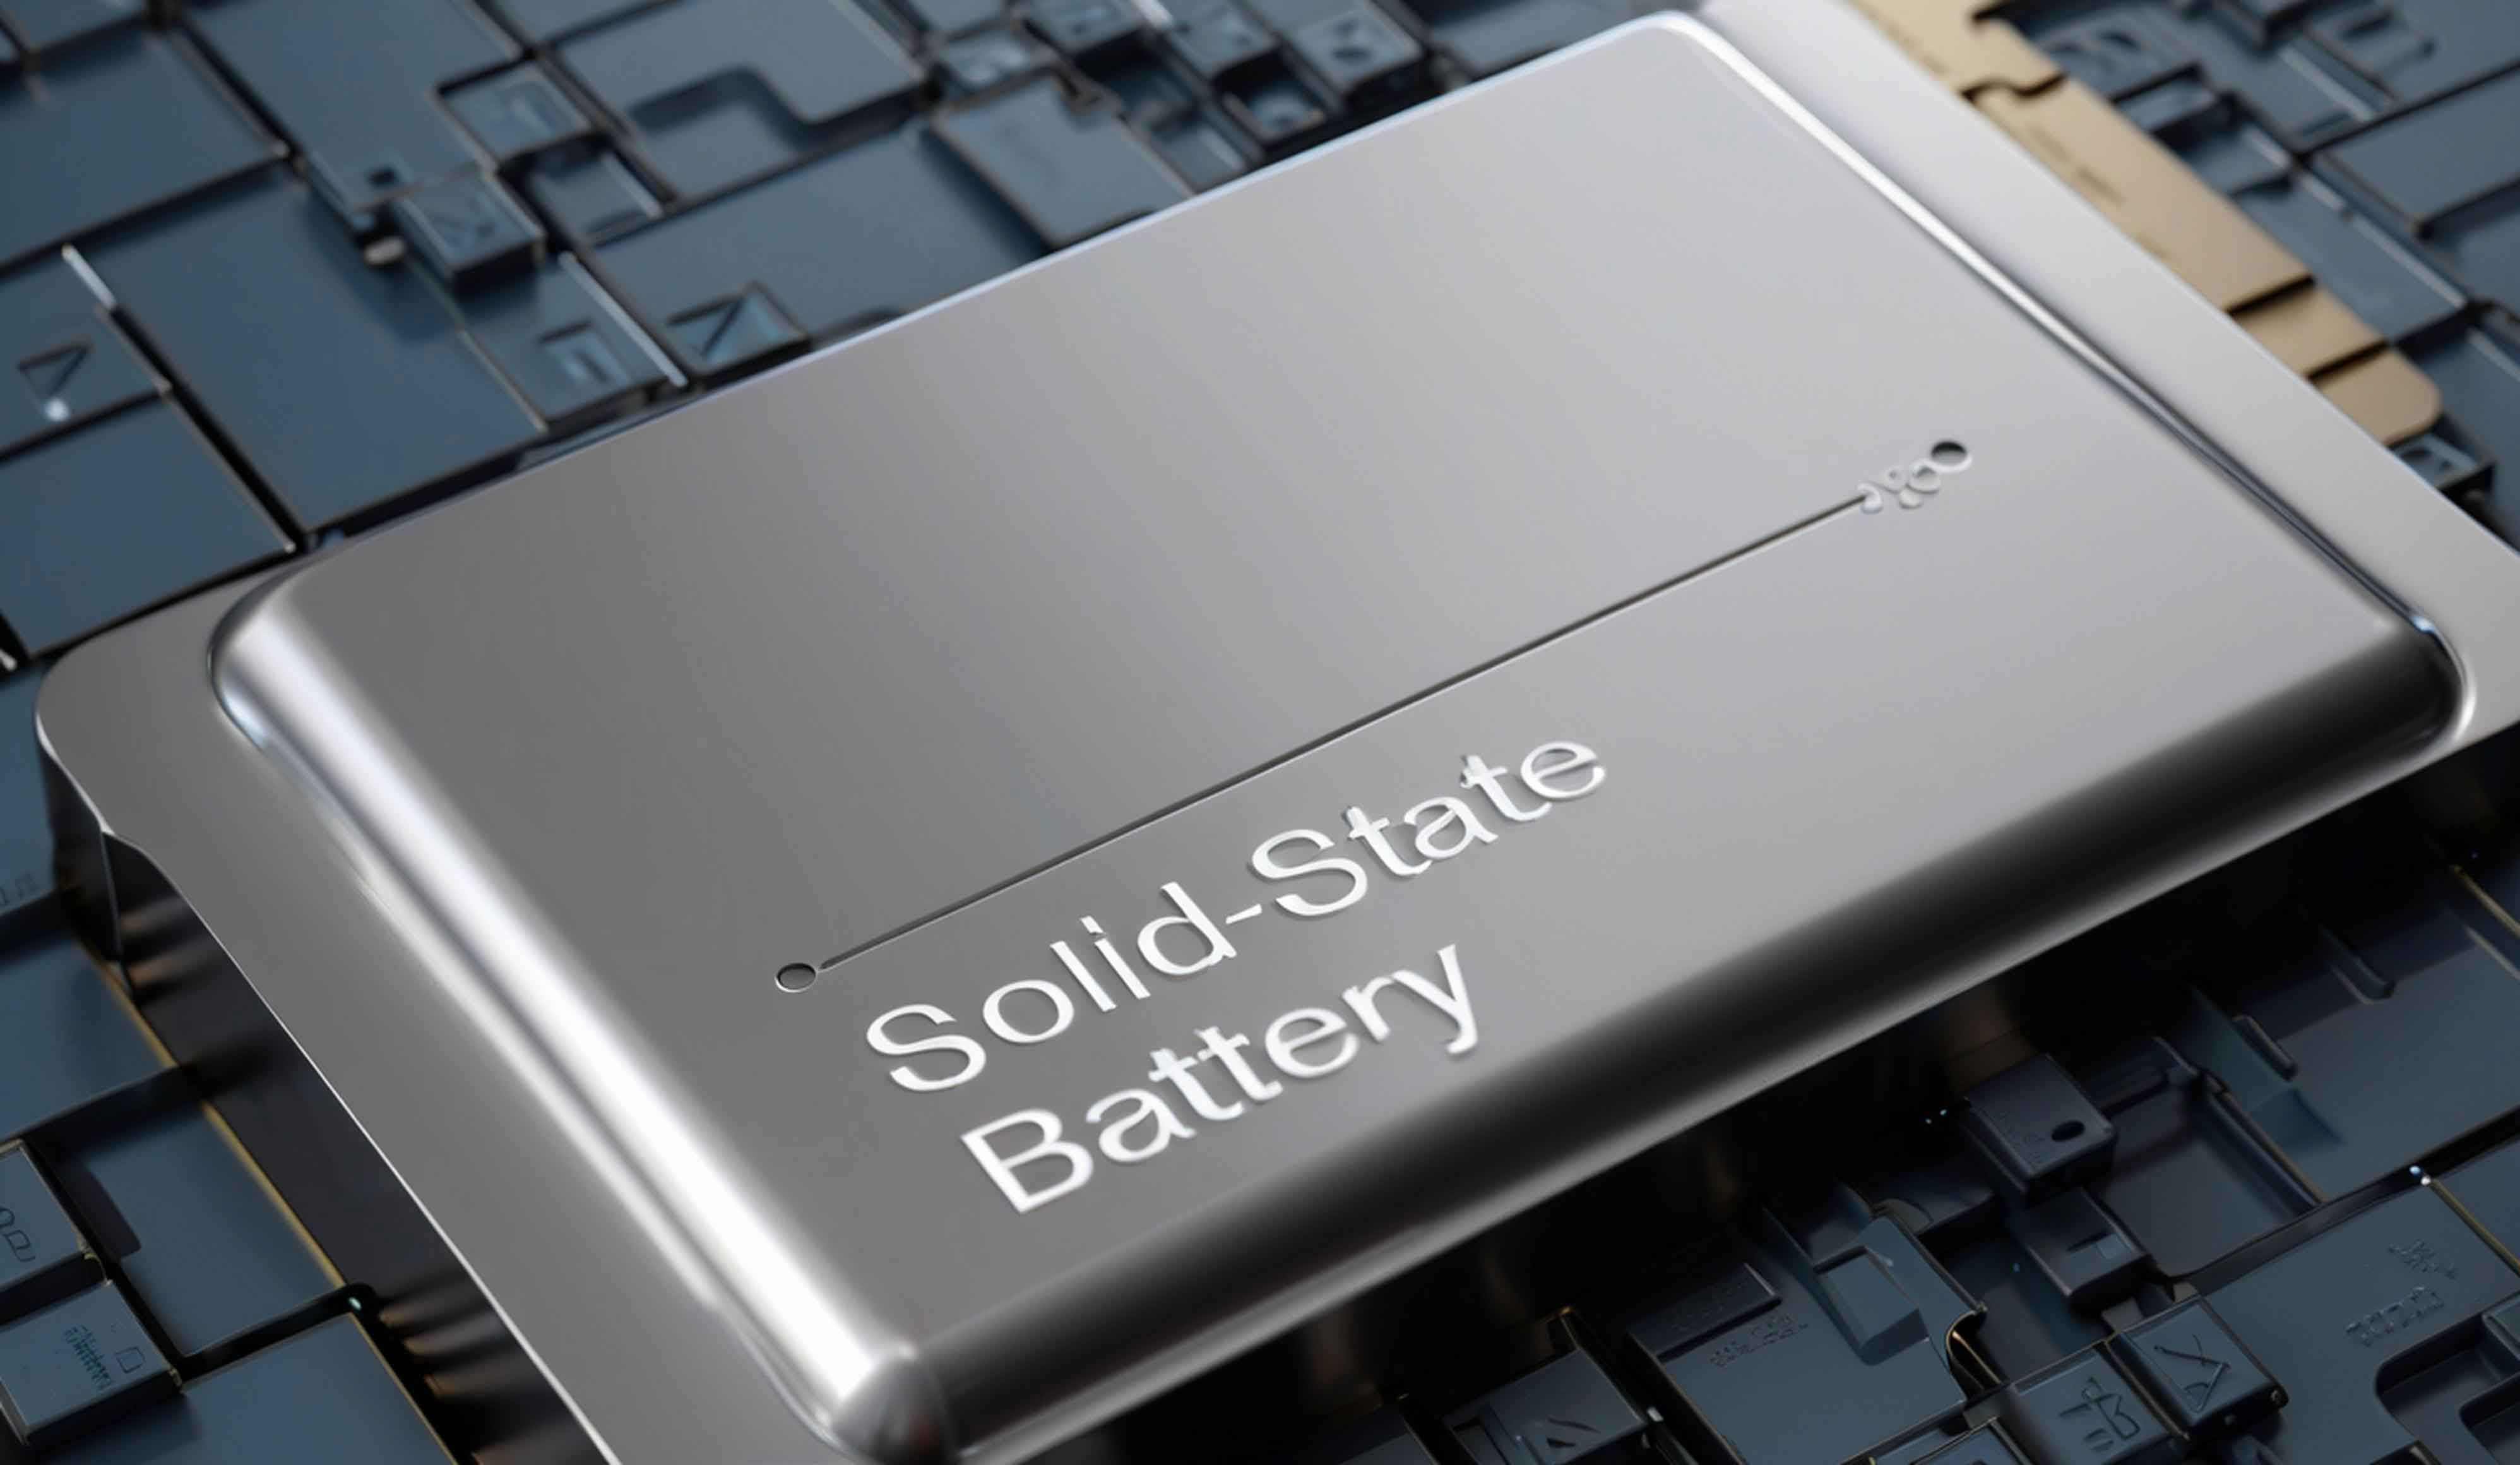
The commercialization of solid-state batteries has entered a critical phase, with prototypes achieving energy densities exceeding 400 Wh/kg. Major automakers and battery manufacturers have outlined roadmaps targeting small-batch vehicle integration by 2027 and full-scale production by 2030. This transition timeline can be quantified through the following milestones:
| Parameter | Liquid Electrolyte | Semi-Solid | Solid-State |
|---|---|---|---|
| Energy Density (Wh/kg) | 250-300 | 350-400 | 400-500+ |
| Cycle Life | 1500+ | 800-1000 | 500-800* |
| Operating Temp. (°C) | -20~60 | -30~80 | -40~120 |
| Cost ($/kWh) | 80-100 | 120-150 | 200-300 |
*Current lab-stage performance
The ionic conductivity ($σ$) of solid electrolytes remains the primary technical bottleneck. For viable solid-state batteries, the electrolyte must satisfy:
$$σ \geq 10^{-3} \, \text{S/cm} \, \text{at} \, 25°C$$
Current sulfide-based electrolytes achieve $σ ≈ 2.5×10^{-3} \, \text{S/cm}$, while oxide electrolytes lag at $σ ≈ 10^{-5} \, \text{S/cm}$. The temperature-dependent conductivity follows the Arrhenius equation:
$$σ = σ_0 \exp\left(-\frac{E_a}{k_B T}\right)$$
where $E_a$ represents activation energy, $k_B$ is Boltzmann’s constant, and $T$ is absolute temperature.
Interface Engineering Challenges
Solid-solid electrode-electrolyte interfaces create three fundamental challenges:
- Mechanical stress from volume changes during cycling ($ΔV ≈ 300\%$ for Si-anodes)
- Space charge layer formation at interfaces
- Chemical instability between components
The interfacial resistance ($R_{int}$) can be modeled as:
$$R_{int} = \frac{1}{A} \left( \frac{d_{SE}}{σ_{SE}} + \frac{d_{EI}}{σ_{EI}} \right) + R_{chem}$$
Where $d_{SE}$ and $d_{EI}$ are the solid electrolyte and electrode interface thicknesses, $σ$ represents respective conductivities, and $R_{chem}$ accounts for chemical reaction resistance.
Cost Projection Models
The learning curve for solid-state battery costs follows:
$$C_t = C_0 \times \left( \frac{Q_t}{Q_0} \right)^{-b}$$
Where:
- $C_0$ = Initial cost ($300/kWh)
- $Q_t$ = Cumulative production
- $b$ = Learning rate (estimated 18-22%)
Comparative cost trajectories:
| Year | Solid-State Cost ($/kWh) | Liquid Cost ($/kWh) |
|---|---|---|
| 2025 | 280 | 95 |
| 2027 | 210 | 85 |
| 2030 | 130 | 75 |
| 2035 | 90 | 65 |
Manufacturing Innovations
Emerging production techniques for solid-state batteries include:
- Atomic layer deposition (ALD) for ultrathin electrolyte layers
- Spark plasma sintering (SPS) for dense electrolyte structures
- Roll-to-roll processing for multilayer assemblies
The production yield ($Y$) relationship with defect density ($D$) follows:
$$Y = e^{-DA}$$
Where $A$ is the active area. Current pilot lines achieve $Y ≈ 65\%$ compared to $>95\%$ for conventional lithium-ion batteries.
AI-Driven Development
Machine learning accelerates solid-state battery R&D through:
- High-throughput screening of electrolyte compositions
- Interface stability predictions
- Manufacturing process optimization
A typical materials discovery workflow uses generative adversarial networks (GANs):
$$G(z) \rightarrow Candidate\_Material \rightarrow D(x) \rightarrow Stability\_Score$$
Where $G$ generates candidate structures and $D$ evaluates their electrochemical stability.
As solid-state battery technology matures, the industry must address three concurrent challenges: performance validation at scale, supply chain development for novel materials, and standardization of testing protocols. The ultimate goal remains achieving cost parity with liquid electrolyte systems while delivering superior energy density and safety characteristics.