
In the context of achieving the “carbon peak” and “carbon neutrality” goals, the global energy structure is undergoing a profound transformation. The rapid expansion of renewable energy sources, such as wind and solar power, has introduced significant challenges to grid stability due to their inherent intermittency and volatility. To mitigate these challenges, energy storage technology has emerged as a critical enabler for the large-scale integration of renewables. Among various storage technologies, the electrochemical energy storage system, particularly the lithium-ion battery energy storage system, has become the most widely deployed due to its high energy density, fast response time, and declining costs. The primary functions of an energy storage system include peak shaving, valley filling, frequency regulation, and smoothing the output of renewable generation. However, a critical issue affecting the operational longevity and economic viability of the energy storage system is the management of its State of Charge (SOC). An SOC that is either excessively high or low can significantly degrade the battery’s health and lifespan, leading to increased lifecycle costs and potential safety hazards. Therefore, sophisticated control strategies are imperative to prevent the energy storage system from entering overcharge or overdischarge states.
Existing control strategies for the SOC of an energy storage system often adopt a rudimentary approach, treating the SOC as a simple upper and lower boundary constraint. For instance, traditional methods such as the Constant Recovery Power (CRP) strategy, the Battery SOC Hold (BSH) strategy, and the Charging with Frequency Regulation (CFR) strategy have been widely discussed. The CRP strategy applies a constant charging or discharging power when the system demand enters a dead zone, which lacks flexibility and responsiveness. The BSH strategy adjusts power based on the SOC level, discharging more when SOC is high and charging more when SOC is low. The CFR strategy adds a scheduled power signal to the BSH approach but often suffers from oscillation around the optimal SOC point due to the absence of a proper dead band. More advanced strategies, such as those based on model predictive control or fuzzy logic, have been proposed to address SOC balancing among multiple units or to partition the SOC into distinct operational zones. For example, some partitioning strategies define six zones (forbidden, high, sub-high, self-regulation, sub-low, low) and apply exponential recovery coefficients to drive the SOC back to an optimal region. While these methods improve upon simple limits, they often react to the SOC state itself rather than the dynamic trajectory and rate of change of the SOC. They lack the foresight to detect a rapid, adverse trend in SOC that could quickly lead to a limit violation. An energy storage system participating in fast frequency response might experience a sudden and sustained power demand, causing its SOC to drop precipitously. A traditional strategy might not intervene until the SOC hits the lower boundary, at which point the system has already been damaged or the safety margin has been exhausted.
This deficiency necessitates a more predictive and trend-aware control strategy. The proposed methodology draws inspiration from technical analysis in financial markets, specifically the Envelope (ENE) index. The ENE index, or track line index, is valued for its ability to not only define a trend channel but also sensitively detect changes in the direction of a price movement. By applying this concept to the SOC of an energy storage system, we can create a dynamic corridor that represents a safe operational zone. When the SOC deviates beyond this corridor with an excessive velocity, the system can take preemptive action to correct the trajectory. This approach allows for a more nuanced and proactive management of the SOC, preserving the energy storage system’s charge and discharge margins and thereby significantly extending its operational life.
1. ENE Indicator and System Model
1.1 Moving Average Calculation
The moving average (MA) is a fundamental tool used to smooth out short-term fluctuations and highlight longer-term trends. For the control strategy of the energy storage system, we define the moving average of the SOC over a specific time window N. The time resolution is set to 1 minute, yielding 1440 data points for a day. The moving average at the current time, t, is the arithmetic mean of the SOC values observed over the previous N minutes. This is expressed by the following formula:
$$ MA_t = \frac{1}{N} \sum_{i = t – N + 1}^{t} SOC_i $$
Where \( MA_t \) represents the moving average at time t, N is the window length for the moving average, and \( SOC_i \) is the instantaneous state of charge of the energy storage system at time i. The moving average possesses a latency characteristic but provides a stable reference line, effectively filtering out noise from sudden, non-sustained power commands. This stability is crucial for defining a reliable central axis for our control corridor.
1.2 The Envelope (ENE) Index
The ENE index consists of three lines: an upper rail (UPPER), a lower rail (LOWER), and a middle rail (ENE). Unlike Bollinger Bands which are based on standard deviation, the ENE index is a deformation of the moving average. The rails are symmetrical lines drawn at a fixed percentage above and below the moving average. The calculations for the upper and lower rails at time t are given by the following equations:
$$ UPPER_t = (1 + \frac{M1}{100}) \cdot MA_t $$
$$ LOWER_t = (1 – \frac{M2}{100}) \cdot MA_t $$
$$ ENE_t = \frac{UPPER_t + LOWER_t}{2} $$
In these formulas, M1 and M2 are control parameters representing the displacement percentages for the upper and lower lines, respectively. These parameters define the width of the channel. In the context of an energy storage system, the channel created by the upper and lower rails represents a dynamic “safety zone” for the SOC. When the SOC moves outside this zone, it signals an increased risk of overcharge or overdischarge. The original application of the ENE index in stock trading involves specific buy and sell signals based on the price crossing these rails. For example, a price breaking above the upper rail and then falling back down is a sell signal, while a price breaking below the lower rail and recovering is a buy signal. This predictive capability for trend reversal is directly applicable to managing the SOC trajectory of an energy storage system.
1.3 Relative Position and Deviation Indicators
To quantify the position of the SOC within the ENE channel, a relative position indicator is defined. This metric, \( L_t^{SOC} \), normalizes the SOC’s location relative to the channel boundaries. It provides a clear, dimensionless value indicating how close the SOC is to the rails. The calculation is as follows:
$$ L_t^{SOC} = \frac{SOC_t – LOWER_t}{UPPER_t – LOWER_t} $$
As summarized in the table below, different values of \( L_t^{SOC} \) correspond to specific states of the energy storage system, providing a clear and immediate assessment of risk levels.
| Value of \( L_t^{SOC} \) | State of the Energy Storage System SOC | Risk Level |
|---|---|---|
| (-∞, 0) | Below the lower rail (Downward break) | High (Over-discharge risk) |
| 0 | Exactly at the lower rail | Moderate |
| (0, 1) | Within the ENE channel | Safe (Normal operation) |
| 1 | Exactly at the upper rail | Moderate |
| (1, +∞) | Above the upper rail (Upward break) | High (Over-charge risk) |
Furthermore, to avoid unnecessary and frequent optimization of the energy storage system’s power output, an SOC deviation indicator is introduced. This metric, \( D_t^{SOC} \), measures the cumulative deviation of the SOC from its optimal neutral value of 0.5 over a specific evaluation period, \( TN \). The formula for the deviation indicator is:
$$ D_t^{SOC} = \frac{1}{TN} \sum_{i = t – TN + 1}^{t} (SOC_i – 0.5)^2 $$
A threshold value, \( D_{max} \), is established for this deviation indicator. The control strategy will only consider intervening when \( D_t^{SOC} \) exceeds this threshold. This prevents the system from reacting to short, inconsequential swings in SOC, thereby ensuring that the energy storage system is utilized efficiently while still protecting it from sustained periods of high or low stress. The threshold \( D_{max} \) is calculated based on the rated parameters of the energy storage system:
$$ D_{max} = K \cdot \left( \frac{0.9 P_N}{TN \cdot C_B} – 0.5 \right)^2 $$
Where \( P_N \) is the rated power of the energy storage system, \( C_B \) is its rated capacity, and \( K \) is a coefficient that adjusts the sensitivity of the control strategy. A smaller \( K \) value makes the strategy more sensitive, while a larger value allows for greater deviation before corrective action is taken.
2. SOC Control Strategy Based on the ENE Index
The core of the proposed method is the ENE-based SOC control strategy, which intelligently combines the relative position indicator and the deviation indicator to determine the appropriate action for the energy storage system. The control logic is designed to be both predictive and preventive, focusing on the rate of change and direction of the SOC trajectory. The process is described in the following steps.
First, the system inputs the current SOC data and calculates the moving average, the ENE rails, the relative position \( L_t^{SOC} \), the deviation index \( D_t^{SOC} \), and the threshold \( D_{max} \). The control logic then evaluates the state of the energy storage system based on two primary scenarios: operation in the upper half of the SOC range (SOC > 0.5) and operation in the lower half (SOC < 0.5). The strategy is designed to counteract trends that are moving the SOC towards dangerous limit boundaries.
The strategy for the upper half is defined as follows. If the current SOC of the energy storage system is in the upper half of its range (greater than 0.5), it is approaching the overcharge zone. The strategy checks if the SOC has broken upward through the upper ENE rail (\( L_t^{SOC} > 1 \)). If this breach is combined with a high deviation index that exceeds the threshold (\( D_t^{SOC} > D_{max} \)), it signals a sustained and dangerous upward trend. The final condition is to check the planned power for the next time step. If the next planned power \( P_{t+1}^B \) is negative (meaning the energy storage system is scheduled to discharge, which would exacerbate the upward trend by creating a counter-intuitive situation or if it is discharging incorrectly in a high SOC scenario, actually a planned discharge in an overcharge situation is dangerous), the system should intervene. The control strategy overrides this command and forces the energy storage system to charge. The action is defined as modifying the future output power to be positive (charging).
$$ \text{Action: Set } P_{t+1}^B > 0 $$
The symmetric strategy for the lower half is applied when the SOC is less than 0.5. If the SOC has broken downward through the lower ENE rail (\( L_t^{SOC} < 0 \)), the deviation index is high (\( D_t^{SOC} > D_{max} \)), and the next planned power is positive (discharging, which worsens the deep discharge), the system takes preventive action. The control strategy will modify the future output power to be negative, which means commanding the energy storage system to charge to recover its SOC.
$$ \text{Action: Set } P_{t+1}^B < 0 $$
Finally, any power imbalance caused by overriding the original dispatch command for the energy storage system must be absorbed by other regulating resources within the power system, such as thermal units or pumped hydro storage. This coordination ensures that the overall system power balance remains secure while the energy storage system’s health is being protected.
3. Simulation and Verification
3.1 System Configuration and Parameters
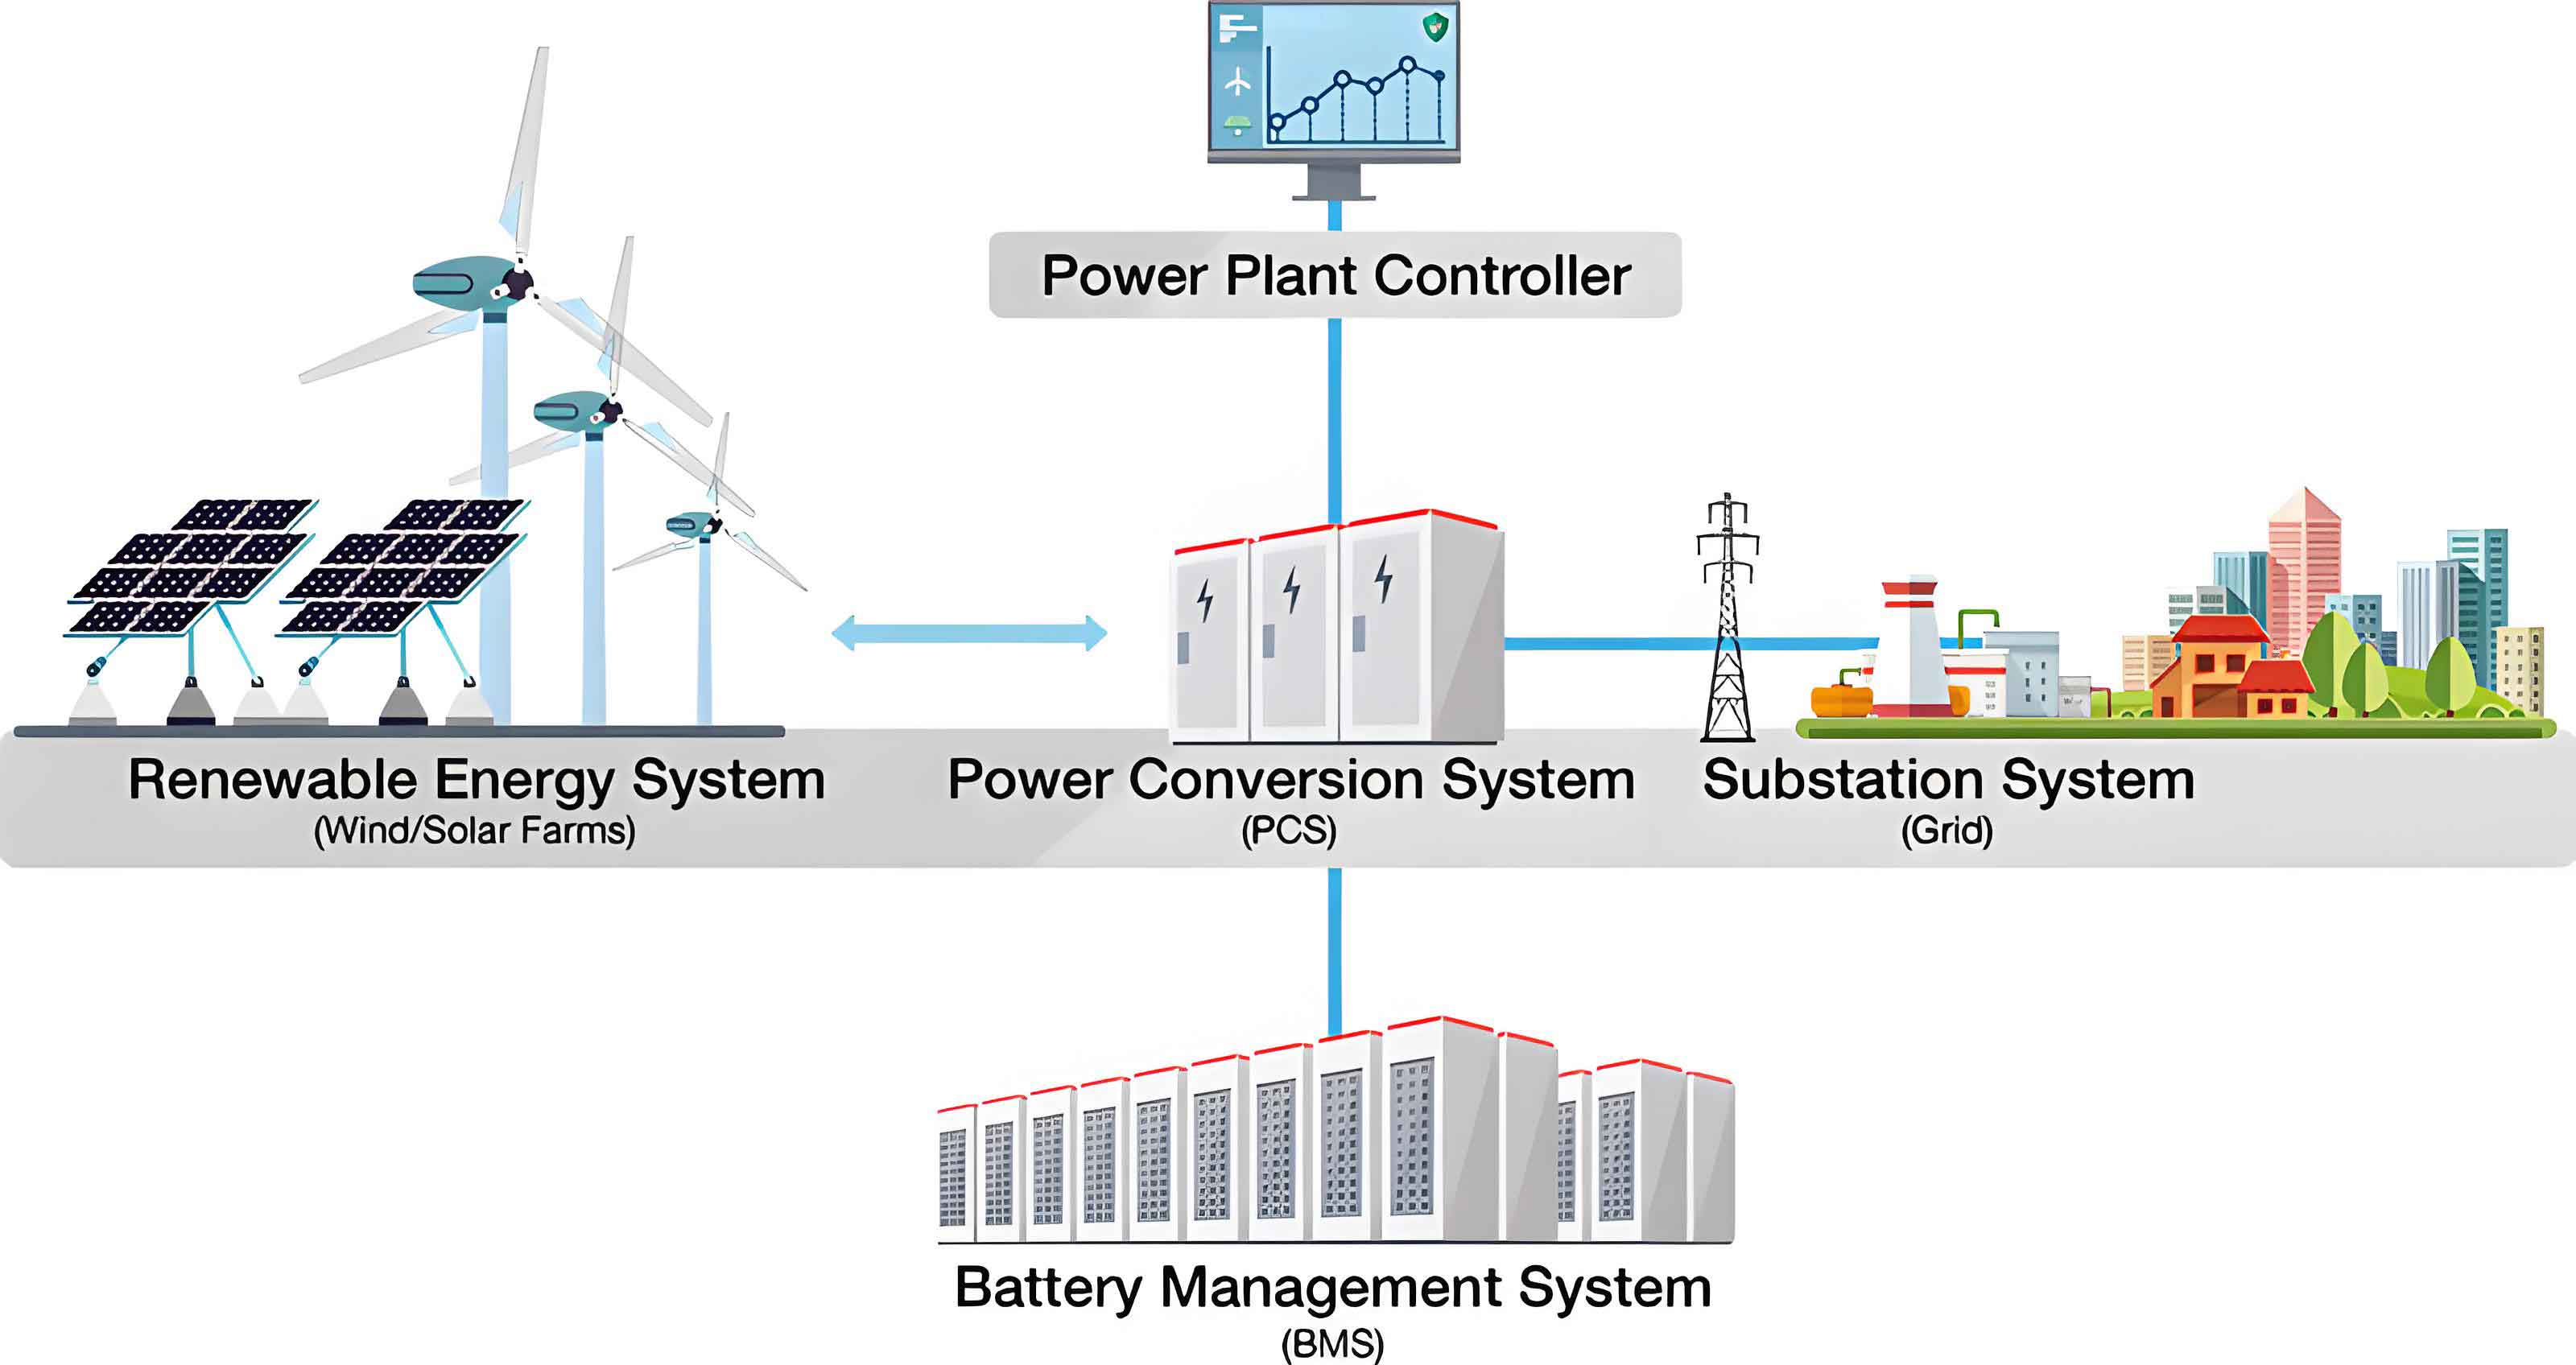
To validate the effectiveness of the proposed ENE-based control strategy, a representative energy base model is established. This model comprises five wind farms, five photovoltaic (PV) stations, two thermal power units, two energy storage systems, and two pumped-storage hydro units. The parameters for the key components are specified in the table below.
| Component Type | Parameter | Specification |
|---|---|---|
| Thermal Unit | Rated Capacity | 300 MW (each) |
| Thermal Unit | Ramp Rate | 9 MW/min |
| Energy Storage System | Rated Capacity (C_B) | 50 MWh (each) |
| Energy Storage System | Rated Power (P_N) | 25 MW (each) |
| Energy Storage System | Initial SOC | 50% |
| Energy Storage System | SOC Limits | [10%, 90%] |
| Energy Storage System | Charge/Discharge Efficiency | 90% |
| ENE Index (N) | Window Length | 60 minutes |
| ENE Index (M1, M2) | Displacement Parameters | 8% |
| SOC Deviation (TN) | Evaluation Period | 60 minutes |
| SOC Threshold (K) | Sensitivity Coefficient | 0.3 |
| SOC Threshold (D_max) | Calculated Limit | 0.1970 |
| Optimal SOC Zone | Target Range | [0.3, 0.7] |
3.2 Performance Analysis of Load Tracking
The primary function of the energy base is to track the day-ahead dispatch schedule. The simulation compares the power deviation (difference between the planned load and the actual output of the generation fleet) both before and after applying the compensation from the regulating units, including the proposed ENE-controlled energy storage system. The simulation runs for 1440 minutes representing a full day. The results demonstrate that before compensation, the power deviation fluctuates significantly, often between -50 MW and 50 MW, with peaks reaching 100 MW. This level of deviation is detrimental to grid stability. After the compensation, which involves the coordinated action of the thermal units, energy storage systems, and pumped storage, the deviation is drastically reduced to near zero for most of the day. The maximum error is confined to under 0.4 MW. This confirms that the proposed ENE-based strategy, which occasionally modifies the set-point of the energy storage system for SOC preservation, does not compromise the system’s ability to faithfully follow the dispatch plan.
3.3 SOC Performance Comparison
The core metric for evaluating the proposed strategy is its impact on the SOC trajectory of the energy storage system. The simulation compares three scenarios: the proposed ENE-based control strategy, a traditional fixed SOC limit control strategy, and a scenario with no SOC control at all. The results show a significant difference in the system’s safety margin. The energy storage system without any SOC control experiences a sharp decline in SOC around 18:00. This is a high-risk period because the system continues to discharge due to power system demands. By 21:00, the SOC has dropped below 0.2 (20%), severely limiting the discharging capacity of the energy storage system. If a grid contingency demanded sustained high-power discharge at this point, the system would likely violate its 10% lower SOC limit, triggering a protection lockout and potentially causing a power deficit. The traditional SOC limit control strategy waits until the SOC reaches its predefined lower limit (10%) before it takes corrective action. While it prevents a limit violation, the system operates in a very low SOC region for an extended period. This sustained operation at the boundary stresses the battery chemistry and reduces the depth of discharge available for unexpected events. The proposed ENE-based control strategy demonstrates a clear advantage. It detects the rapid downward trend of the SOC early, around 18:00. By analyzing the ENE index, the system recognizes that the SOC has broken through the lower rail and that the deviation indicator \( D_t^{SOC} \) has exceeded its threshold. Acting preemptively, the control strategy overrides the next few dispatch commands, instructing the energy storage system to charge at a fixed power (10 MW). This corrective action is taken not when the limit is reached, but when the *trend* indicates that the limit is imminent. The result is that the SOC is recovered to a safer level (above 0.2) much sooner. The energy storage system maintains a much healthier charge margin throughout the rest of the day.
| Control Strategy | Action Trigger | Minimum SOC Reached | Risk of Limit Violation | Impact on Battery Health |
|---|---|---|---|---|
| No Control | None | < 0.18 | High (Very close to 10% limit) | Negative (Deep discharge cycle) |
| Traditional Limit Control | SOC reaches 10% | ~0.10 | High (Crisis management) | Moderate (Operates at boundary) |
| Proposed ENE Strategy | Breach of rail + High deviation rate | > 0.20 | Low (Preventive correction) | Positive (Maintains margin) |
3.4 Analysis of the ENE Indicator Behavior
A deeper look into the ENE indicator values throughout the day explains why the control strategy acted at specific times and not others. The simulation confirms that the strategy is selective and intelligent, only acting when the conditions for risk are truly present. For instance, between 12:00 and 15:00, the SOC of the energy storage system temporarily breaks through the lower rail. However, at this time, the deviation indicator \( D_t^{SOC} \) is below the threshold \( D_{max} \). This indicates that the fluctuation is not a sustained trend but merely a short-term excursion. The control strategy correctly recognizes this and takes no action, allowing the system to self-correct and avoiding unnecessary cycling of the power electronics and batteries. Around 18:00, the scenario changes. The SOC not only breaks the lower rail but also does so with a high velocity. The value of \( D_t^{SOC} \) consequently rises above \( D_{max} \). Furthermore, the original dispatch plan for the next intervals indicates a continued discharge. This combination of a breached safety corridor, a high sustained deviation, and an increasingly adverse plan perfectly satisfies the conditions for the lower-half control strategy. The system correctly intervenes. Later, between 21:00 and midnight, the SOC rises sharply. It breaks through the upper rail. However, the SOC is in the lower half of the full range (<50%) at that time. The strategy’s logic specifies that an upper-rail breach is only actionable if the SOC is in the upper half. Since the system is still recovering from its earlier low state, this upward movement is actually beneficial. The control strategy correctly refrains from action. This behavior demonstrates the robustness of the ENE-based control; it does not simply react to any boundary crossing but applies a logical rule set based on the state of the energy storage system and the direction of the threat.
4. Conclusion
This paper has presented a novel SOC control strategy for an energy storage system, drawing inspiration from the Envelope (ENE) index used in financial market technical analysis. The core innovation is the use of a dynamic corridor, defined by the ENE rails, to create a predictive safety zone for the SOC. By integrating a relative position indicator and a deviation indicator, the proposed strategy can distinguish between harmless, short-term SOC fluctuations and dangerous, sustained trends that threaten to cause overcharge or overdischarge. The key feature of this method is its preventive nature. Unlike traditional strategies that react only after a fixed limit is reached, the ENE-based strategy detects the *rate of change* and the *direction* of the SOC trajectory. It preemptively modifies the power command of the energy storage system when the SOC is moving too quickly towards a dangerous boundary, thereby preserving a safe operating margin. The simulation results, based on a realistic energy base model with high renewable penetration, demonstrate the effectiveness of this approach. The proposed control strategy successfully maintains the SOC within a healthier range, avoids deep discharge conditions, and increases the overall charge and discharge headroom of the energy storage system. All of this is achieved without significantly impacting the system’s primary function of tracking the grid dispatch schedule, as the power deviations caused by the corrective actions are kept minimal and are compensated for by other regulating units. Future work could focus on optimizing the corrective power setpoint (e.g., implementing an exponential recovery function rather than a fixed value), integrating economic factors into the control logic, and testing the strategy against a wider range of grid disturbance scenarios.