
1. Principle of maximum power point tracking for solar energy systems
Through research, it has been found that during the power generation process of solar cells, if the working environment temperature or light intensity is changed, the output voltage and output power of the cells will be changed.This is because solar cells are nonlinear and have poor stability.During the working process, using solar cells as a power source will reduce the safety and reliability of the work, which poses a certain risk.Therefore, we need to make solar cells output as much electrical energy as possible under different environments, different temperatures and light intensities, and improve the stability and efficiency of the power generation system.To solve this problem, we must first study and understand the maximum power point tracking problem of solar cells.
So what is the maximum power point of solar cells?We know that the output voltage of solar cells varies under certain environmental temperature and light intensity. When the solar cell reaches its maximum output power, the output voltage at this time is a constant value, and the working point of the solar cell at this maximum output power is the maximum power point.Through the above introduction, we understand the instability of solar cells, and we need to adjust the working point of the solar cell in real time to keep it floating near the maximum power point, so as to improve the reliability and efficiency of the power generation system. This process is called maximum power point tracking (MPPT).
MPPT control is a self-optimizing process that controls the terminal voltage of solar cells to prevent them from being affected by changes in environmental temperature and light intensity, achieving maximum power under any conditions.Maximum power point tracking is the utilization of solar cells to generate electricity with maximum efficiency through certain control devices and control strategies.According to previous work experience, using maximum power point tracking can increase the annual power output of solar cells by 5-20%.In order to effectively utilize solar cells, solar power generation systems can quickly adapt to changes in the external environment, reducing the impact of external factors on power output (such as environmental temperature, light intensity, battery parameters, etc.). It is necessary to track and control the maximum power point, which reduces the instability factors of solar cells and enables them to work stably and efficiently.
1.1 Several commonly used MPPT technologies and comparisons
The importance of maximum power point tracking for grid-connected solar energy systems has been mentioned above, but this algorithm is only a current solution and is not perfect. It is still in its infancy and has much room for improvement. For future energy development projects, we must never slack off and continue to conduct in-depth research on MPPT control methods.
MPPT control methods mainly include the following implementation methods, which we will introduce and analyze one by one:
1). Constant voltage control method
The basic principle of the constant voltage control method is: first, through modeling calculations, the working voltage of the solar cell under certain temperature and light intensity is calculated. This voltage is the voltage at the maximum power point. Next, the calculated voltage can be obtained by adjusting the terminal voltage of the solar cell.These two values are equal. This achieves maximum power point tracking of the solar cell.
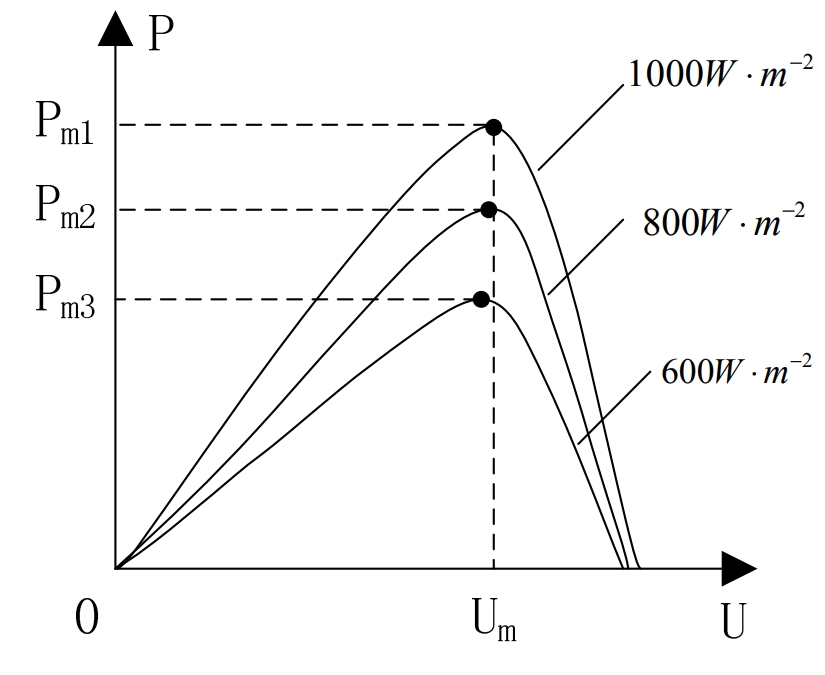
According to Figure 1, when the ambient temperature of the solar cell is a fixed value, the output voltage of the solar cell at the maximum power point is almost a fixed value on the P-U curve under strong light intensity. Therefore, the method of controlling the constant voltage is to control the output voltage U of the photovoltaic array to be constant at the maximum, so that the photovoltaic array works near the maximum power point.
The control strategy of this method is simple and easy to operate, with relatively high reliability, and can be easily implemented through hardware. The system without oscillation has good stability.However, the control accuracy is not satisfactory. Once the working environment changes significantly, especially for regions with rapid temperature changes in the morning and evening and large temperature differences between seasons, the solar cell controller loses the function of automatically tracking the new value of the maximum power point of the solar cell, resulting in a large loss of energy and self-optimization.This situation can only be resolved through manual intervention.With the digitalization and microprocessorization of MPPT technology, the constant voltage control method will gradually withdraw from the historical stage.
2). Power feedback control method
People invented the power feedback control method to solve the defects of the constant voltage control method and to find the new maximum power point as soon as possible.Its basic principle is: by collecting the DC current and DC voltage of the solar cell array, using hardware or software multipliers to calculate the current output power P, and comparing the current output power P with the last memory of output power P, the output voltage is adjusted.Because the array with the same P value based on voltage and current values is not the only one for the controller, the power feedback control method should be designed as a single-value control method, that is, only the curve within the control range of the power P peak is the control range.
Generally, each method has its advantages and disadvantages. The power feedback control method can reduce energy consumption and is convenient in practical operations. Although it can improve work efficiency, it has poor stability and reliability, which poses risks to practical work and requires caution in use.
3) Disturbance observation method
The disturbance observation method is also known as the climbing method. The working principle is to collect and obtain the output current and voltage of the solar cell, multiply them to calculate the output power, and then add it to the voltage disturbance to calculate the output power. At this point, the comparison of the two power sizes: when the power increases, it indicates that the direction of the disturbance is correct, and it can be operated in this way;if the power is reduced, it represents that the direction of the disturbance is wrong, and it will change direction.Then repeat the final operation, increase the voltage disturbance, and finally achieve the maximum output power of the PV cell.
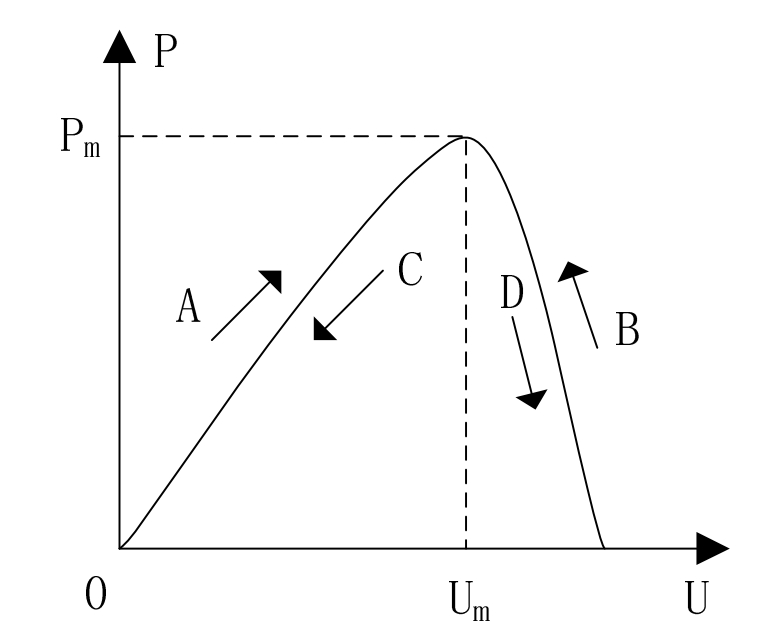
As shown in Figure 2, if a positive voltage disturbance is added here, if the disturbance increases the output power (as shown in the direction of A), then continue to increase the disturbance to gradually approach the maximum power point voltage Um to achieve maximum power point tracking;if the disturbance decreases the output power (as shown in the direction of D), then a negative voltage disturbance should be added to make the operating point approach the maximum power point Pm. Assuming that a negative voltage disturbance is added here, if the disturbance increases the output power (as shown in the direction of B), then continue to increase the disturbance to make the operating point approach the maximum power point Pm;if
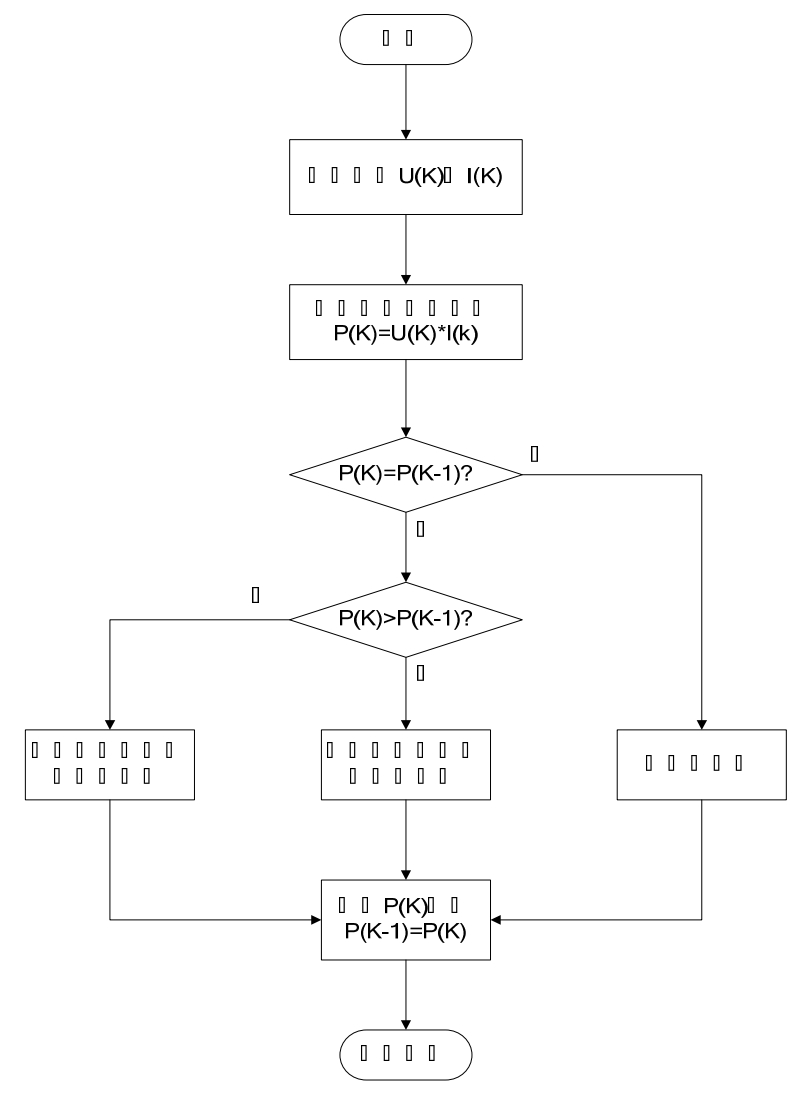
If this disturbance quantity reduces the output power (as shown in the direction of power increase in direction C), a positive voltage disturbance quantity should be added to bring the operating point closer to the maximum power point Pm. Figure 3 is a control flow diagram for the disturbance observation method. This method has a relatively simple structure, requiring only the measured output current and voltage, both of which are relatively easy to implement in hardware.However, when the operating point reaches the maximum power point, the voltage disturbance of the controller will not stop, which will cause the operating point to experience shocks and never stabilize at the maximum power point. This will result in significant energy loss and affect the tracking speed. The size of the disturbance quantity will directly affect the magnitude of the energy loss.
4). Conductance increment method
The conductance increment method is a maximum power point tracking method for determining the direction of regulating the output voltage of a photovoltaic array. Its calculation method compares the dynamic conductance value at the output end of the photovoltaic array with the negative value of the static conductance at that time.
We know that power can be expressed by the formula P = U × I. Differentiating both sides of the equation, we obtain:
Where, the difference between the current before and after the panel increment is represented by dI, and the difference between the voltage before and after the panel increment is represented by dU.
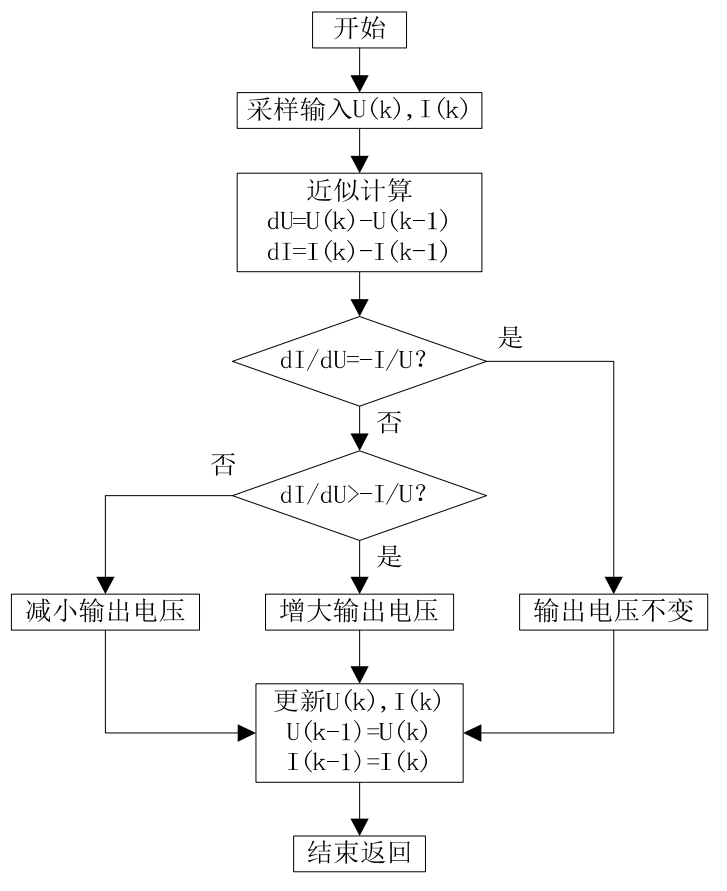
According to the voltage-current characteristics of solar cells, when dP/dU = 0, that is, dl/du = -I/U, the solar panel is operating at the maximum power point.When dI/dU≠ −I/U, the solar panel is not operating at the maximum power point, and there are two situations: one is when dl/dU < −I/U, the value of U is slightly larger than the voltage at the maximum power point, at this time, the disturbance should be reduced to find the maximum power point.The other is when dI/dU> −I/U, the value of U is smaller than the voltage at the maximum power point, at this time, the disturbance should be increased to find the maximum power point.
Adjusting the operating voltage of solar cells to achieve maximum power point tracking, it can determine the relationship between the voltage at the operating point and the voltage at the maximum power point. The conductance incremental method is the optimization of disturbance observation.The advantage of this method is that if the environment encounters sudden changes in the natural environment, the output voltage tracking speed of solar cells is relatively fast, and the tracking stability is quite high.However, in determining whether to control the incremental conductance method to determine whether more operations are needed, the control algorithm is relatively complex, and high requirements for the control system make it difficult to implement the hardware controller.
1.2 Simulation study using perturbation observation method
Here, based on the introduction of the disturbance observation method above, we use MATLAB to simulate it. The simulation model diagram is shown in Figure 5 below.
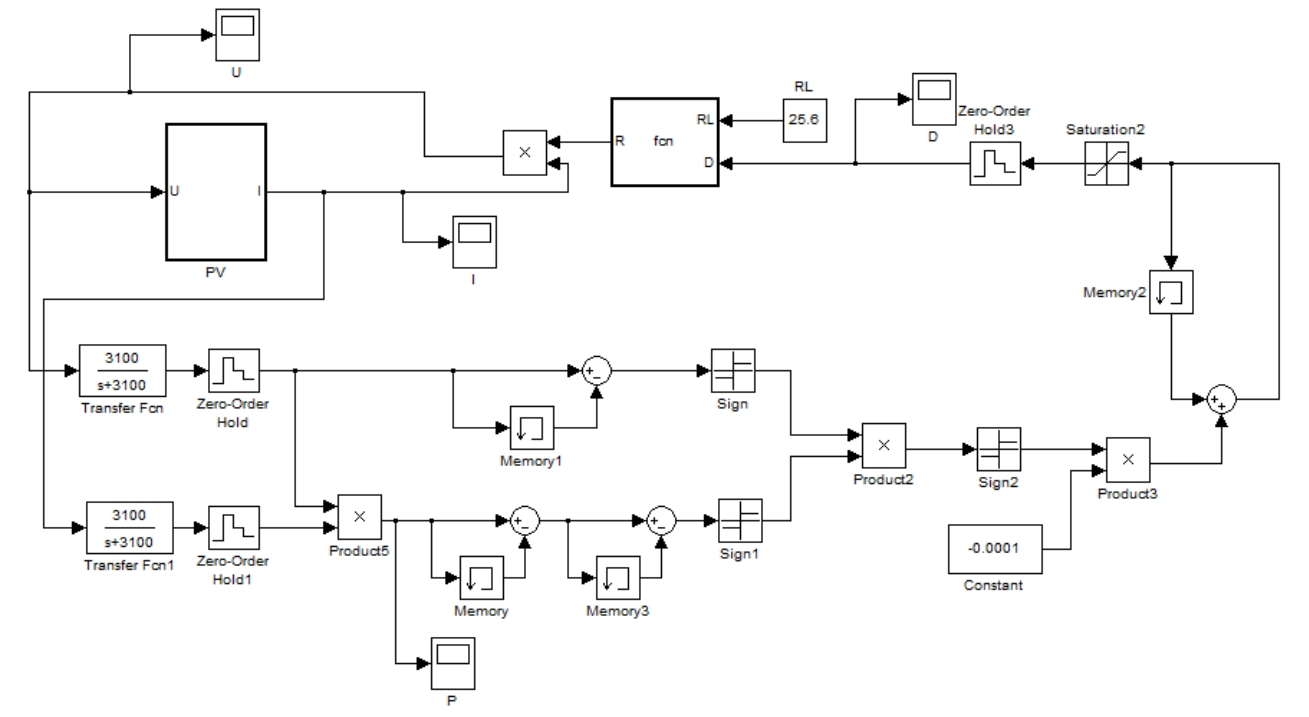
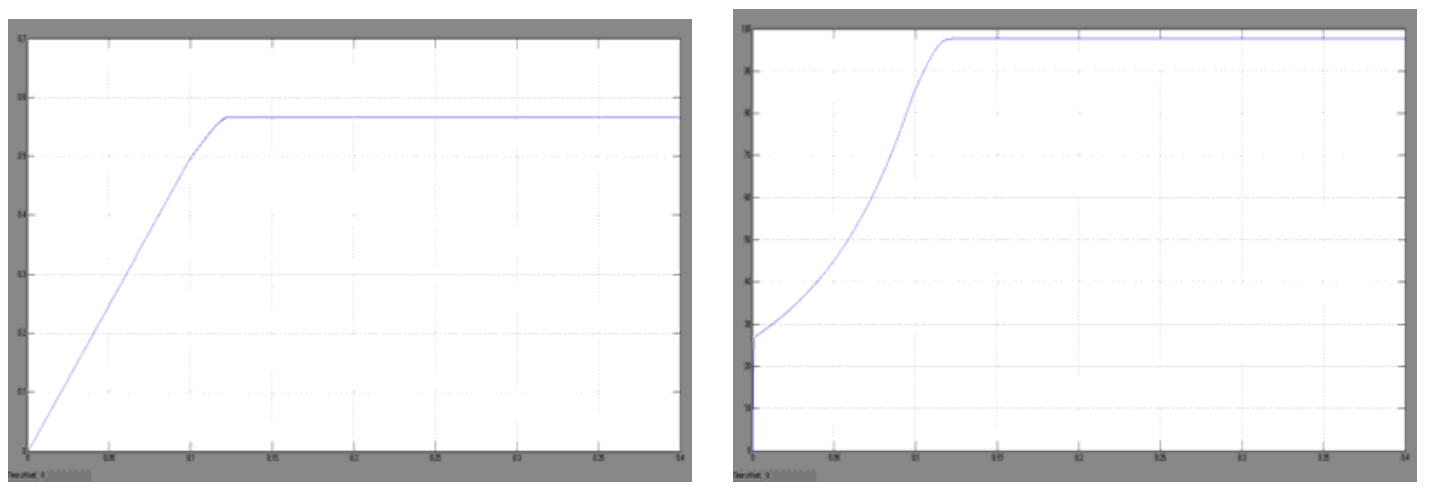
The simulation results are shown in Figures 6 to 9. Figure 6 shows the voltage U variation curve of the MPPT disturbance observation method, Figure 7 shows the current I variation curve of the disturbance observation method, Figure 3-8 shows the duty cycle D variation curve of the disturbance observation method, and Figure 9 shows the power P variation curve of the disturbance observation method.
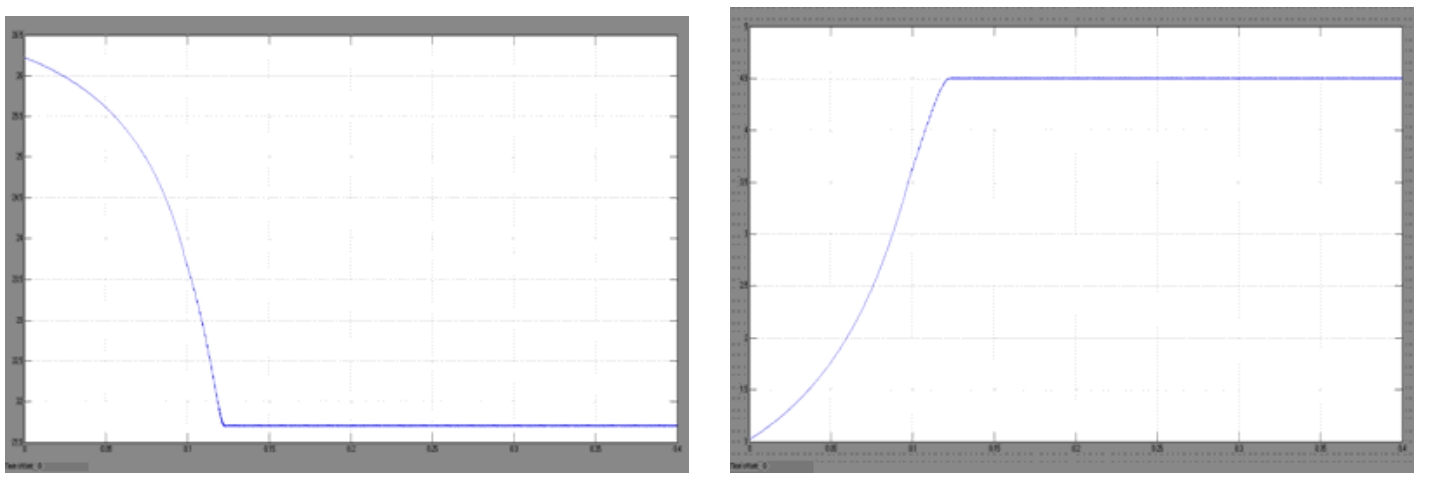
The simulation time is set to 0.1 seconds, the light intensity is 1000W/m2, the temperature is 25℃, the simulation algorithm is variable step size ode45, and the load resistance is 25.6Ω. The duty cycle disturbance step power change step size determines the system response. If the step size is small, the system response is slow but relatively accurate;if the step size is larger, the system response speed is fast but the accuracy is not high.When the duty cycle disturbance step size is 0.002, the simulation graph shows a satisfactory effect.
2. DC-DC converter circuit for MPPT
In photovoltaic power generation systems, the output power is easily affected by the external environment. Usually, a DC/DC converter is connected between the photovoltaic array and the load.The DC/DC conversion circuit is actually a load impedance matcher for photovoltaic cells and loads. It has two main functions: one is to act as a maximum power point tracking controller, which adjusts the equivalent input impedance of the solar cell in the system to receive and make the photovoltaic power generation system work at the maximum power point;the second is to control the output voltage of the solar cell.The DC/DC conversion circuits used in the maximum power point tracking controller of photovoltaic power generation systems mainly include buck converters, boost converters, and buck-boost converters.
DC/DC converter is a load impedance matcher, and the matching process is to apply the output signal to generate the system control signal of PWM wave to the converter, control the switch tube to turn on and off, and achieve the equivalent input impedance matching the internal resistance of the battery, that is, using the control duty cycle to achieve maximum power tracking.
2.1 Operating principle of Boost converter
The DC converter in this project uses a Boost circuit.The boost circuit can operate under continuous input current conditions, as long as sufficient inductance is input, the ripple current on the inductance will be small enough to approximate a smooth DC current, so you only need to add a small capacity of non-inductive capacitors, or even a capacitor with no capacity, to avoid the disadvantages of capacitors.At the same time, the boost circuit is very simple, because one end of the power switch is grounded, so it can be more convenient for the design of the drive circuit.Usually, the output voltage of a small solar photovoltaic power generation system during the entire working process is less than 50V, while the grid-connected voltage is 311V.Therefore, in order to meet the requirements of grid connection, a boost converter needs to be added between the solar panel and the grid-connected inverter.
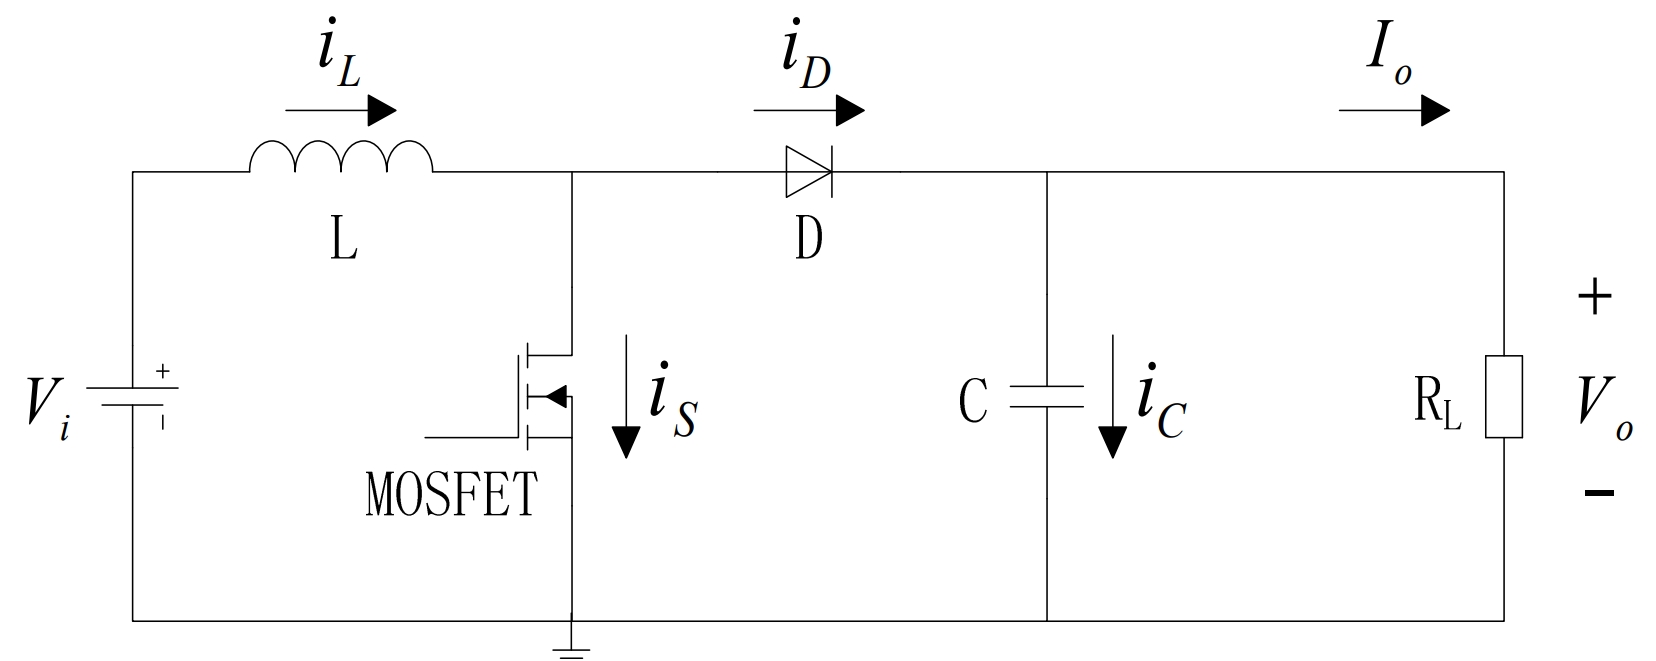
The Boost converter is a single-tube DC converter with an output voltage higher than the input voltage. Its circuit topology is shown in the figure below, consisting of inductor L, diode D, switch T, load R, photovoltaic array, and capacitor C.
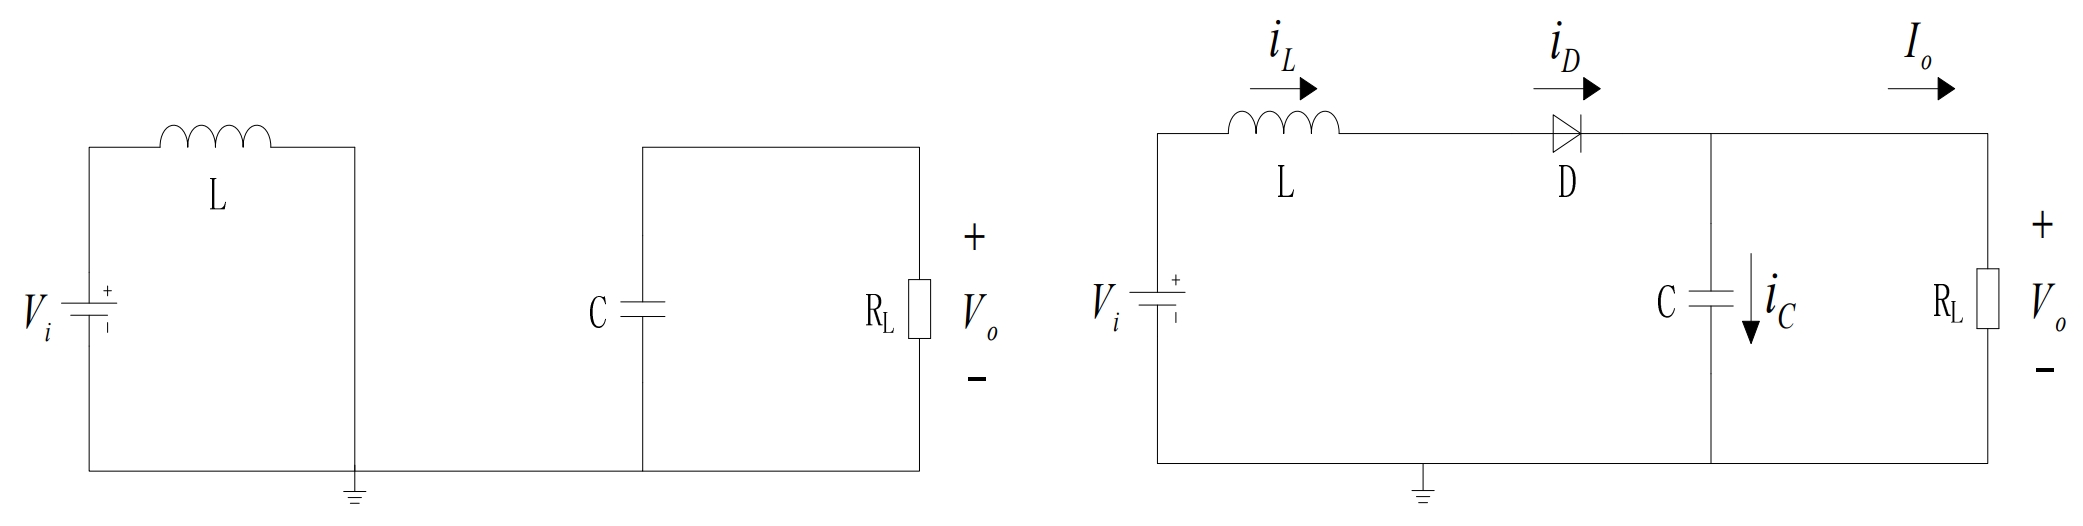
Working principle: The converter has two working modes: inductor current discontinuous mode and inductor current continuous mode.Assuming that the converter works in the continuous mode, when the switch tube T is on during the on period t, the circuit is equivalent to Figure 2(a) below, and the diode D is reverse biased and turned off. The power supply U s passes through the on switch tube T to the energy storage inductor L for energy storage, and the filter capacitor C starts to discharge and supply power to the load resistance R. When the switch tube T is off during the off period t, the circuit is equivalent to Figure 2(b) below, and the diode D is forward biased. The energy storage inductor L and the power supply Vi simultaneously flow through the freewheeling diode D to supply power to the load resistance R, and the filter capacitor C is charged.
In a cycle Ts, the energy stored and released by the energy storage inductor L is equivalent in a stable working state of the circuit.For the above circuit, the following expression holds:
After sorting out, the output expression of the Boost circuit can be obtained as:
Where, D is the duty cycle of the switch tube conduction, 0 < D < 1.
Through the above data analysis and calculation, we obtain 1/(1-D) ≥ 1, so the output voltage U0 is greater than the supply voltage Us, therefore, this circuit is called a boost circuit.
2.2 Boost converter device selection
1). Selection of energy storage inductance L
The inductance L of the circuit plays a role in energy transfer and filtering. When the inductance current is the input current, the fluctuation of the inductance current is directly related to the electromagnetic compatibility, the magnitude of the ripple current, and the operating noise index of the circuit. Therefore, the smaller the current fluctuation, the better.In a boost converter, the inductance should be as low as possible while meeting the normal system requirements. This not only reduces the switching loss, but also reduces the ripple current, thereby reducing the requirements on the device.Assuming that the switching frequency fs, the load impedance R, and the relative ripple factor of the inductance current are δ, the expression of the relative fluctuation of the inductance current can be described by δ:
During the on-time of the switch tube ton, it can be known that:
The current change is:
the formula for calculating the input inductance is:
When δ < 1, the Boost circuit operates in current continuous mode;when δ > 1, the Boost circuit operates in current discontinuous mode;when δ = 1, the Boost circuit operates in critical continuous mode.When the inductance value range is L>R*D(1-D)^2 / fs, the Boost circuit can be ensured to operate in current continuous mode.
2). Selection of filter capacitor C
When the switch tube is in the off state, the diode D is forward conducting, discharging through the capacitor C to maintain power supply to the load resistor R, reducing the voltage of the capacitor and forming a ripple voltage.Calculate the ripple factor:
When the switch is on during ton, the capacitor C discharges, and IC = I0.From:
the calculation formula of the filter capacitor C can be determined as follows:
3). Selection of switching device MOSFET
The rated current of the switch tube should be greater than the maximum value of the peak current of the inductor, and the voltage rating should be greater than the output voltage.This system uses power field effect transistors, which are majority carrier conducting and do not have memory effects, resulting in short energy storage time, low switching loss, fast rise and fall speed, and can operate at relatively high switching frequencies.Here, we choose the n-channel enhancement MOSFET power tube IRF840, which is suitable for DC-DC conversion circuits operating at high frequencies. At high frequencies, its on-state resistance is 0.85Ω, current is 8A, rated voltage is 500V, and power loss is very low.
4). Selection of diode D
The selection of diodes should fully consider the following parameters: the operating speed of the switch, the forward voltage drop, the reverse voltage drop, and other related factors.The reduction of the forward voltage drop will increase the high power loss, and the diode will disconnect for a long time, which will affect the conversion efficiency of the converter, and may even produce overvoltage, which will increase the voltage in an instant, causing serious damage to the components.In addition, the diode must have a high reverse voltage.Through the above analysis, it can be concluded that the diode MUR3060 is suitable, with a reverse voltage of 600V and an operating current of 30A.
3. Boost converter to achieve MPPT impedance matching
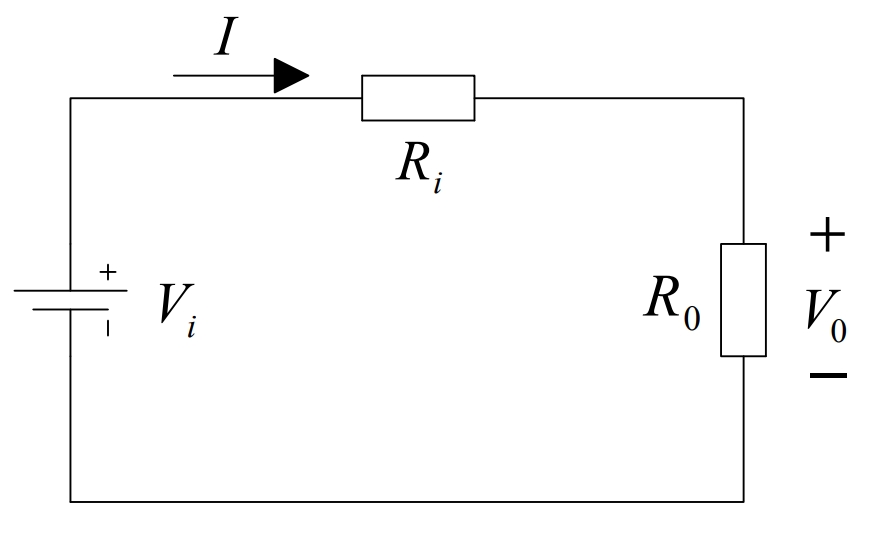
As shown in the figure, the upper figure is a linear circuit diagram, where Vi is the supply voltage, Ri is the internal resistance of the power supply, and R0 is the load resistance. The power consumed by the load resistance R0 is:
Differentiating R0, we obtain:
Let dP/dR0=0, that is, Ri=R0, and the value of power P is maximized at this time.
In linear circuits, when the load resistance R0 equals the internal resistance Ri, the power supply will output maximum power P. Although solar cells and boost circuits are nonlinear, they can be treated as linear circuits in a small range.In this way, by adjusting the equivalent input impedance R of the boost circuit so that it is always equal to the solar cell internal resistance Rs, the solar cell array can achieve maximum power output and achieve maximum power tracking of the solar cell.
Next, we can analyze whether it is possible to achieve maximum power output of the solar cell array by changing the impedance when the load impedance connected to the Boost converter is an arbitrary value.
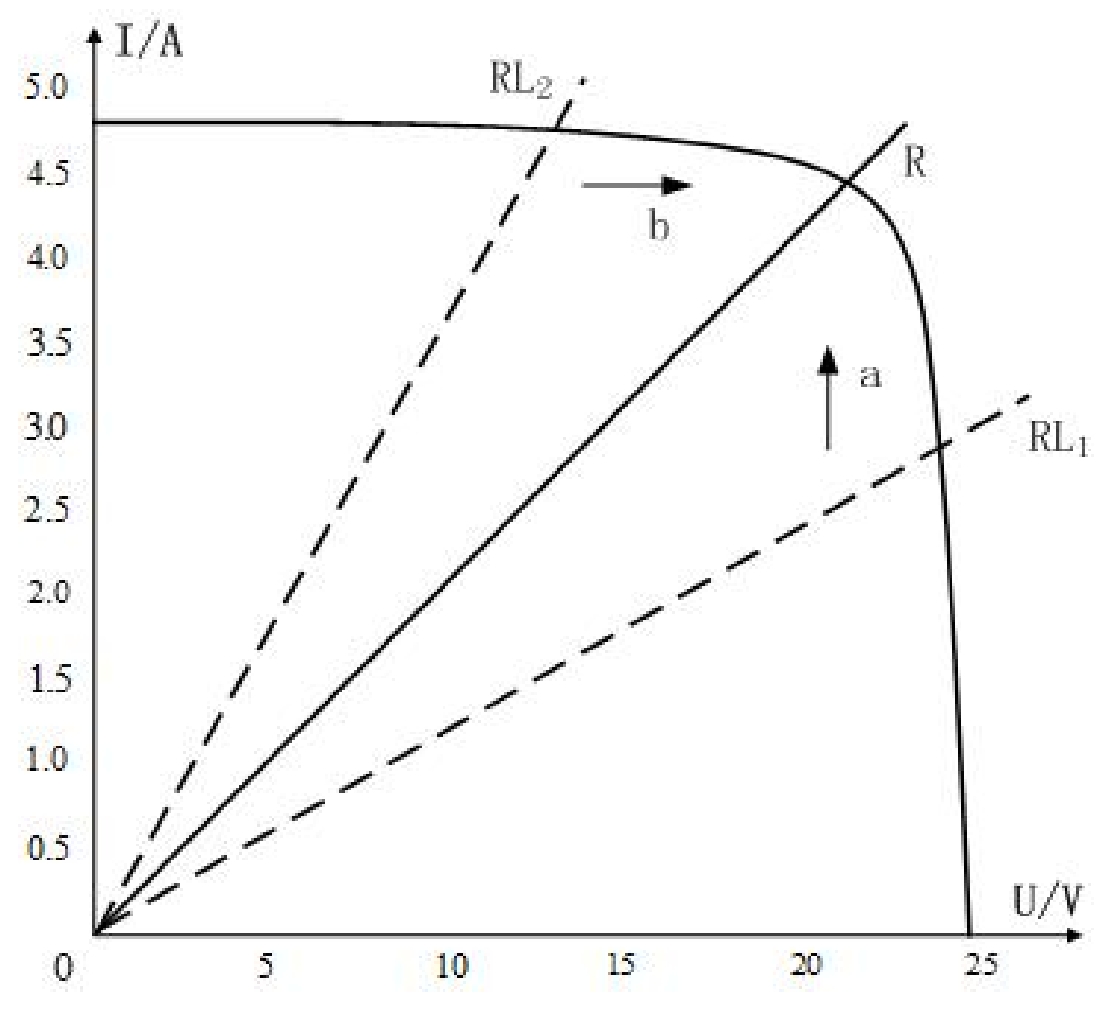
From the formula R = (1-D)^2 * RL, it can be seen that (1-D)^2 <1, indicating that the Boost converter can only convert larger load impedances to smaller equivalent input impedances.As shown in the figure below, R is the equivalent input impedance of the Boost circuit, RL1 is the larger (RL1 > R) load impedance of the Boost converter, and RL2 is the smaller (RL2 < R) load impedance of the Boost converter.The Boost converter can adjust the duty cycle D to shift the load line RL1 in the direction of a to achieve the equivalent input impedance R, but cannot adjust the duty cycle D to shift the load line RL2 in the direction of b to achieve the equivalent input impedance R.
4. Simulation study
According to the specifications of the selected solar cell, we choose 14 solar cells of the same specifications to be connected in series.Using the above solar cell simulation parameters, we obtain the output voltage U0 = 700V, input voltage Us = 21.7×14V = 303.8V, inductor current ripple factor δ =0.2, switch tube frequency = 10kHz s f, load resistance R = 25.6Ω, output voltage ripple factor γ =0.006, and switch tube duty cycle D =1−Us /U0 =1− 303.8/ 700 = 0.566.
The inductance value in the current continuous mode can be calculated using the inductance formula derived above:
According to the capacitance calculation formula derived above, the capacitance value in the current continuous mode can be obtained as follows:
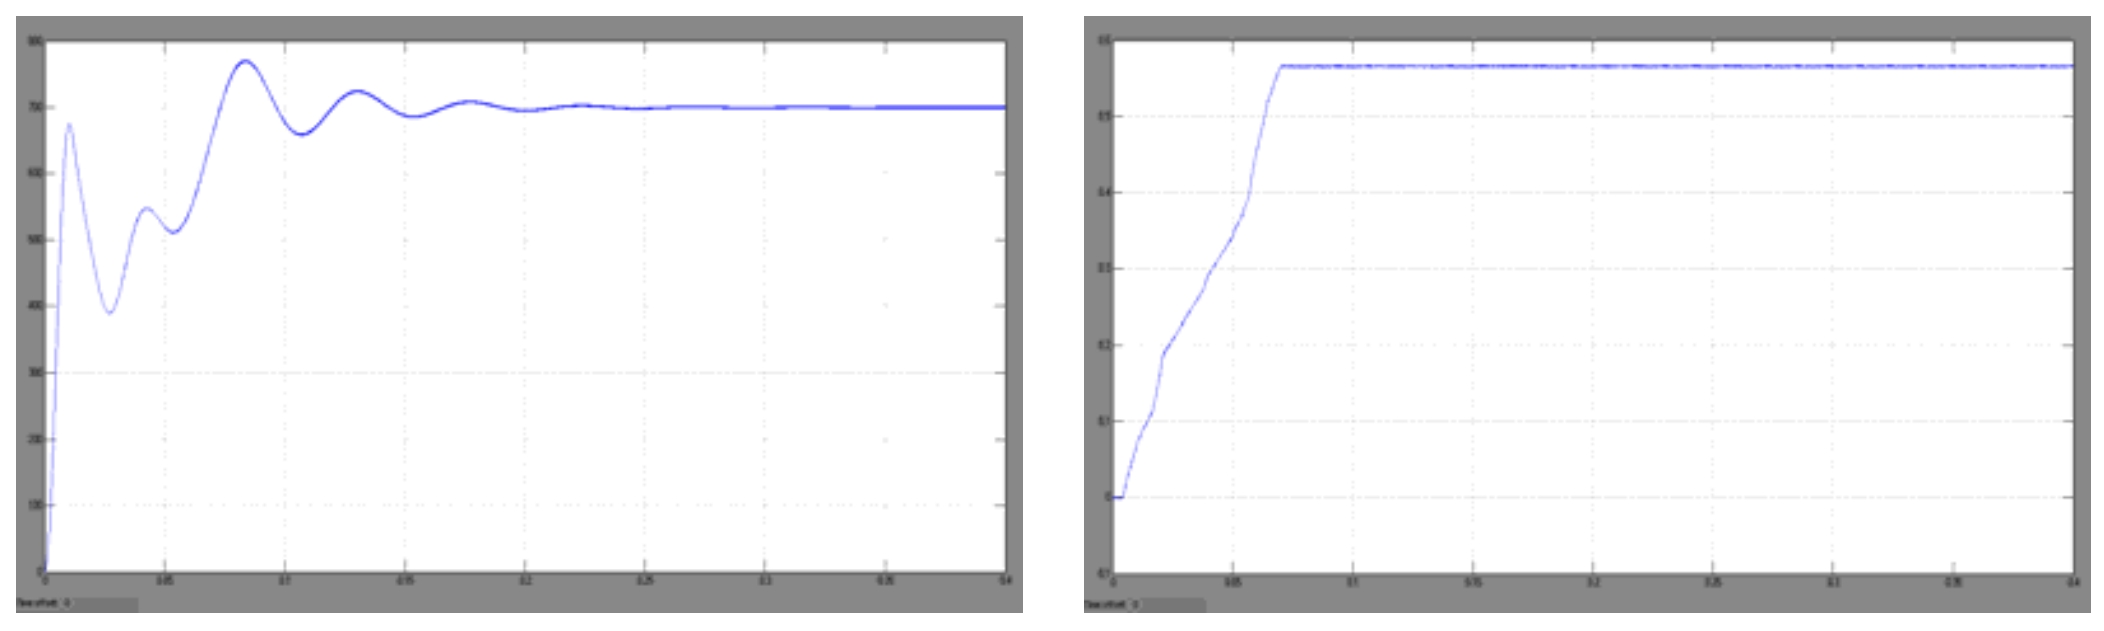
In the Matlab/Simulink simulation environment, a simulation model of the Boost converter is established as shown in Figure 14.The simulation time is 0.4s. After simulation debugging, when the capacitance value is taken as 1000μF and the inductance value is taken as 10mH, a good circuit simulation effect can be obtained.The simulation waveform of the output voltage of the Boost converter is shown in Figure 15.
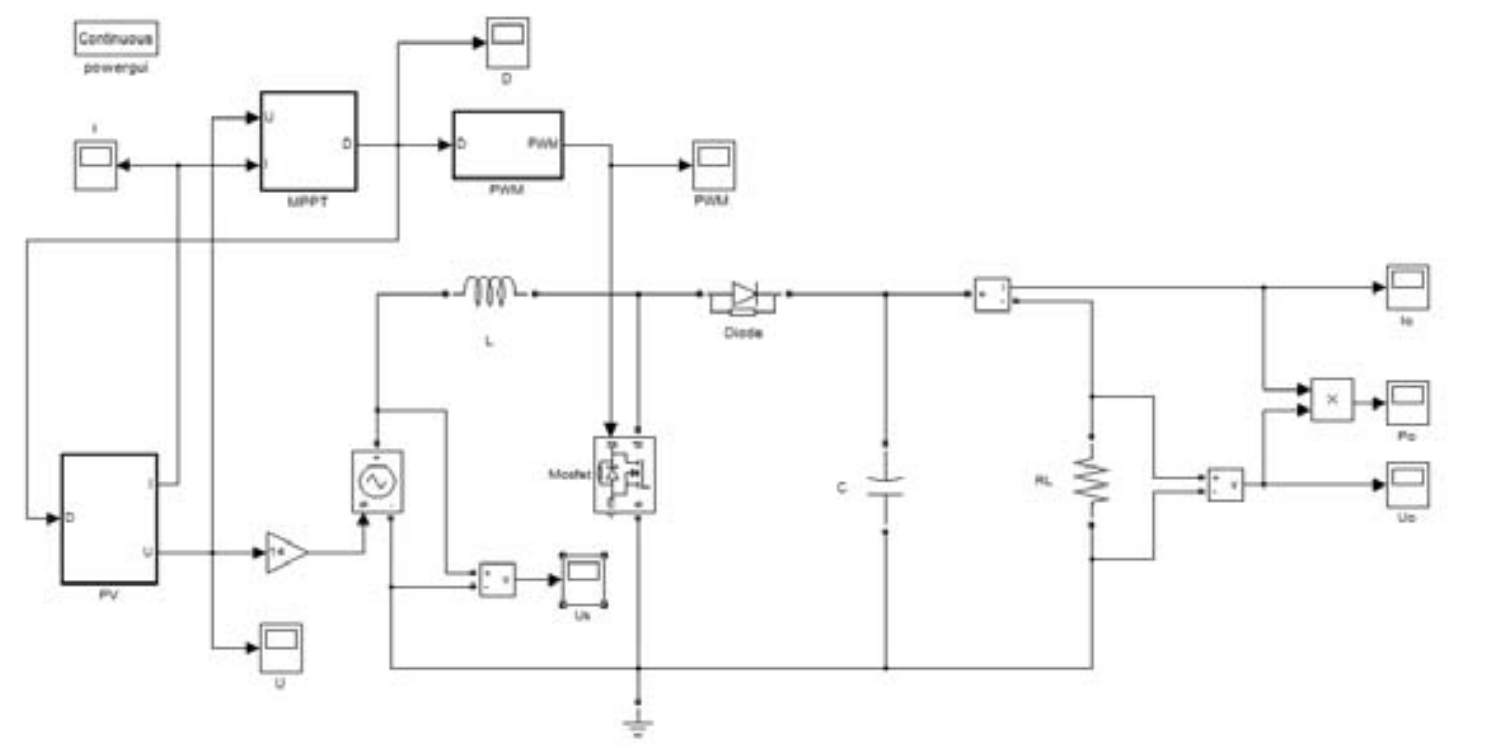
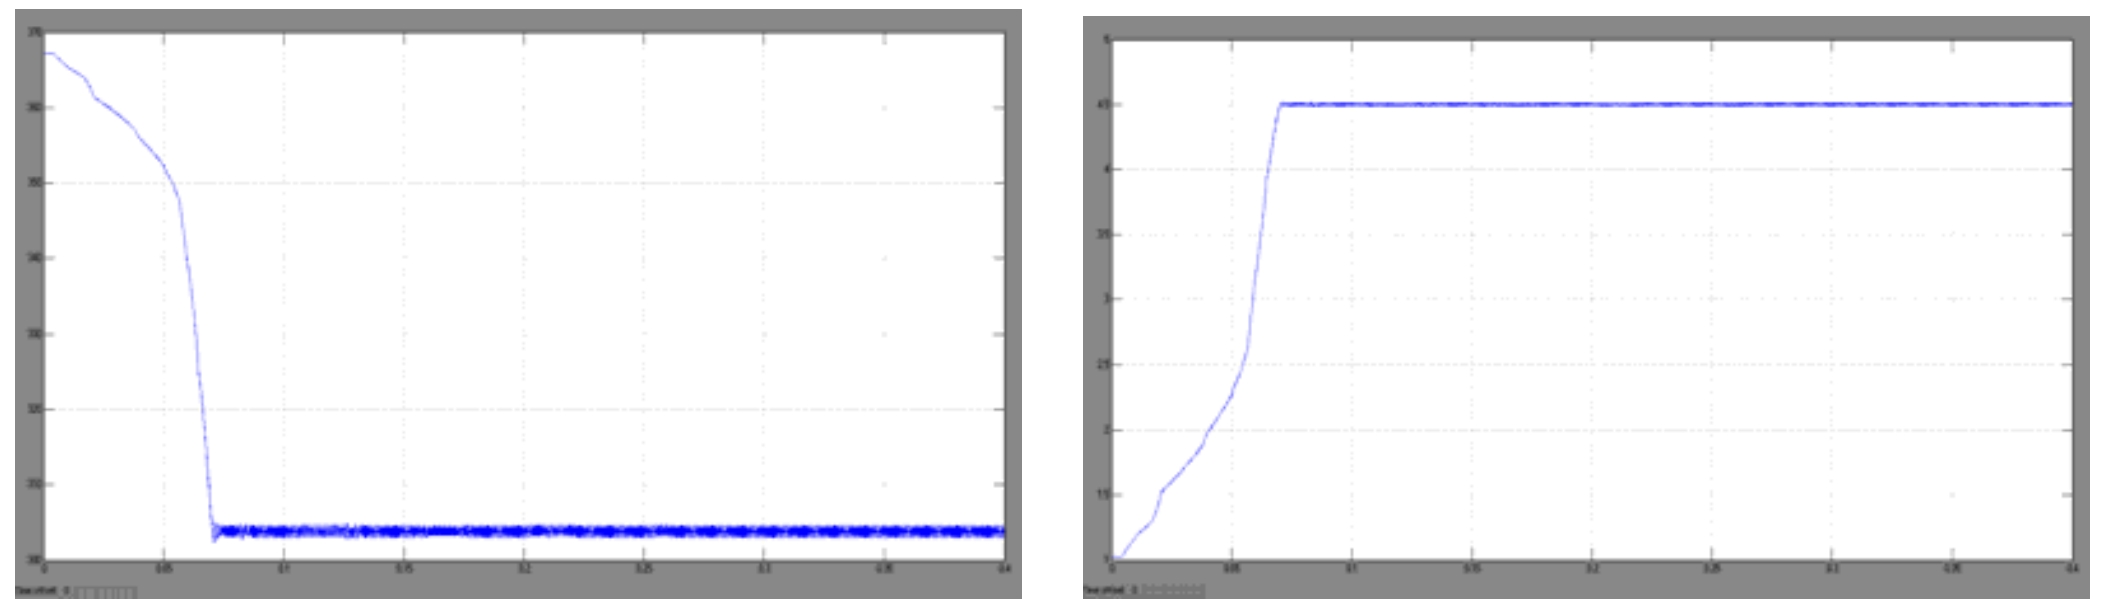
Figure 16 shows the simulation waveform of the duty cycle D. Figure 17 shows the simulation waveform of the input voltage Us. Figure 3-18 shows the simulation waveform of the input current s I.
5. Summary
In this chapter, the basic principle of maximum power point tracking is mainly discussed. By comparing the advantages and disadvantages of several commonly used methods, several commonly used maximum power point tracking methods are explained in more detail, and the disturbance observation method is selected to combine with solar cell modules for simulation research.Secondly, the DC/DC converter is selected to study its working principle. Based on analyzing the transformation circuit to achieve MPPT of photovoltaic array through impedance transformation, a simulation model of MPPT of photovoltaic array is established.