
To meet the requirements of industry policies and technical specifications, various new energy stations are gradually establishing supporting energy storage stations to enhance their ability to track planned output and suppress fluctuations. However, operational economy is one of the important indicators for measuring the performance of energy storage power plants. How to coordinate the output of energy storage and new energy sources such as wind/light to achieve the goal of optimized operation requires corresponding economic optimization scheduling strategies to ensure it. This is also a research hotspot and practical engineering demand in the current power industry.
Currently, there is a considerable amount of research on optimal scheduling strategies for combined solar and wind storage power plants. Reference [1] has derived a mathematical model for calculating battery discharge losses, and dynamic programming based on Lagrange relaxation and interior point method is used in scheduling models considering discharge losses. Reference [2] based on the battery discharge loss model, further considers the problem of selecting the charging and discharging circuit path faced by large-scale energy storage batteries, and proposes a refined power allocation strategy for energy storage batteries. Based on the power allocation strategy of energy storage batteries, reference [3] establishes a LLI-LAM composite cycle capacity loss model that takes into account the impact of temperature on battery loss costs, and obtains an economic optimization scheduling strategy for energy storage power plants. The above literature has conducted many in-depth explorations in the economic scheduling of energy storage power stations, but has overlooked the use of power station temperature regulation systems to actively adjust the operating temperature of batteries to reduce battery loss costs and optimize the economic scheduling of energy storage power stations.
This article aims to address the aforementioned issues and propose an economic scheduling strategy for energy storage power plants, with the goal of minimizing the scheduling cost. This strategy considers the thermal management of energy storage power plants and the relationship between battery temperature and capacity. On the basis of considering the full life cycle cost of the battery, this scheduling strategy also comprehensively considers the variation of the chemical battery capacity that constitutes the energy storage system with temperature, as well as the impact of this effect on the battery life loss cost. A scheduling model that actively reduces battery loss using a temperature regulation system is constructed. To meet the application requirements for solving speed and accuracy in real-time scheduling within the day, piecewise McCormick is used to linearize the bilinear term and solve it using the Gurobi tool. The optimized scheduling results are expected to ensure the economic operation of the power plant. Finally, a comparative analysis was conducted between commonly used scheduling strategies and the proposed scheduling strategies, verifying their effectiveness and superiority.
1. Optimal scheduling model for renewable energy joint storage power plants considering thermal management
1.1 Renewable Energy Joint Storage Power Station Power Generation System
The general renewable energy joint storage power station power generation system includes renewable power sources such as photovoltaic/wind power, power scheduling system, temperature monitoring system, and multiple battery systems. Its structure is shown in Figure 1.
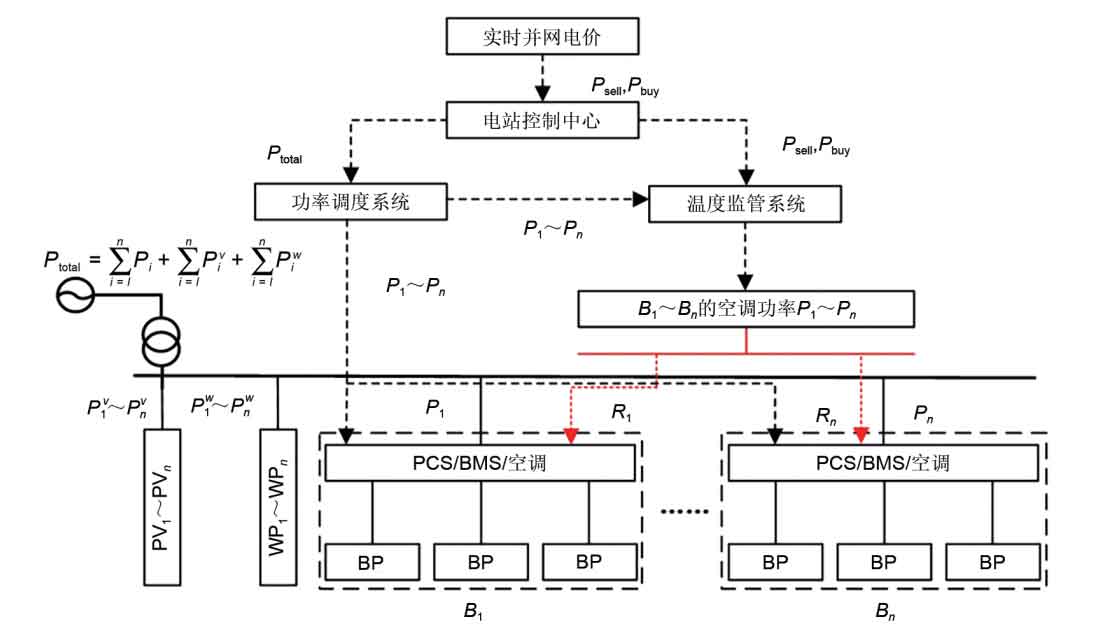
In Figure 1, Psell represents the real-time grid connected electricity price; Ptotal represents the total power of the entire station; B1 to Bn represent n independent containerized battery systems; P1 to Pn and R1 to Rn represent the battery power and air conditioning power of each independent battery system, respectively. Pv1 to Pvn represent the output of PV1 to PVn photovoltaic power plants, and P w1 to P wn represent the output of WP1 to WPn wind farms. Among them, each independent battery system includes an energy storage converter (PCS), a battery management system (BMS), a battery pack, and a battery temperature regulation system. The temperature regulation system adjusts the operating environment temperature of the battery pack based on the current environment, battery physical characteristics, and power scheduling situation. The control center of the energy storage power station dispatches the power within the station based on the real-time grid connected electricity price released by the power grid. The temperature supervision system comprehensively considers the battery operating efficiency, current environment, air conditioning costs, and battery physical characteristics to control the heat generation/exhaust power of each independent battery system.
Analyzing the various systems of energy storage power plants, it can be seen that their operating costs are mainly divided into labor costs and equipment operation and loss costs. Based on the analysis of the operating and loss costs of the equipment that accounts for a large proportion, it can be found that the electrical energy costs required for generating/discharging heat in the temperature regulation system and the life loss costs of battery charging and discharging need to have high optimization value.
In the aforementioned combined power generation system, batteries can cause heat dissipation, leading to an increase in temperature. However, the cost of battery loss is directly related to the capacity of energy storage batteries, which are highly sensitive to environmental temperature. Therefore, it is necessary to consider the operating environment temperature of the batteries inside the container in conjunction with the real-time power of the batteries, in order to achieve a joint economic dispatch that takes into account the cost of battery life loss and the cost of temperature regulation systems. At present, there are few research results in this area. In fact, the internal temperature of the container type energy storage box is determined by two parts: heat load and cooling capacity. The thermal load package includes solar radiation power, electrical thermal power inside the box, battery heating power, and thermal power generated by the temperature regulation system, while the cooling capacity is only the cooling power of the temperature regulation system. To achieve the joint optimization of battery life loss cost and temperature regulation system cost mentioned above, this paper establishes a thermal load model for a box type energy storage station based on the relationship between battery temperature and capacity, and applies it to an economic scheduling strategy considering battery life loss cost.
1.2 Thermal Power Balance Model for Box Battery Modules
In order to calculate and predict the environmental temperature of battery operation in real-time, it is necessary to comprehensively consider the heat generation/exhaust power of each part within the box type energy storage battery module. Therefore, the heat generation power, the heat conduction power inside and outside the heat generation box, the heat power of the electrical appliances inside the box, and the heat generation/exhaust power of the air conditioning need to be balanced, as shown in the formula.

In the formula, QB represents the thermal power generated by battery loss; QEV represents the thermal power of container to external heat conduction; QG represents the thermal power emitted by computers and lighting equipment inside the container, usually taken as a rated value (3 kW); QA is the air conditioning production/heat removal power.
Direct sunlight on the surface of containers can cause additional temperature rise on the surface. In theory, this effect exists on both the four sides and the top of the container. However, due to the short duration of solar radiation on the sides and the small angle between sunlight and the sides, the temperature rise effect on the top of the container relative to direct sunlight can be ignored. Therefore, for the top of the container, this temperature rise effect can be calculated using Equation (2).
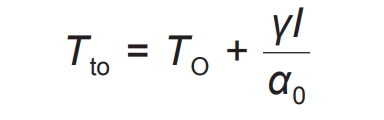
In the formula, TO is the temperature of the air outside the box; γ Is the absorption coefficient of solar radiation at the top of the box; I is the solar radiation intensity in the normal direction of the box top; Tto is the temperature at the top of the container, α 0 is the heat transfer coefficient between the air and the surface of the box, usually taken as 5.
After considering the temperature rise generated by solar thermal radiation, QEV can be calculated by dividing it into top and side, as shown in the formula:
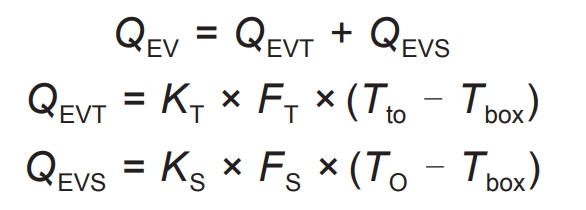
In the formula, QEVT and QEVS respectively represent the thermal power transmitted by the top and side of the container; KT and KS represent the top and side heat transfer coefficients of the container, while FT and FS represent the top and side area of the container, respectively; Tbox represents the temperature inside the container.
Due to the efficiency of battery charging and discharging being less than 1, the loss is generally dissipated in the form of heat to the external environment. Therefore, QB can be calculated by the formula:

In the equation, η Charge and discharge efficiency of the battery; Pcha and Pdischa represent the charging and discharging power of the battery, respectively.
In addition, the temperature management system will adjust the temperature to generate or eliminate heat, as shown in the formula.

In the formula, PA represents the power of the temperature management system; H represents the temperature regulation coefficient. By using the above formula, the temperature inside the box can be predicted online in real-time, providing a basis for adjustment for joint economic dispatch.
1.3 Charging and discharging loss model considering energy storage life
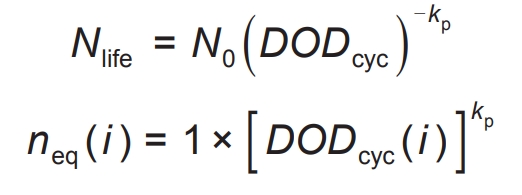
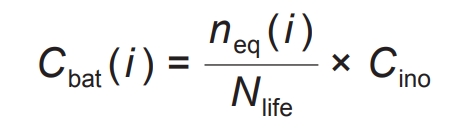
In order to achieve economic scheduling that takes into account the cost of battery life loss, in addition to considering the temperature prediction mentioned above, charging and discharging will also cause battery life loss, which will have an undeniable impact on economic scheduling. So in the scheduling decision-making process, it is also necessary to fully consider the battery life loss. Therefore, it is necessary to construct a reasonable charging and discharging loss model. Taking lithium-ion batteries as an example, during the process of recycling, the loss of lithium-ion activity and electrode surface side reactions can reduce the battery’s charging and discharging capacity, based on which the cost of battery charging and discharging loss can be considered. As shown in the formula, the number of cycles varies with the depth of discharge, resulting in different battery losses for different discharge depths. Further unifying the conversion of cycles with different discharge depths can obtain the corresponding equivalent number of full cycles, as shown in the formula. From this, the cost of battery charging and discharging losses during each time period can be calculated, as shown in the formula.
In the formula, Nlife represents the number of cycles that the battery can cycle throughout its entire life cycle; N0 represents the number of cycles that the battery can charge and discharge at its maximum discharge depth, and DODcyc represents the depth of charge and discharge during battery operation; Kp is the fitting parameter; Neq (i) represents the equivalent number of complete cycles corresponding to time i; Cino represents the cost of battery construction; Cbat (i) represents the cost of charging and discharging losses during the corresponding period.
2. Economic scheduling strategy that takes into account the cost of temperature regulation and battery life loss
2.1 Economic dispatch objective function
At present, the starting point for the allocation of energy storage capacity in new energy stations is to achieve overall economic optimization while meeting the requirements of grid operation. At present, there are various scenarios for the application of energy storage in new energy stations. This article considers the scenarios of stabilizing output and fully utilizing the time of use electricity price. In this scenario, based on the principle of optimal economy, the following objective function is proposed:
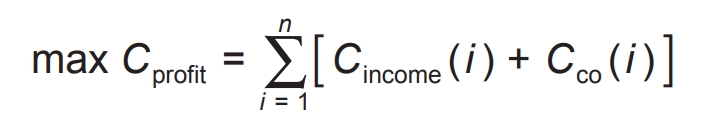
In the formula, Cprofit represents the net income on the operating day; Cinome (i) represents various returns during the i-th period; Cco (i) represents the cost of the power plant at time i, and the calculation formula for both is shown in the formula.
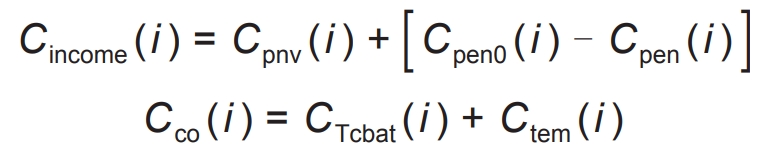
In the formula, Cpen (i) is the penalty caused by the assessment of electricity consumption at time i; Cpen0 (i) represents the penalty amount imposed on the power station when there is no energy storage at time i; Cpnv (i) represents the peak valley arbitrage yield at time i; CTcbat (i) is the battery life loss cost corrected by the battery temperature capacity relationship at time i (to be provided in this section); Ctem (i) is the cost of temperature regulation at time i. The above formula establishes a profit calculation model that includes temperature regulation costs and corrected battery life loss costs.
(1) Track the benefits of planned output
Due to the drastic fluctuations in output and unstable power generation of renewable energy represented by wind power and photovoltaic, the power system is susceptible to operational safety issues. Therefore, relevant documents have been issued in the central China region to constrain and assess the output of renewable energy. To adapt to the constraints of new rules on renewable energy stations, this article utilizes energy storage systems to suppress fluctuations in renewable energy output and ensure the stability of power grid operation. Due to the different characteristics of various energy storage units and their different adaptation scenarios, it is necessary to comprehensively utilize performance and economic energy storage units in order to further enhance the economic efficiency of energy storage power plants. Due to the high operating cost of existing energy storage devices, it is necessary to reduce the operating cost of energy storage while ensuring the suppression of fluctuations in photovoltaic power plants and improving the economic efficiency of power plants. To take into account this issue, this section takes data from the central China region as an example to establish a model for the assessment amount of photovoltaic power stations. The revenue model is shown in the formula.
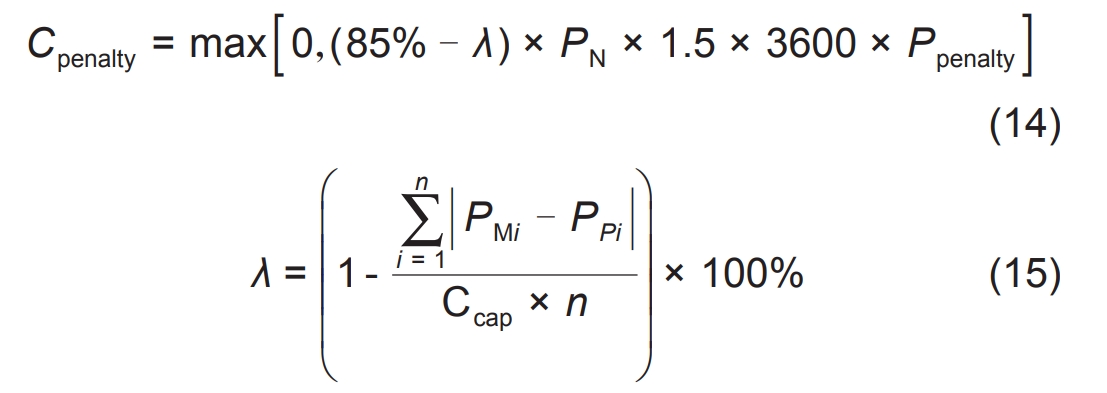
In the formula, PMi is the actual power at time i; PPi is the predicted daily power value; Ccap is the available capacity of new energy power plants; N is the number of samples during the power generation period; PN is the rated capacity of the new energy power plant; λ For the purpose of predicting accuracy, Ppenalty is used to assess the unit price of electricity λ When it is greater than 85%, the assessment power will not be calculated. The assessment cost for the output of new energy power stations has been established based on the above formula, and the reduced assessment cost through energy storage power stations can be recorded as the income of the energy storage system.
(2) Time of use electricity price benefits
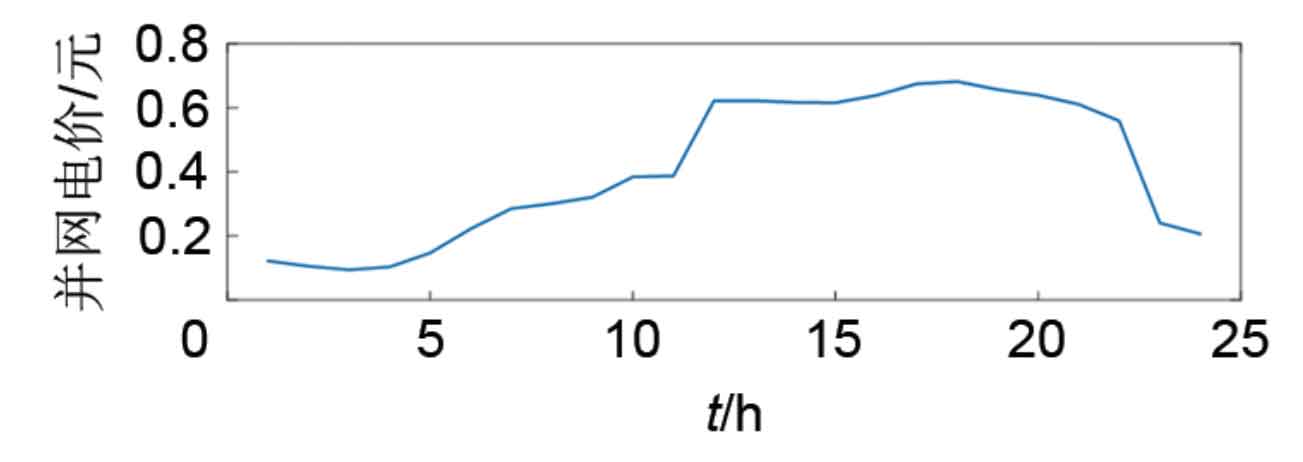
At present, it is difficult for new energy combined storage power stations in most regions of China to directly participate in time of use electricity price arbitrage. However, fluctuations in electricity prices occur when the load curve and output curve do not match, which can adjust the load and output curve to achieve the goal of improving new energy consumption and reducing electricity costs. This article takes the US electricity market as the background and corresponds the station side electricity price to the node marginal electricity price (LMP) to obtain the hourly time of use electricity price. Energy storage power stations can absorb the output of new energy stations during low electricity prices and sell them again during peak electricity prices, while achieving a match between station profitability and load output curve.
The profit calculation formula is shown in the formula.
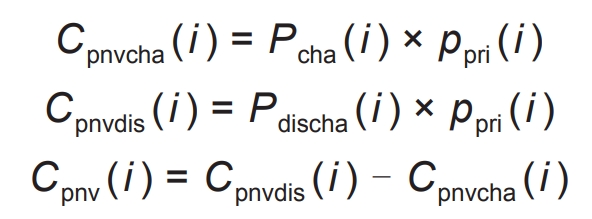
In the formula, Cpnvcha (i) is the cost required for the energy storage station to absorb electricity from the new energy station at time i; Cpnvdis (i) represents the profit from selling electricity to the energy storage power station at time i; Ppri (i) is the grid connected electricity price at time i; Cpnv (i) refers to the full utilization of the time-of-use electricity price benefits from the energy storage power station at time i.
(3) Thermal power cost calculation
The cost calculation of the temperature regulation system is shown in the formula.
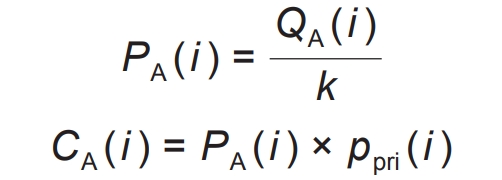
In the formula, PA (i) represents the air conditioning power required by the temperature regulation system at time i; K is the ratio of heat generation/exhaust power to electrical power, generally taken as a fixed value of 2.6; Ctem (i) is the cost of the temperature regulation system at time i.
(4) Battery life loss cost corrected by temperature capacity relationship
The discharge capacity of a battery varies with temperature, but the reasons for capacity decay vary between high and low temperatures. Discussed the attenuation amount and reasons of capacitance under different temperatures, and found that the main reason for capacity attenuation at high temperatures is the enhanced activity of positive and negative electrode materials, which leads to unstable material properties and therefore irreversible losses; The main reason for capacity decay at low temperatures is the temporary decrease in ion activity, which leads to an increase in impedance and a decrease in capacity, resulting in reversible loss. Based on different reasons for capacity decay, the maximum temperature of the battery is limited to the temperature corresponding to the maximum battery capacity. At the same time, it can be seen that when the temperature is below -10 ℃, the capacity decay is too obvious and cannot function properly. Therefore, the minimum temperature of the battery is limited to -10 ℃. When the temperature changes within the allowable range, the corresponding discharge capacity changes accordingly, and its functional relationship can be provided by the manufacturer, as shown in Figure 2.
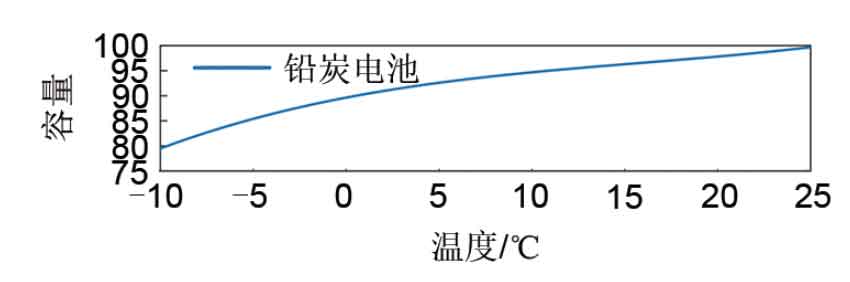
Analyzing Figure 2, it was found that the curve can be fitted by a formula, with a corresponding confidence level greater than 0.95.
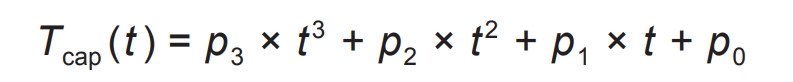
In the formula, Tcap (t) represents the discharge capacity of the battery at temperature t ℃, t represents the battery temperature at this time, and [p3, p2, p1, p0] is the fitting coefficient, i.e. [5.331 × 10⁻⁴, -2.55 × 10⁻², 0.706, 89.64.
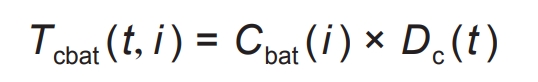
From this, the real-time discharge capacity of the battery’s associated temperature can be calculated, and the corresponding loss can be obtained. Based on this, the battery loss cost considering temperature changes can be determined, as shown in the formula.
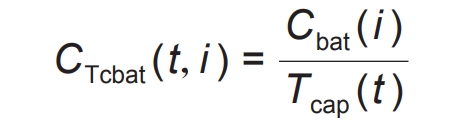
In the formula, CTcbat (t, i) is the cost of battery life loss that takes into account the impact of temperature on discharge capacity.
2.2 Economic dispatch constraints
Operational constraints of renewable energy station combined energy storage system
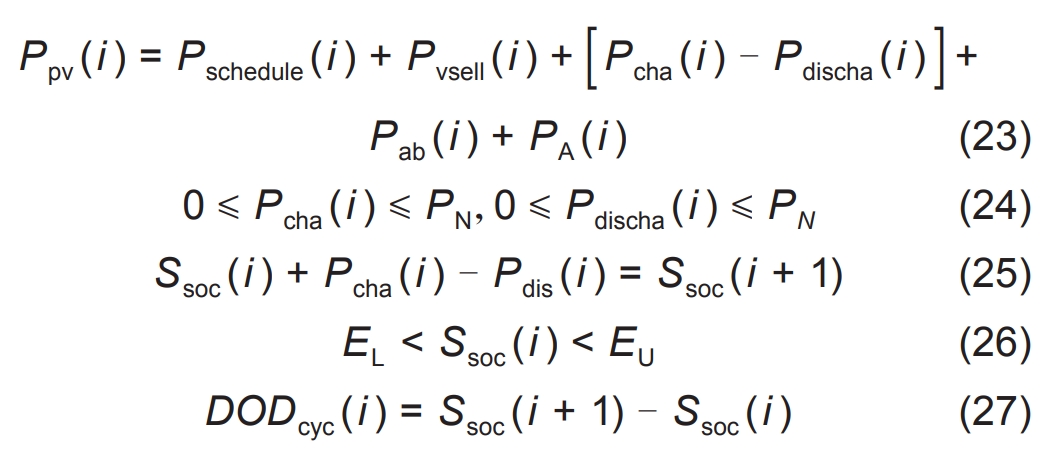
In the formula, Ppv (i) is the actual output of the photovoltaic power station at time i; Pschedule (i), Pvsell (i) is the peak valley arbitrage selling power at time i; Pcha (i) and Pdischa (i) represent the discharge and charging power of the energy storage battery at time i, respectively; Pab (i) is the power output of the power station at time i; PN is the rated power of the battery; Ssoc (i) is the battery level at time i; EU and L are the upper and lower limits of battery power, respectively. The formula establishes the power balance considering the energy storage system and new energy stations. The formula establishes power and capacity constraints for energy storage power plants. The formula obtains the discharge depth from the i-th+1 moment and the i-th moment.
3. Model solving
There are two types of nonlinear elements in the solution of the above scheduling strategy model, one is the nonlinear relationship between battery temperature and capacity, and the other is the formula. Although intelligent algorithms such as differential evolution can be applied to solve problems, they are difficult to meet the speed requirements of scheduling strategies, and difficult to ensure that the solution is the optimal solution. Therefore, this article preliminarily considers the first type of nonlinear elements to be treated with piecewise linearization, while the second type of nonlinear elements are first transformed into bilinear terms and then linearized using a refined McCormick scheme. Finally, use Gurobi to solve linear problems.
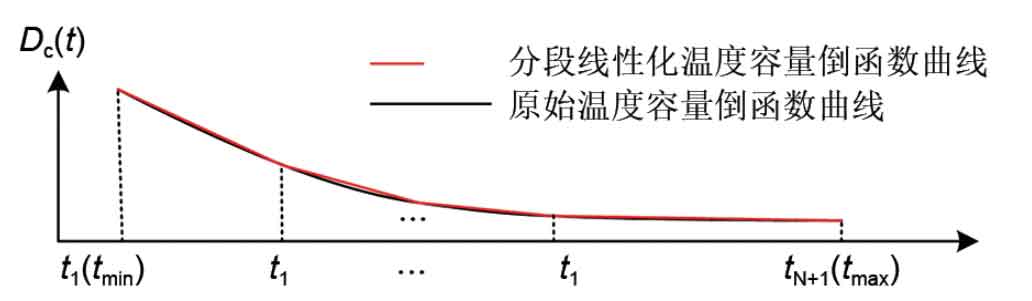
(1) Take the function Tcap (t) as the inverse function Dc (t) and perform piecewise linearization
Regarding the non-linear relationship between battery temperature capacity, taking the relationship between discharge capacity and temperature of lead carbon batteries as an example, the piecewise linearization process after taking the inverse function is shown in Figure 3. The inverse of the function can be seen in the formula.
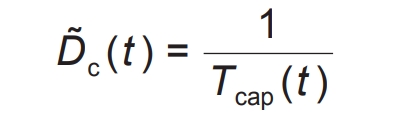
The inverse function curve expression of its temperature capacity is:
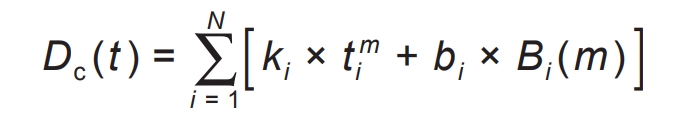
Among them, each variable constraint is shown in the formula:
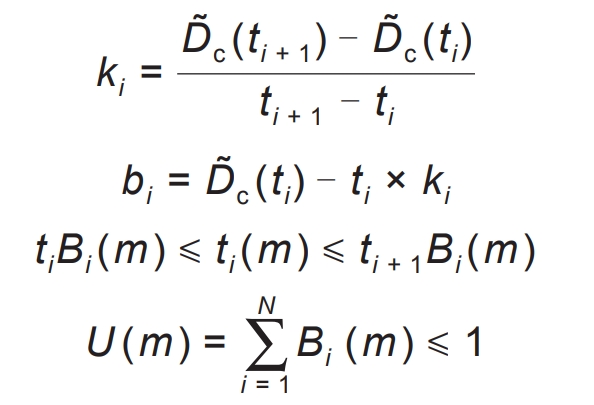
In the equation, D ͂ C (t) is the inverse function of battery temperature capacity; Dc (t) is a linearized function of the inverse function of temperature capacity; Ki represents the slope of the i-th segment of a linear piecewise function; Bi is the equivalent intercept of the i-th segment; Ti is the i-th segment point; T1 and tN+1 represent the minimum and maximum operating temperatures of the battery, respectively, with ti (m) representing the i-th temperature at the m-th moment; Bi (m) is the flag bit that represents the temperature status of the battery.
(2) McCormick linearization method
For non-linear factors in the formula, the formula can be changed to:
Thus, unconventional nonlinear elements can be transformed into bilinear terms that are easier to handle, but cannot be directly solved using linear solvers. Therefore, the McCormick method can be used to handle this, and the formula can be transformed into the following constraints.
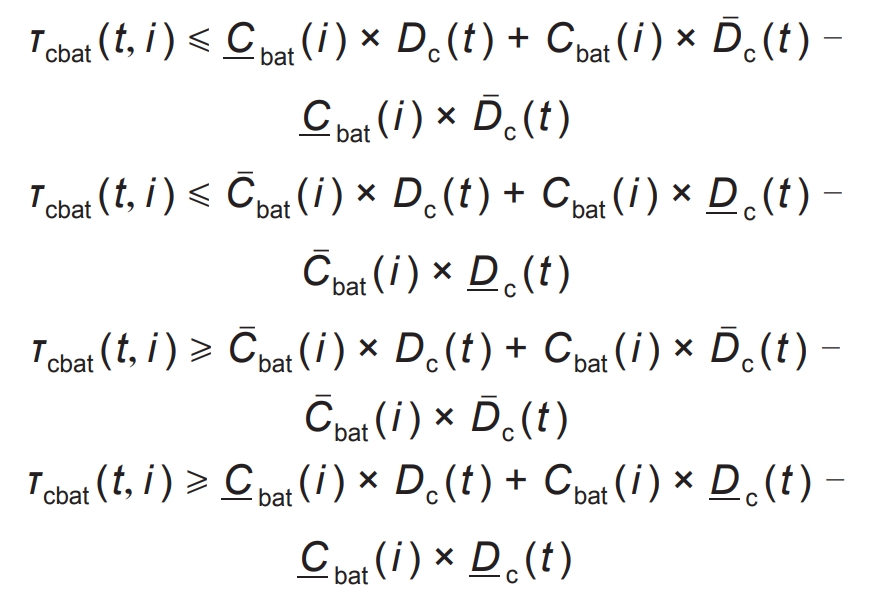
In the equation, τ Cbat (t, i) is the auxiliary variable, C ˉ BAT (i) and C BAT (i) are the upper and lower limits of the battery life cost for the i-th segment without considering the impact of temperature on battery life loss, D ˉ C (t) and D c (t) are the upper and lower limits of the inverse function values of the battery temperature and capacity at time t. However, it is difficult to obtain high-precision scheduling solutions directly using the McCormick linearization formula. Therefore, this paper proposes a refined slicing McCormick method, as shown in the formula.

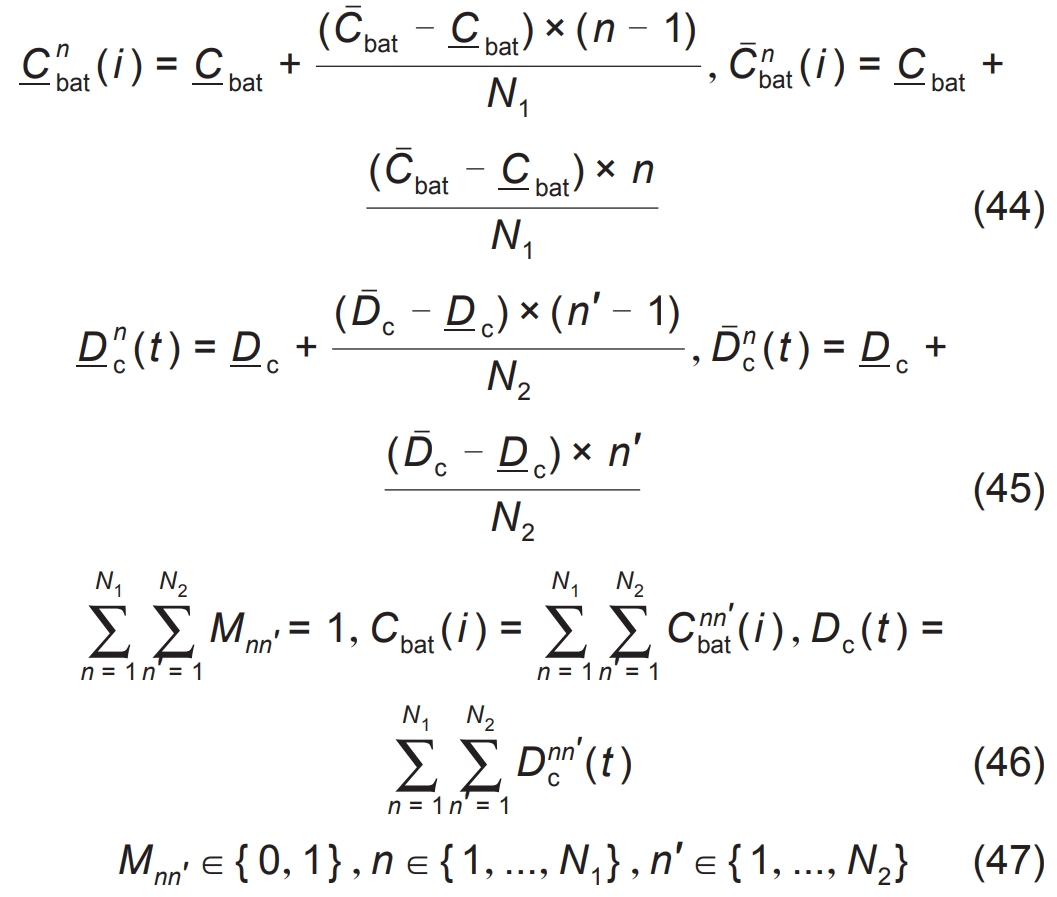
In the formula, N1 and N2 are the number of segments of Cbat and Dc, respectively; Mnn ‘is an auxiliary sharding variable; C ˉ Nbat (i) and C nbat (i) are the upper and lower limits of the nth partition of the i-th segment of Cbat; D ˉ N ′ c (t) and D n ′C (t) are the upper and lower limits of the i-th paragraph of Dc, respectively; Dnn ′ c (t) and Cnn ′ bat (i) are the real-time values at time t ℃ and i, respectively, resulting in a refined slicing McCormick scheme.
4. Example analysis
The economic scheduling of energy storage power plants using a hybrid energy storage system consisting of advanced lead carbon (ALC) and lithium iron phosphate (LiFePO4, LFP) batteries was carried out. The price was derived from the 2020 Energy Storage Industry Application Research Report, where the cost of lead carbon batteries was 1160 yuan/(kW · h), the cost of lithium iron phosphate batteries was 2280 yuan/(kW · h), and the charging and discharging rates were 0.25 C and 1 C, respectively. As shown in Figure 4.
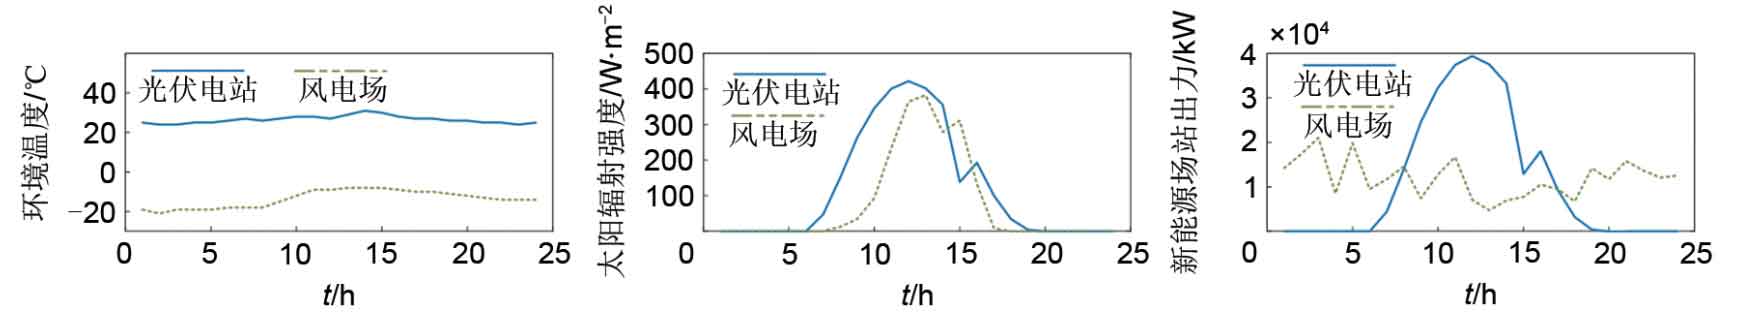
Using synchronous backpropagation reduction technology, two typical scenarios within a year were obtained from photovoltaic power plants and wind power plants (scenario 1 is photovoltaic, and scenario 2 is wind power), as shown in Figure 5.
According to the proposed scheme, linearize the battery life loss model considering the relationship between DOD and total transfer energy, and obtain the linearization relationship between DOD and life loss for lead carbon batteries and lithium iron phosphate batteries, as shown in Figure 6.
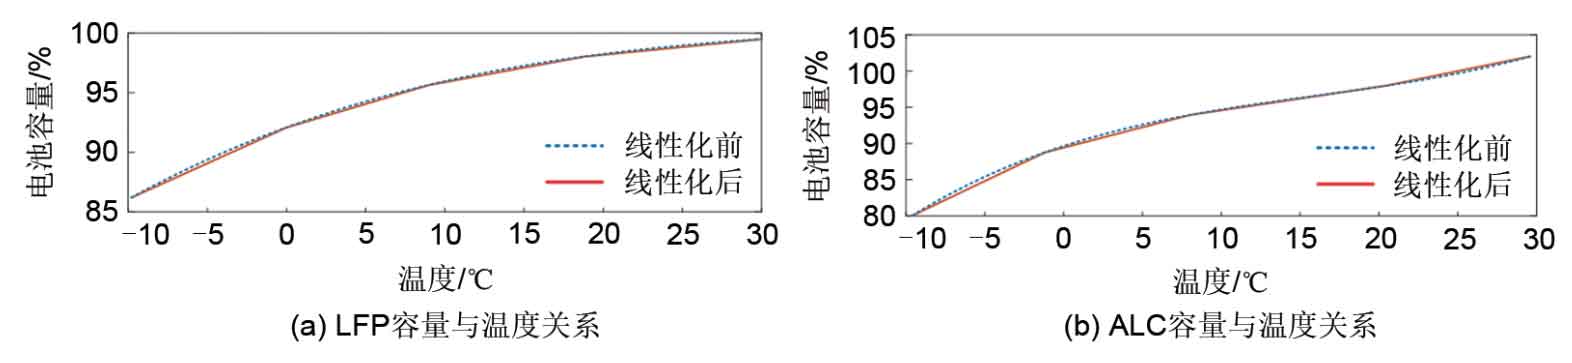
Similarly, by linearizing the temperature and capacity models of batteries, the temperature and capacity models of lead carbon batteries and lithium iron phosphate batteries are obtained, as shown in Figure 7.
4.1 Comparative analysis of economic dispatch strategies considering temperature capacity relationship
To analyze the application effect of the temperature capacity model in the economic dispatch of energy storage power plants, the following plan is formulated for comparative analysis in different scenarios.
Option 1: Cite the economic dispatch model, which mainly considers power balance, energy storage state of charge constraints, and battery life loss. The dynamic programming method based on Lagrange relaxation and interior point method is used to solve the model.
Option 2: Economic scheduling plan considering the relationship between battery temperature and capacity.
Conduct comparative analysis in the following scenarios.
Scenario 1: A typical day for a 50MW photovoltaic power plant in China;
Scenario 2: Typical days of actual data for a wind farm in Denmark;
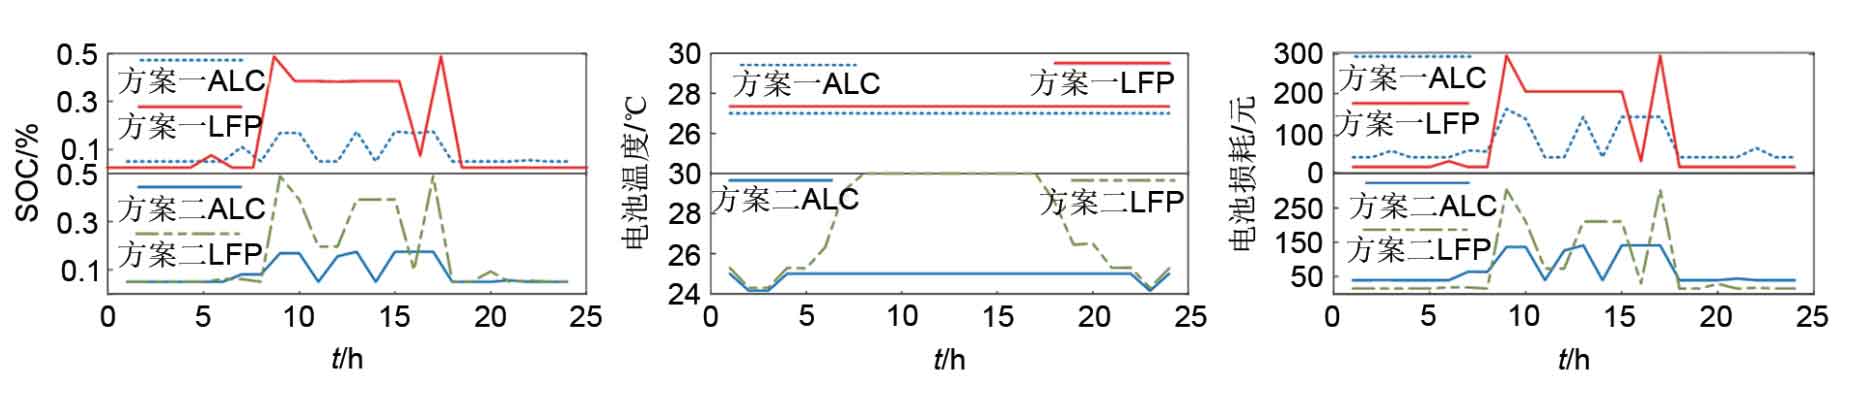
The relationship between power plant SOC, temperature, and loss cost and time under different schemes is shown in Figure 8.
Firstly, based on the analysis of typical scenario one, it can be found that in scenario one, the operating temperatures of lead carbon batteries and lithium iron phosphate batteries are both within the safe limit, achieving good natural heat dissipation by cycling charging and discharging the battery within the safe temperature range while utilizing a higher temperature difference. However, the temperature capacity relationship was not considered. In addition, based on the comparison of battery loss and SOC, it can be seen that from 8:00 am to 9:00 am, the DOD of LFP is basically the same under the two schemes, but the battery loss in Scheme 1 is relatively high. And Scheme 2 can flexibly adjust the battery temperature, adopting more economical temperature regulation measures when the battery is not frequently charged and discharged.
Based on the analysis of typical scenario 2, it can be found that scheme 1, which does not consider the relationship between battery temperature and capacity, can maintain the battery temperature above the minimum temperature, but the temperature during battery charging and discharging is still relatively low. Although this temperature regulation system has lower costs, the cost of life loss greatly increases, reducing the economic efficiency of the scheduling scheme. In comparison, Scheme 2, which considers the relationship between battery temperature and capacity, can provide an appropriate environmental temperature for battery charging and discharging, thereby improving the charging and discharging efficiency of the battery. At low charging and discharging rates, in order to reduce the cost of system temperature regulation, only a safe battery operating temperature will be provided.
From this, it can be seen that Scheme 2 not only takes into account the power consumption of the temperature regulation system, but also ensures that the battery is at a suitable temperature during charging and discharging. Further analysis can obtain the daily net profit and battery life loss cost of the energy storage power station, as shown in Table 1.
| Scene | Programme | Daily net profit/yuan | Battery life loss/yuan |
| Scenario 1 | Scheme 1 | 124023 | 3788.64 |
| Scenario 1 | Scheme 2 | 125108 | 3564.03 |
| Scenario 2 | Scheme 1 | 96643.9 | 6812.90 |
| Scenario 2 | Scheme 2 | 100724 | 3464.90 |
Based on comprehensive analysis, it can be concluded that although scheduling schemes that do not consider temperature capacity relationships can achieve safe and stable operation of energy storage power plants based on weather conditions, they are difficult to ensure that batteries are charged and discharged at ideal temperatures. The scheduling strategy based on the comprehensive relationship between battery temperature and capacity can reasonably adjust the temperature of the power station, significantly reduce battery life loss, and improve the overall economic efficiency of the power station.
4.2 Model analysis considering fluctuations in grid connected electricity prices
The time-of-use grid connected electricity price of new energy stations is related to factors such as the average marginal cost of each operating period of the power system, the actual output of new energy power stations and thermal power plants, and the load characteristics of users. Therefore, the fluctuation of the time-of-use grid connected electricity price is significant. As an important factor to be considered in daily economic dispatch, the fluctuation of time of use electricity price will directly affect the generated dispatch plan. In Scenario 1, considering the uncertainty of grid connected electricity prices, the comprehensive error of wind and light output is considered as a random error, and X~N (1,0.1) is used as the coefficient of the proposed grid connected electricity prices for data augmentation. Simulation analysis was conducted on 30000 scenarios obtained, and the relationship between power plant SOC, loss cost, and temperature and time under Scheme 2 is shown in Figure 10.
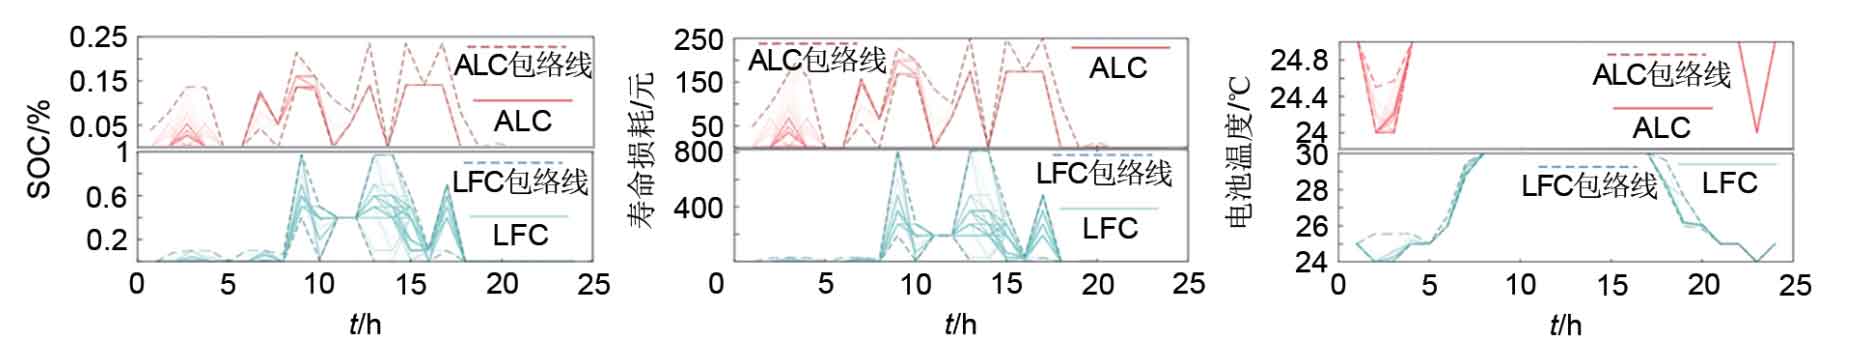
The ALC and LFC envelope lines in Figure 10 represent the upper and lower limits of daily battery SOC, loss cost, and temperature for both ALC and LFC. Transparent lines in each section represent the actual operation of the battery in each scenario, and the darker the color, the more overlapping it is. Analysis of Figure 10 shows that ALC transfers less energy per day than LFC in all scenarios, indicating that the unit transfer energy cost of LFC is lower than that of ALC and has stronger profitability in the time of use electricity price scenario. Based on the analysis of the operation status of LFC in Figure 10, it can be found that there are significant differences in battery operation under different electricity price scenarios from 8-10 hours to 12-18 hours. The reason for this is that on the one hand, the battery temperature is very suitable for battery charging and discharging; On the other hand, it indicates that the LFC energy storage system is very sensitive to the electricity price during this period and can effectively adjust the scheduling plan in response to electricity price fluctuations. In addition, in scenarios with different electricity prices, there is still a strong coupling relationship between the charging and discharging power of ALC and LFC and the battery temperature. If high-power charging and discharging are to be achieved, it is necessary to ensure that the battery temperature is more suitable to reduce the cost of battery life loss.
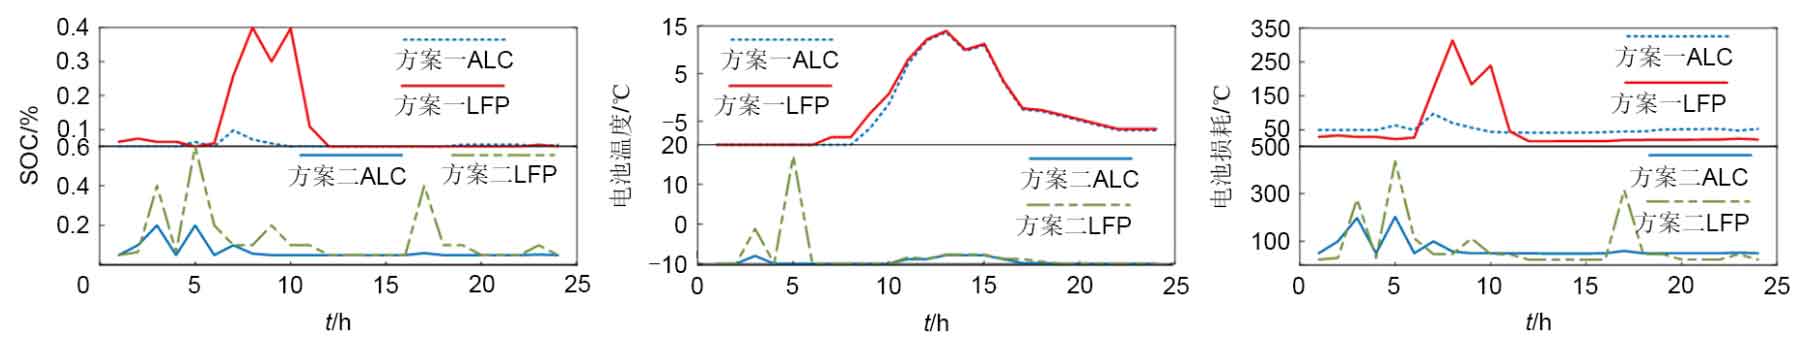
Applying the above grid connected electricity price data to Scenario 2, the relationship between SOC, loss cost, and temperature and time of the power plant under Scenario 2 can be obtained, as shown in Figure 11.
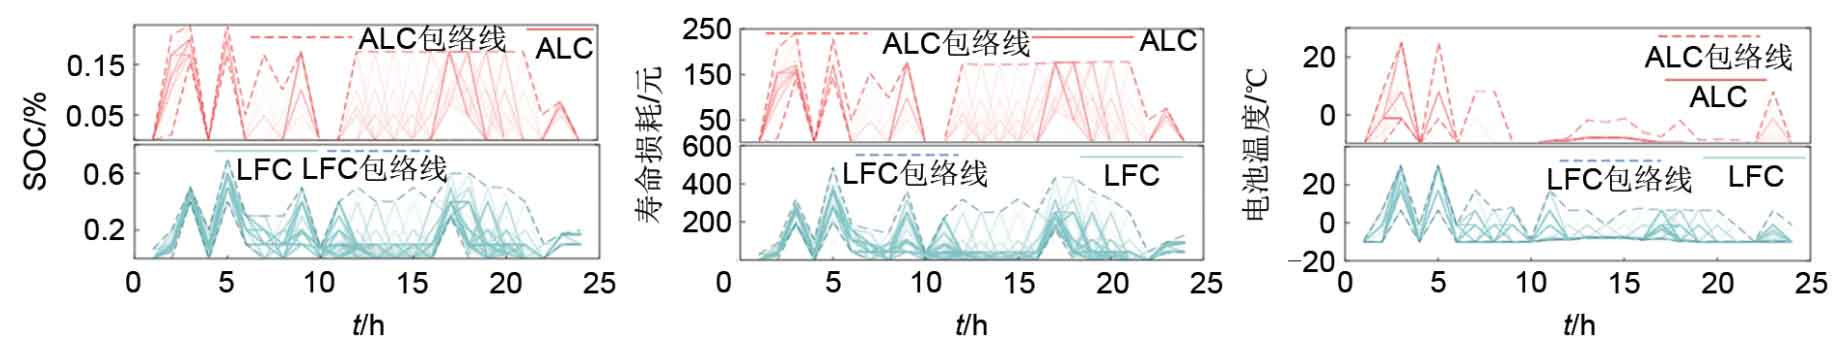
Unlike Scenario 1, as lower ambient temperatures will increase the cost of battery temperature regulation, the temperature regulation system in Scenario 2 only actively increases the battery operating temperature during periods of high battery charging and discharging energy. Comparing Figure 10 and Figure 11, it can be found that wind farms, due to their larger output fluctuations compared to photovoltaic power plants, require a higher proportion of energy storage resources to suppress fluctuations, making the energy storage system more sensitive to grid connected electricity prices.
To verify the effectiveness of the temperature capacity relationship scheduling strategy proposed in this article, the following scheme is further set up.
Comparison Plan 1: A photovoltaic power station operation plan that takes into account the temperature capacity relationship and the fluctuation of the time of use electricity price.
Comparison Plan 2: A photovoltaic power station operation plan that does not consider temperature capacity relationship but considers time-of-use electricity price fluctuations.
Comparison Plan 3: A wind power plant operation plan that considers the temperature capacity relationship and the fluctuation of the time of use electricity price.
Comparison Scheme 4: A wind power plant operation scheme that does not consider the temperature capacity relationship but considers the fluctuation of the time of use electricity price.
The simulation results are shown in Figure 12.
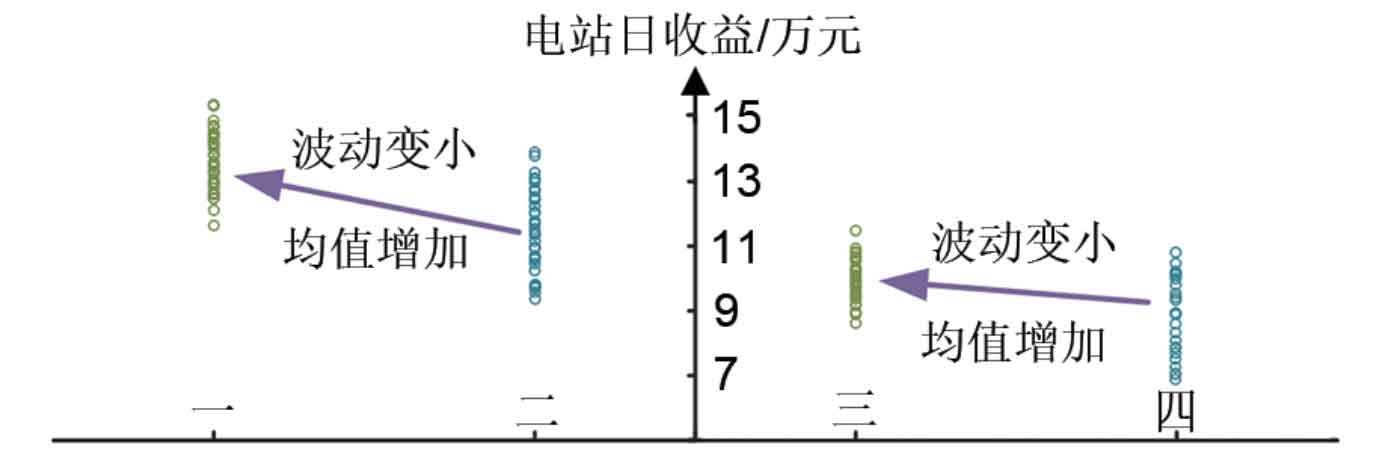
Analyzing Figure 12, it can be seen that the scheduling strategy considering the temperature capacity relationship makes the estimation of battery life loss closer to the actual loss, and can actively adjust the battery operating temperature through the temperature regulation system, making it easy to flexibly adjust the energy storage system scheduling plan for uncertain time of use electricity prices. This can obtain higher and more stable profits, verifying the superiority of the proposed scheme in this paper. Further comparison between photovoltaic power plants and wind power plants shows that the energy storage system equipped with relatively small fluctuations in photovoltaic power plants does not need to frequently suppress fluctuations in photovoltaic power plants, thus effectively utilizing the profit space generated by time-of-use electricity prices.
4.3 Model analysis considering price changes of hybrid energy storage units
With the development of chemical battery technology and changes in raw material prices, the prices of LFP and ALC are not fixed. Analyzing the impact of price changes on model results can help new energy joint energy storage stations respond to the ever-changing future energy storage market in a timely manner. Therefore, taking the current total price of 100 kW · h LFP and ALC as the changed total price of ALC and LFP, the utilization efficiency of the two types of batteries in the economic dispatch of photovoltaic power plants after the change in the price ratio of LFP and ALC is analyzed. The results are shown in Figure 13.
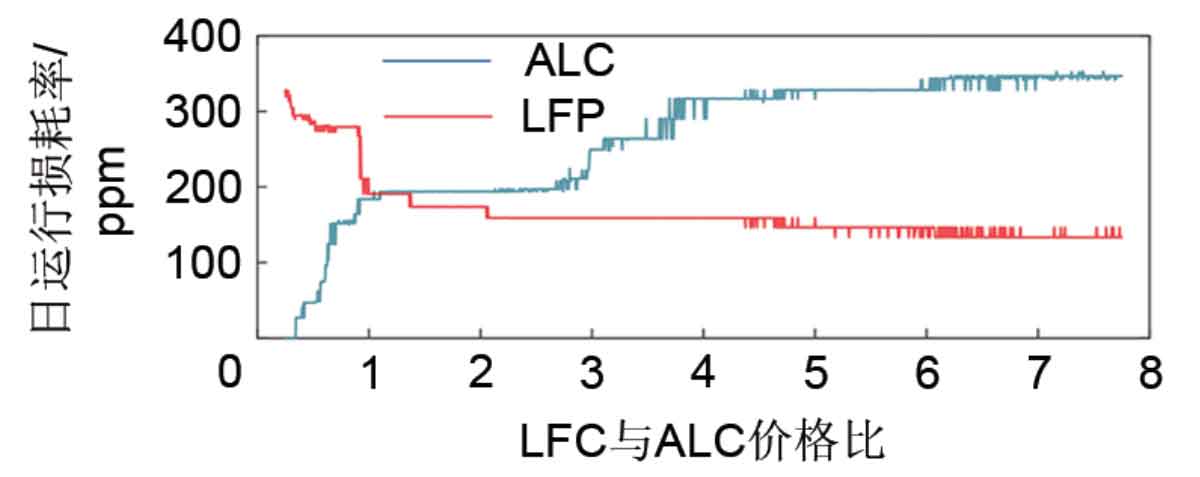
Under economic dispatch, the daily operating loss rate of batteries is positively correlated with the utilization rate of energy storage batteries. Based on Figure 13, it can be seen that LFP, due to its excellent high rate charging and discharging ability, maintains a high utilization rate even when the price of LFP is high, while ALC is easily replaced by LFP when the price is too high. Therefore, LFP has an irreplaceable position compared to ALC. Considering further changes in the prices of LFP and ALC in the future, if the price of LFP is not significantly higher than that of ALC, it is necessary to equip the energy storage system with a certain capacity of LFP. However, when the price difference between LFP and ALC is not significant, ALC can be omitted.
4.4 Time consumption and accuracy analysis of linearization solution method
To further analyze the effects of adopting the fragmented McCormick scheme in Scheme 2 of Section 3.1, the following solution method is used for comparative analysis.
Solution 1: Directly use the McCormick strategy to solve the problem.
Solution 2: Using the fragmented McCormick strategy as the solution method.
Solution 3: A solution method based on the dynamic programming model proposed in reference.
Considering the uncertainty of wind and light output, the comprehensive error of wind and light output is considered as a random error, and X-N (1,0.15) is used as the coefficient of the original actual output. Scenarios 1 and 2 are respectively amplified with data. For the expanded 2000 scenarios, testing and validation were conducted, and the simulation results were solved as shown in Table 2.
| Solution | Solution 1 | Solution 2 | Solution 3 |
| Solution time/s | 0.62 | 2 | 360.3 |
| Solution error/% | 22 | 1.67 | 0 |
| Power station profit/yuan | 78564 | 100724 | 102406 |
Due to the high accuracy of the proposed solution, the power plant profit obtained by this model is taken as the optimal solution, and the solution accuracy is obtained by comparing the power plant profits obtained from different solution schemes. From the analysis in Table 2, the following conclusions can be drawn: ① Directly adopting the McCormick scheme takes the shortest time, but due to excessive relaxation, the optimal solution set corresponding to the power plant profit value needs to be recalculated. After calculation, it can be found that the optimal solution corresponds to a lower profit value for the power station and a lower economic efficiency for the scheduling plan The proposed dynamic programming solution method has the highest economic efficiency, but it takes too long to meet the real-time scheduling needs of energy storage power plants. In addition, applying this scheme to larger scale energy storage power plants will require a longer solution time The use of fragmented McCormick scheme has shorter time consumption and higher economic efficiency, which can achieve real-time scheduling of power plants within the day and has high practical value. And it can be foreseen that continuing to increase the number of shards can improve the accuracy of the scheduling plan and enhance the economic efficiency of power plant operation.
5. Conclusion
An economic scheduling optimization strategy has been established for wind/solar storage combined power plants, which takes into account the cost of temperature regulation system and battery life loss. In order to achieve real-time scheduling of energy storage power plants within the day, improve the economy and solving speed of scheduling strategies, a piecewise McCormick method was used to linearize the large number of bilinear terms present in the model. The conclusion is as follows.
(1) The scheduling strategy that takes into account the thermal management of the energy storage system can achieve stable operation of the energy storage battery within the safe temperature limit, ensuring that the energy storage station can reliably provide tracking of planned output and smoothing fluctuations for new energy stations in response to various extreme weather conditions. At the same time, it can also provide peak shaving and valley filling services for the power grid. And providing wave suppression services for wind/solar new energy stations does not increase battery loss, but can fully utilize energy storage batteries and increase the profitability of the new energy joint energy storage system.
(2) By reasonably controlling the power of the temperature regulation system, the cost of the temperature regulation system can be reduced while meeting the appropriate temperature required for battery charging and discharging. Provide a more suitable battery temperature during charging and discharging of energy storage batteries to reduce battery loss costs, while saving on temperature regulation system costs during battery leisure time, achieving economic and stable operation of energy storage power stations. Moreover, the estimation of battery life loss within the scheduling strategy proposed in this article is closer to the actual loss, and the battery operating temperature can be actively regulated through the temperature regulation system, which can effectively adjust the scheduling strategy to cope with fluctuations in grid connected electricity prices, ultimately achieving an increase in daily operating revenue of the power station.
(3) Due to its excellent high rate charging and discharging ability, LFP maintains high utilization even when the price of LFP is high, while ALC is easily replaced by LFP when the price is too high. When the future price of LFP is not significantly higher than that of ALC, it is necessary to equip the energy storage system with a certain capacity of LFP, and when the price difference between LFP and ALC is not significant, ALC can be omitted.
(4) The fragmented McCormick linearization method not only meets the speed requirements of real-time power plant scheduling, but also achieves a highly economical power plant scheduling strategy. And a strategy of increasing the number of shards and using stricter boundary constraints to ensure the economic efficiency of the scheduling scheme is proposed for scheduling scenarios of energy storage power plants with larger scales and higher time accuracy requirements.