
In recent years, with the rapid development of new energy technologies, li ion battery have gained widespread attention due to their high energy density, wide operating temperature range, environmental friendliness, and long lifespan. However, irreversible chemical reactions occur inside li ion battery, leading to inevitable capacity loss during use and storage. The cycle life is defined as the number of charge-discharge cycles when the usable capacity drops to a certain percentage of the initial value, typically set at 80% as the failure threshold. When a li ion battery reaches this threshold, timely replacement is necessary to ensure safe and stable system operation. Accurate prediction of the remaining useful life of li ion battery is crucial for maximizing battery performance and ensuring the safety and efficiency of battery systems.
Currently, methods for predicting the RUL of li ion battery can be broadly classified into two categories: model-based approaches and data-driven approaches. Model-based methods primarily involve constructing appropriate battery models to simulate electrochemical behaviors, capturing aging patterns, and predicting RUL. For instance, some studies have introduced electrochemical model-based particle filtering frameworks, treating parameters that reflect battery degradation as state variables for RUL prediction. Others have proposed improved particle learning frameworks to predict RUL by resampling state particles with newly collected measurement information and propagating them to the current moment to generate posterior state particles, effectively preventing particle degeneracy. Additionally, general state-space models have been established, with parameters identified and updated using expectation-maximization and extended Kalman filtering algorithms to accurately describe battery aging processes. However, due to the complexity of internal chemical reactions in li ion battery, it is often challenging to collect comprehensive internal parameters and establish accurate aging models. Simultaneously, battery states are susceptible to external factors such as operating temperature, depth of discharge, and current, making these methods less reliable in complex operating environments.
In contrast, data-driven methods have been widely applied for predicting the RUL of li ion battery. Unlike model-based approaches, data-driven methods do not require consideration of the complex internal working principles of li ion battery; they rely solely on historical data to describe aging processes. For example, support vector machines have been used to learn multiple feature data related to capacity degradation for state of health and RUL prediction. Long short-term memory networks and recurrent neural networks have been employed to learn battery aging information, combined with Monte Carlo simulations for RUL prediction, offering high accuracy and computational efficiency. However, these methods demand large training datasets and substantial hardware resources. With the rapid advancement of big data and hardware technologies, data-driven approaches have become a popular research direction for battery life prediction.
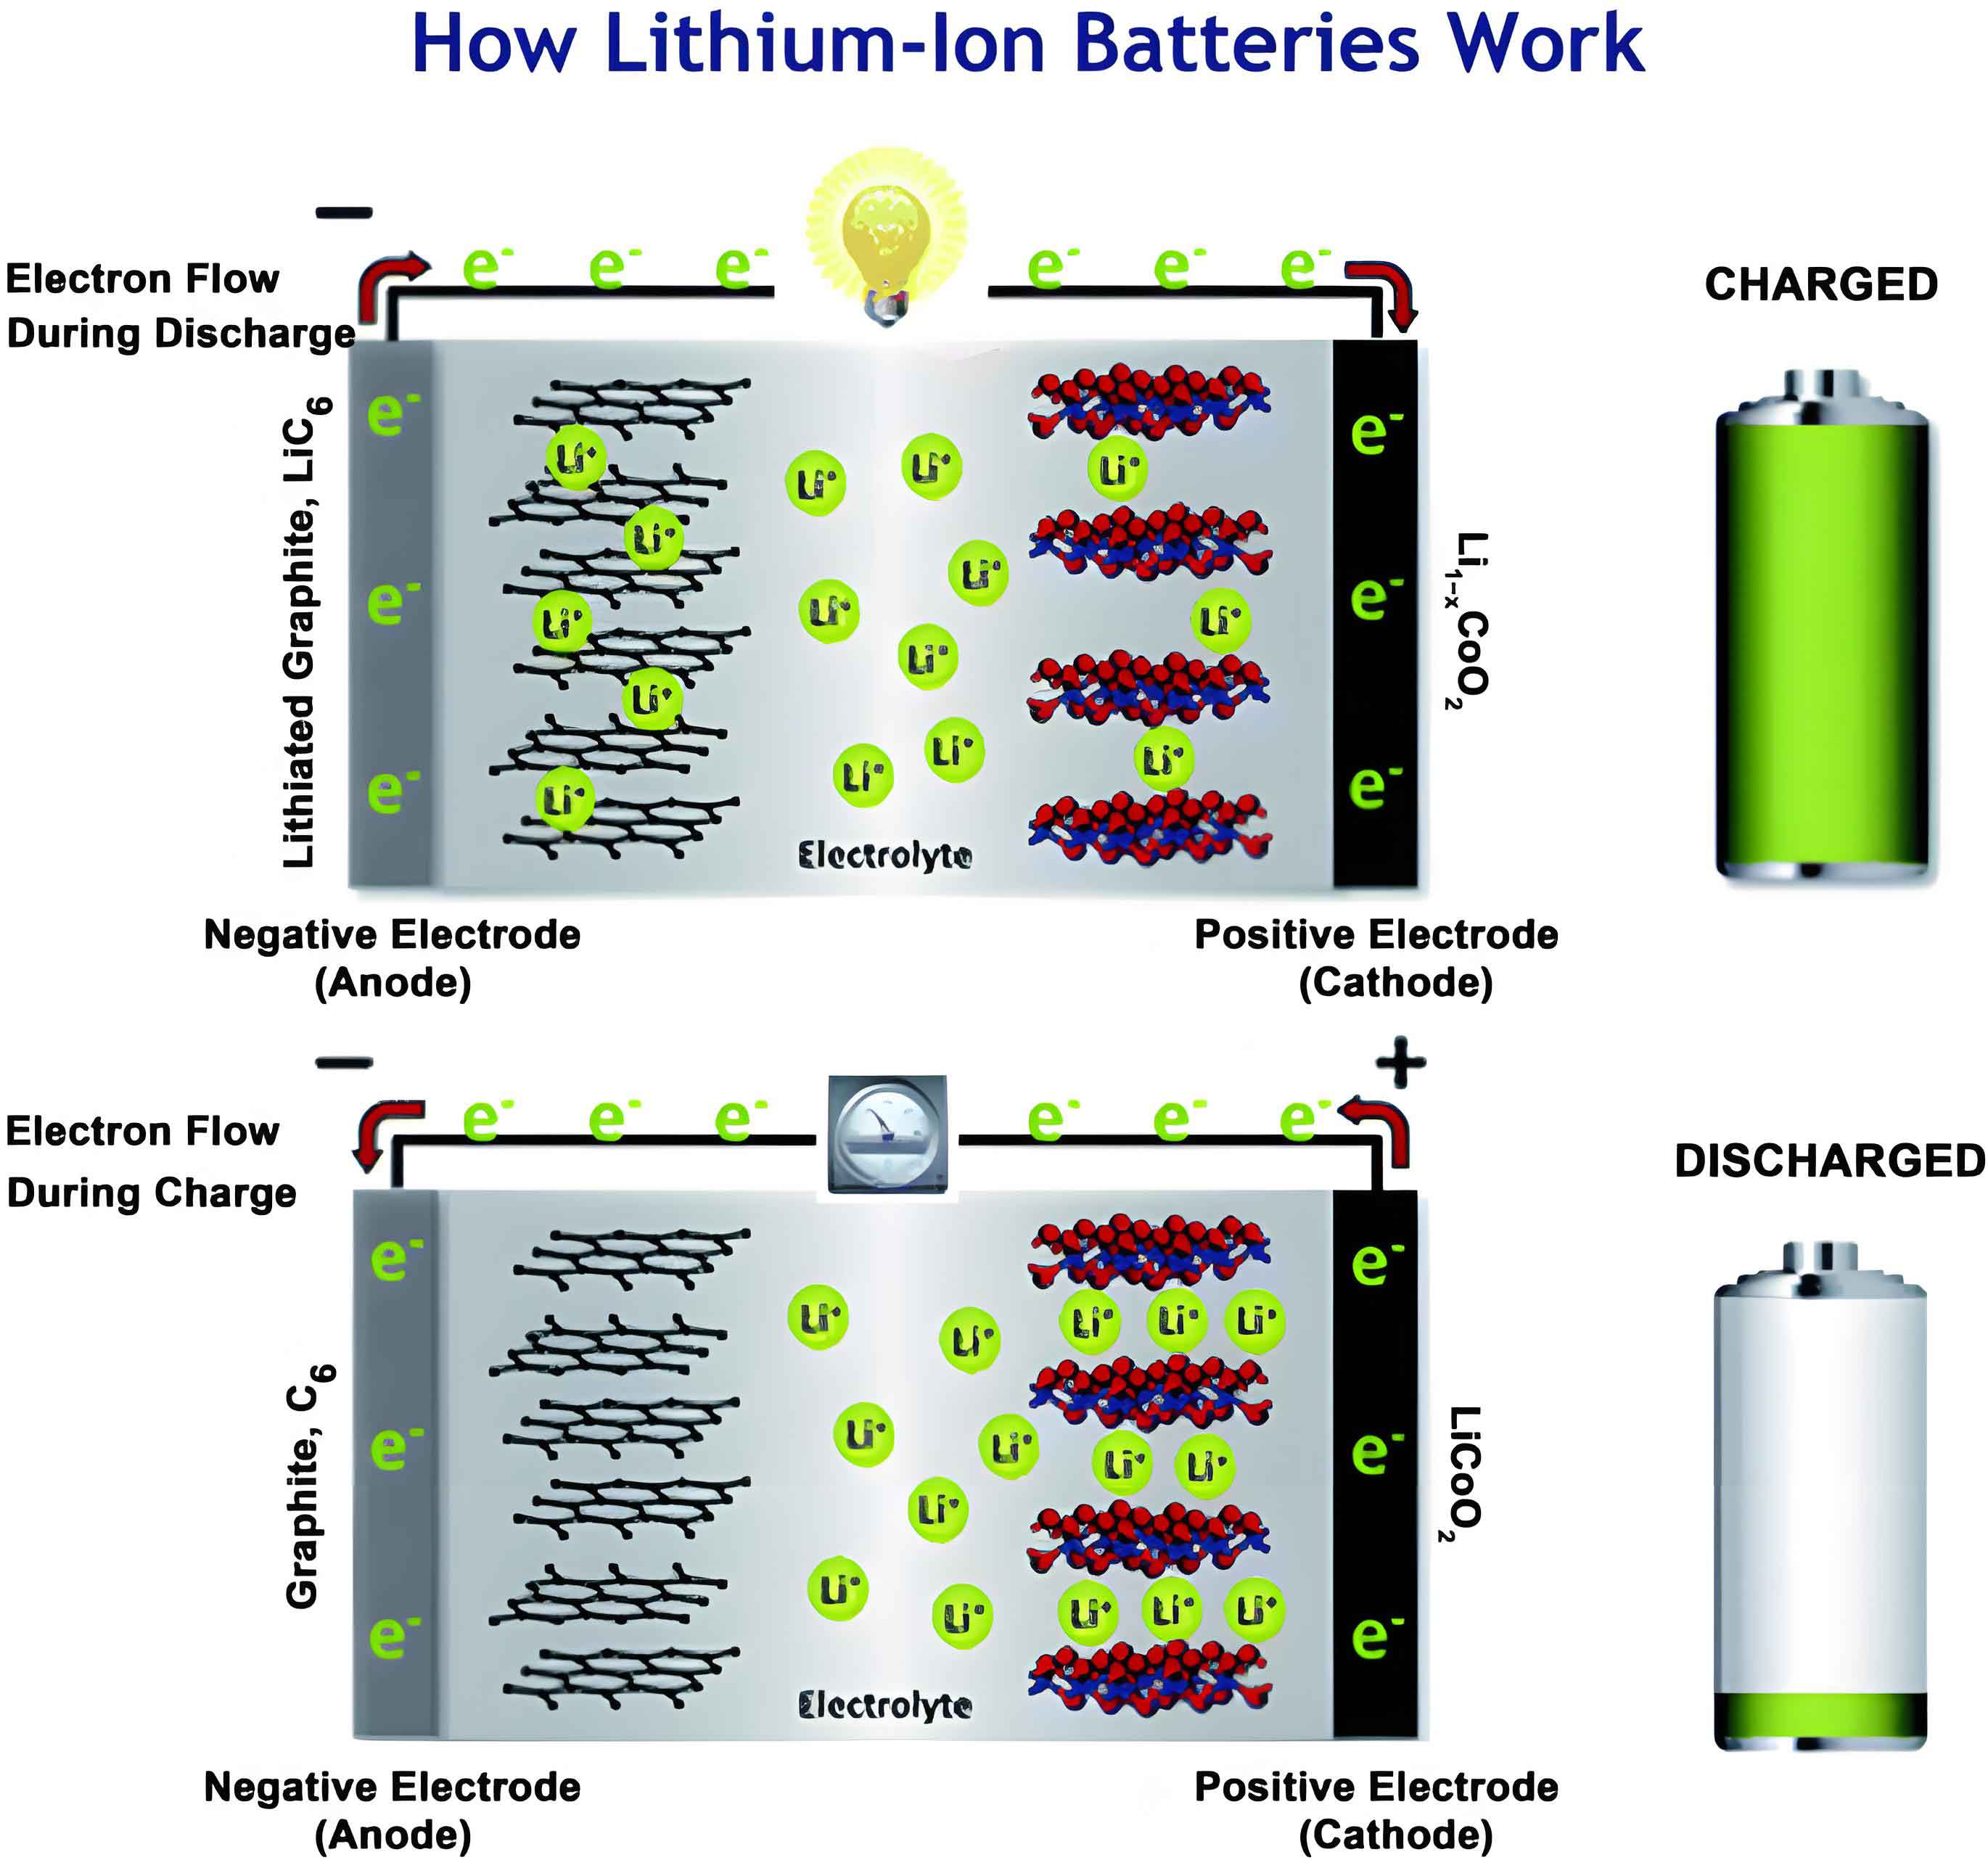
In reality, li ion battery are multi-physical field coupling systems involving electrical, thermal, and mechanical interactions. Capacity fade and performance degradation result from the interplay of various internal degradation mechanisms. During charge-discharge cycles, the continuous migration of lithium ions between the positive and negative electrodes causes internal stress and changes in external thickness in li ion battery. Simultaneously, irreversible mechanical deformations occur during aging, leading to performance decline and increased safety risks. Therefore, changes in the mechanical properties of li ion battery should be fully considered in RUL prediction. Currently, some researchers have investigated stress and deformation characteristics of li ion battery. Studies have found that stress during li ion battery usage correlates with both SOH and SOC, leading to the development of stress-SOH/SOC models. Other research has examined the mechanical behavior of 18650 li ion battery under bending and compression at different SOC levels, guiding the design and monitoring of single cells and battery packs. Additionally, by measuring changes in expansion during cycling, it has been demonstrated that expansion is a robust feature parameter for assessing li ion battery states.
In summary, existing RUL prediction methods have not adequately considered the mechanical features of li ion battery or analyzed the relationship between stress, deformation characteristics, and RUL, resulting in poor prediction accuracy and efficiency. To address this, I propose an RUL prediction method for li ion battery that incorporates expansion stress, enabling accurate and efficient RUL forecasting. This involves in-depth analysis of the relationship between reversible expansion, irreversible expansion, and capacity in li ion battery, along with correlation calculations. Reversible and irreversible expansion are used as feature parameters to construct and train a long short-term memory neural network for precise RUL prediction. Validation on public datasets shows that this method can effectively learn aging states and capture capacity degradation trends in li ion battery.
Analysis of Expansion Features and Their Correlation
The battery data used in this study is sourced from the UofM Pouch Cell Voltage and Expansion Cyclic Aging public dataset, which首次 records the evolution of mechanical characteristics of li ion battery, covering various aging conditions and including multiple sets of data such as voltage, current, temperature, capacity, and battery expansion during usage. The li ion battery were manufactured by the University of Michigan Battery Lab, with a rated capacity of 5.0 A·h and an operating voltage range of 3.0–4.2 V. The length, width, and thickness of the li ion battery are 132 mm, 90 mm, and 40 mm, respectively. The charge-discharge strategy involves applying an initial pressure of 34.5 kPa uniformly to the surface corresponding to the length and width of the li ion battery, letting it rest for 3 hours at a given temperature until thermal equilibrium is reached, then charging at a constant current to 4.2 V, followed by constant voltage charging until the current drops below C/50. After charging, the li ion battery rests for 1 hour before discharging at a constant current to 3.0 V. In this experiment, batteries 01, 05, 09, and 10 are selected as research objects, with parameters summarized in Table 1.
| Battery ID | Test Temperature (°C) | Charge Rate | Discharge Rate |
|---|---|---|---|
| 01 | 25 | C/5 | C/5 |
| 05 | −5 | 1.5C | 1.5C |
| 09 | 45 | 2C | 2C |
| 10 | 25 | C/5 | 1.5C |
Figure 2 illustrates the curves of peak expansion and minimum expansion during cyclic charge-discharge for Battery 01, where peak expansion corresponds to thickness change when the li ion battery is fully charged, and minimum expansion corresponds to thickness change when the li ion battery is fully discharged. It can be observed that during charging, the thickness of the li ion battery continuously expands, while during discharging, it contracts. This reversible change in battery expansion is due to the reversible nature of thickness variation, known as reversible expansion. Moreover, after the li ion battery is fully discharged, there is an irreversible accumulation of expansion compared to the end of the previous cycle, termed irreversible expansion. Combined with the capacity change curve shown in Figure 3, as the li ion battery ages cyclically, the usable capacity continuously decays, reversible expansion shows a slight decreasing trend, while irreversible expansion increases significantly, far exceeding the decrease in reversible expansion. This is primarily because during li ion battery usage, the content of lithium ions available for migration in the electrodes gradually decreases due to lithium loss, leading to a continuous reduction in reversible expansion. Simultaneously, aging of li ion battery accompanies internal polymer deformation and SEI film thickening, causing a noticeable increase in internal stress and resulting in continuous accumulation of irreversible expansion. Therefore, both reversible and irreversible expansion are closely related to capacity changes.
To analyze the linear relationship between expansion and capacity in Battery 01, expansion-capacity curves are plotted, as shown in Figure 4. It can be visually seen that li ion battery capacity has a good linear relationship with both reversible and irreversible expansion. During capacity reduction, reversible expansion also decreases, showing a positive correlation, while irreversible expansion continuously increases, exhibiting a negative correlation with capacity fade.
To further demonstrate the strong correlation between expansion features and capacity across different li ion battery, Pearson correlation analysis is used to quantify the correlation between expansion and capacity for the four batteries, compared with correlations involving internal resistance and charge-discharge times. The correlation coefficient is calculated using the formula:
$$ \rho_{X,Y} = \frac{\text{Cov}(X,Y)}{\sigma_X \sigma_Y} $$
where \(X\) and \(Y\) represent expansion data and capacity data, respectively; \(\text{Cov}(X,Y)\) is the covariance matrix between them; and \(\sigma_X\) and \(\sigma_Y\) are their standard deviations. The correlation calculation results are summarized in Table 2. For various test conditions, charge-discharge time, internal resistance, reversible expansion, and irreversible expansion all show strong correlations with capacity, where “-” indicates a negative correlation. Compared to internal resistance and charge time—traditional feature parameters commonly used in RUL prediction methods—reversible and irreversible expansion exhibit stronger linear relationships with capacity in li ion battery.
| Feature Parameter | Battery 01 | Battery 05 | Battery 09 | Battery 10 |
|---|---|---|---|---|
| Reversible Expansion | 0.983 | 0.996 | 0.982 | 0.988 |
| Irreversible Expansion | −0.999 | −0.993 | −0.993 | −0.996 |
| Internal Resistance | −0.881 | −0.894 | −0.974 | −0.947 |
| Charge Time | 0.908 | 0.824 | 0.984 | 0.908 |
Based on this analysis, expansion changes in li ion battery reflect variations in internal mechanical characteristics, are closely related to capacity changes, and exhibit strong linear relationships, effectively characterizing the aging state of li ion battery. Moreover, thickness changes in li ion battery are easier to measure. Therefore, reversible and irreversible expansion can serve as feature parameters for RUL prediction in li ion battery.
LSTM Network for RUL Prediction in li ion battery
Traditional recurrent neural networks are widely used for processing sequential problems such as time, speech, and text. However, RNNs often struggle to learn and maintain long-term dependencies due to issues like vanishing and exploding gradients. To address these problems, long short-term memory neural networks have been proposed. The basic working流程 of LSTM is as follows:
$$ f_t = \sigma(W_f \cdot [h_{t-1}, x_t] + b_f) $$
$$ i_t = \sigma(W_i \cdot [h_{t-1}, x_t] + b_i) $$
$$ \tilde{C}_t = \tanh(W_c \cdot [h_{t-1}, x_t] + b_c) $$
$$ C_t = f_t \cdot C_{t-1} + i_t \cdot \tilde{C}_t $$
$$ o_t = \sigma(W_o \cdot [h_{t-1}, x_t] + b_o) $$
$$ h_t = o_t \cdot \tanh(C_t) $$
where \(x_t\) is the input data at time \(t\), \(h_{t-1}\) is the hidden data at time \(t-1\), \(C_{t-1}\) is the network state at time \(t-1\); \(W_f\), \(W_i\), \(W_c\), \(W_o\) are weight matrices for each gate; \(b_f\), \(b_i\), \(b_c\), \(b_o\) are bias terms for each gate; \(\sigma\) is the activation function, here the sigmoid function with a range of (0, 1) to retain useful information; and \(\tanh(\cdot)\) is the hyperbolic tangent function. By introducing forget gates, input gates, and output gates, LSTM updates cell states and stores memory information during training, optimizing traditional recurrent network models and improving computational efficiency for node parameters, excelling in maintaining long-term dependencies.
Given the long-term dependencies of li ion battery states, I utilize LSTM networks to predict the remaining useful life of li ion battery. Reversible expansion, irreversible expansion, charge-discharge time, and internal resistance data are selected as input features for network training. The output layer provides capacity predictions, from which RUL values are calculated. The basic structure of the LSTM-based RUL prediction model for li ion battery is shown in Figure 5.
To eliminate the effects of different scales among indicators and ensure comparability, input data for li ion battery needs to be normalized, scaling each feature sequence to between 0 and 1. The normalization formula is:
$$ x’_t = \frac{x_t – \min(x)}{\max(x) – \min(x)} $$
where \(x_t\) is the operating parameter of the li ion battery at time \(t\); \(x’_t\) is the normalized feature data at time \(t\); \(\min(x)\) and \(\max(x)\) are the minimum and maximum values of the input parameter, respectively. The RUL prediction process is illustrated in Figure 6 and involves the following steps:
- Collect cyclic aging data for li ion battery, including capacity expansion, charge-discharge time, internal resistance, etc., and perform preprocessing.
- Normalize feature data and divide it into training and testing sets for li ion battery.
- Set initial network parameters, such as the number of hidden layer neurons, learning rate, maximum iterations, etc.
- Input the training set to train the network, using the Adam optimizer to update network weights and biases.
- Input the testing set into the trained network model to output capacity and RUL predictions for li ion battery.
Experimental Results and Discussion for li ion battery
To analyze the importance of expansion features in RUL prediction for li ion battery, experiments are conducted using the four batteries listed in Table 1 in the Matlab R2021a environment. The LSTM network has 200 hidden layer neurons, one fully connected layer neuron, uses the Adam optimizer with an initial learning rate of 0.001, and a maximum of 900 iterations. RUL prediction results for li ion battery are evaluated using root mean square error, mean absolute error, and absolute error. RMSE and MAE assess the accuracy of capacity trend predictions, while AE evaluates RUL prediction accuracy. The formulas are:
$$ \text{MAE} = \frac{1}{N} \sum_{i=1}^{N} |y_i – \hat{y}_i| $$
$$ \text{RMSE} = \sqrt{\frac{1}{N} \sum_{i=1}^{N} (y_i – \hat{y}_i)^2 } $$
$$ \text{AE} = |T_{\text{RUL}} – P_{\text{RUL}}| $$
where \(y_i\) and \(\hat{y}_i\) represent the true and predicted capacity values at the \(i\)-th cycle for li ion battery, respectively; \(T_{\text{RUL}}\) is the true RUL; and \(P_{\text{RUL}}\) is the predicted RUL.
In practical scenarios, the number of cycles a li ion battery has undergone varies, affecting the amount of training data available. To test the accuracy and robustness of the proposed RUL estimation method for li ion battery and better approximate real-world applications, two different training set proportions, 45% and 55%, are set for each battery. Under each condition, comparative experiments are conducted with expansion features considered (Method A) and without expansion features (Method B). The capacity degradation trend prediction results for the 45% training set are shown in Figure 7.
From Figure 7, it can be seen that under the 45% training set condition, the proposed prediction method achieves accurate RUL predictions for all four li ion battery. Compared to traditional methods without expansion features, incorporating expansion features helps the network better learn aging trends in li ion battery, effectively tracking true capacity changes, closely aligning with practical applications, and further improving RUL prediction accuracy.
Increasing the training set proportion to 55%, the capacity change curve prediction results are shown in Figure 8. Comparing with Figure 7, under the 55% training set condition, capacity and RUL predictions yield more accurate results for li ion battery. This is because different training sets influence prediction outcomes; for LSTM networks, a larger training set proportion means the model can learn more feature data, enhancing generalization and optimizing predictions. Moreover, for different training set proportions, prediction accuracy improves for all li ion battery when expansion features are included. Combining RUL prediction results and error analysis from Table 3, under the 45% training set condition, with expansion features, the prediction curve RMSE and MAE are within 0.82% and 0.70%, respectively, with a maximum AE of 10. Under the 55% training set condition, with expansion features, RMSE and MAE are within 0.49% and 0.46%, respectively, with a maximum AE of 3. These results indicate that for different training set proportions and various aging conditions, the proposed RUL prediction method for li ion battery achieves accurate predictions, demonstrating strong robustness and wide applicability, with overall satisfactory performance.
| Battery ID | Training Set (%) | Method | RUL Predicted | RMSE (%) | MAE (%) | AE |
|---|---|---|---|---|---|---|
| 01 | 45 | A | 154 | 0.554 | 0.412 | 7 |
| B | 161 | 0.896 | 0.634 | 14 | ||
| 55 | A | 110 | 0.358 | 0.298 | 2 | |
| B | 124 | 0.778 | 0.516 | 10 | ||
| 05 | 45 | A | 122 | 0.474 | 0.410 | 10 |
| B | 112 | 0.892 | 0.750 | 20 | ||
| 55 | A | 100 | 0.420 | 0.384 | 3 | |
| B | 112 | 0.660 | 0.532 | 15 | ||
| 09 | 45 | A | 62 | 0.818 | 0.699 | 4 |
| B | 74 | 2.182 | 1.860 | 16 | ||
| 55 | A | 47 | 0.490 | 0.458 | 2 | |
| B | 52 | 1.176 | 1.015 | 7 | ||
| 10 | 45 | A | 195 | 0.480 | 0.368 | 4 |
| B | 242 | 1.486 | 1.026 | 51 | ||
| 55 | A | 150 | 0.296 | 0.268 | 3 | |
| B | 157 | 0.501 | 0.394 | 10 |
To further demonstrate the effectiveness and accuracy of the proposed RUL prediction method for li ion battery, comparisons are made with methods from existing literature: a prediction method based on data preprocessing and long short-term memory neural networks, a method based on Elman neural networks, and a method based on Bi-GRU networks. Using data from Battery 01 with a training set proportion of 45%, comparative experiments are conducted.
The capacity prediction curves for each method are shown in Figure 9. It can be observed that compared to the method proposed in the literature, the proposed method better learns aging characteristics of li ion battery and accurately tracks capacity degradation trends. Further combining RUL prediction results and errors from different methods in Table 4, it is evident that the proposed RUL prediction method for li ion battery offers higher accuracy, lower RMSE and MAE values, and more accurate RUL predictions.
| Prediction Method | RUL Predicted | RMSE (%) | MAE (%) | AE |
|---|---|---|---|---|
| Literature Method A | 156 | 0.664 | 0.525 | 9 |
| Literature Method B | 135 | 0.734 | 0.516 | 12 |
| Literature Method C | 160 | 0.931 | 0.652 | 13 |
| Proposed Method | 155 | 0.554 | 0.412 | 8 |
Conclusion
In this paper, I have proposed a remaining useful life prediction method for li ion battery that incorporates expansion stress, validated using public datasets. The following conclusions can be drawn:
- Both reversible and irreversible expansion in li ion battery are closely related to capacity changes, exhibiting stronger correlations compared to parameters like internal resistance, and can better reflect battery degradation in li ion battery.
- Utilizing expansion stress for RUL prediction in li ion battery achieves higher prediction accuracy and stronger robustness, with maximum RMSE and MAE below 0.82% and 0.70%, respectively, demonstrating the effectiveness of the approach for li ion battery.
The proposed method leverages mechanical features such as reversible and irreversible expansion from li ion battery, combined with LSTM networks, to accurately predict RUL under various aging conditions and training set proportions. This advancement contributes to the safe and efficient management of li ion battery in practical applications, highlighting the importance of multi-physical field considerations in li ion battery research. Future work could explore real-time implementation and integration with other sensor data for enhanced prediction capabilities in li ion battery systems.