
In the era of escalating electric vehicle adoption, the management of retired lithium-ion batteries has emerged as a critical challenge and opportunity. As the world’s largest market for electric vehicles, the volume of decommissioned power batteries is projected to surge dramatically in the coming years. The hierarchical reuse of these retired batteries presents a promising pathway for cost-effective energy storage solutions. However, the cornerstone of such reuse lies in the efficient and rapid assessment of battery consistency, primarily quantified by the State of Health (SOH). Traditional SOH evaluation methods, often reliant on time-consuming capacity calibration or complex electrochemical impedance spectroscopy, hinder the economic viability of large-scale battery repurposing. This study delves into a novel, expedited approach for SOH estimation, specifically targeting lithium iron phosphate battery modules. By harnessing the power of probability density function analysis on charge-discharge voltage data, we establish a robust linear correlation between SOH and specific probability density features, paving the way for swift and practical battery module grading.
The intrinsic complexity of lithium-ion battery electrochemistry makes performance degradation a multifaceted phenomenon. For lithium iron phosphate battery systems, the loss of active material and recyclable lithium ions are primary aging mechanisms, manifesting as the shortening of voltage plateaus during charge and discharge cycles. The capacity incremental analysis method has been widely employed to study these plateaus by transforming voltage-capacity curves. However, it encounters practical limitations, such as the potential for division by zero when voltage remains constant. To circumvent this, we explore the probability density function as an alternative and mathematically equivalent tool. The PDF offers a statistical perspective, quantifying the likelihood of voltage values occurring within a specific range during operation. As a lithium iron phosphate battery module ages, the distribution of these voltage values shifts, and key statistical metrics extracted from the PDF can serve as potent indicators of SOH.
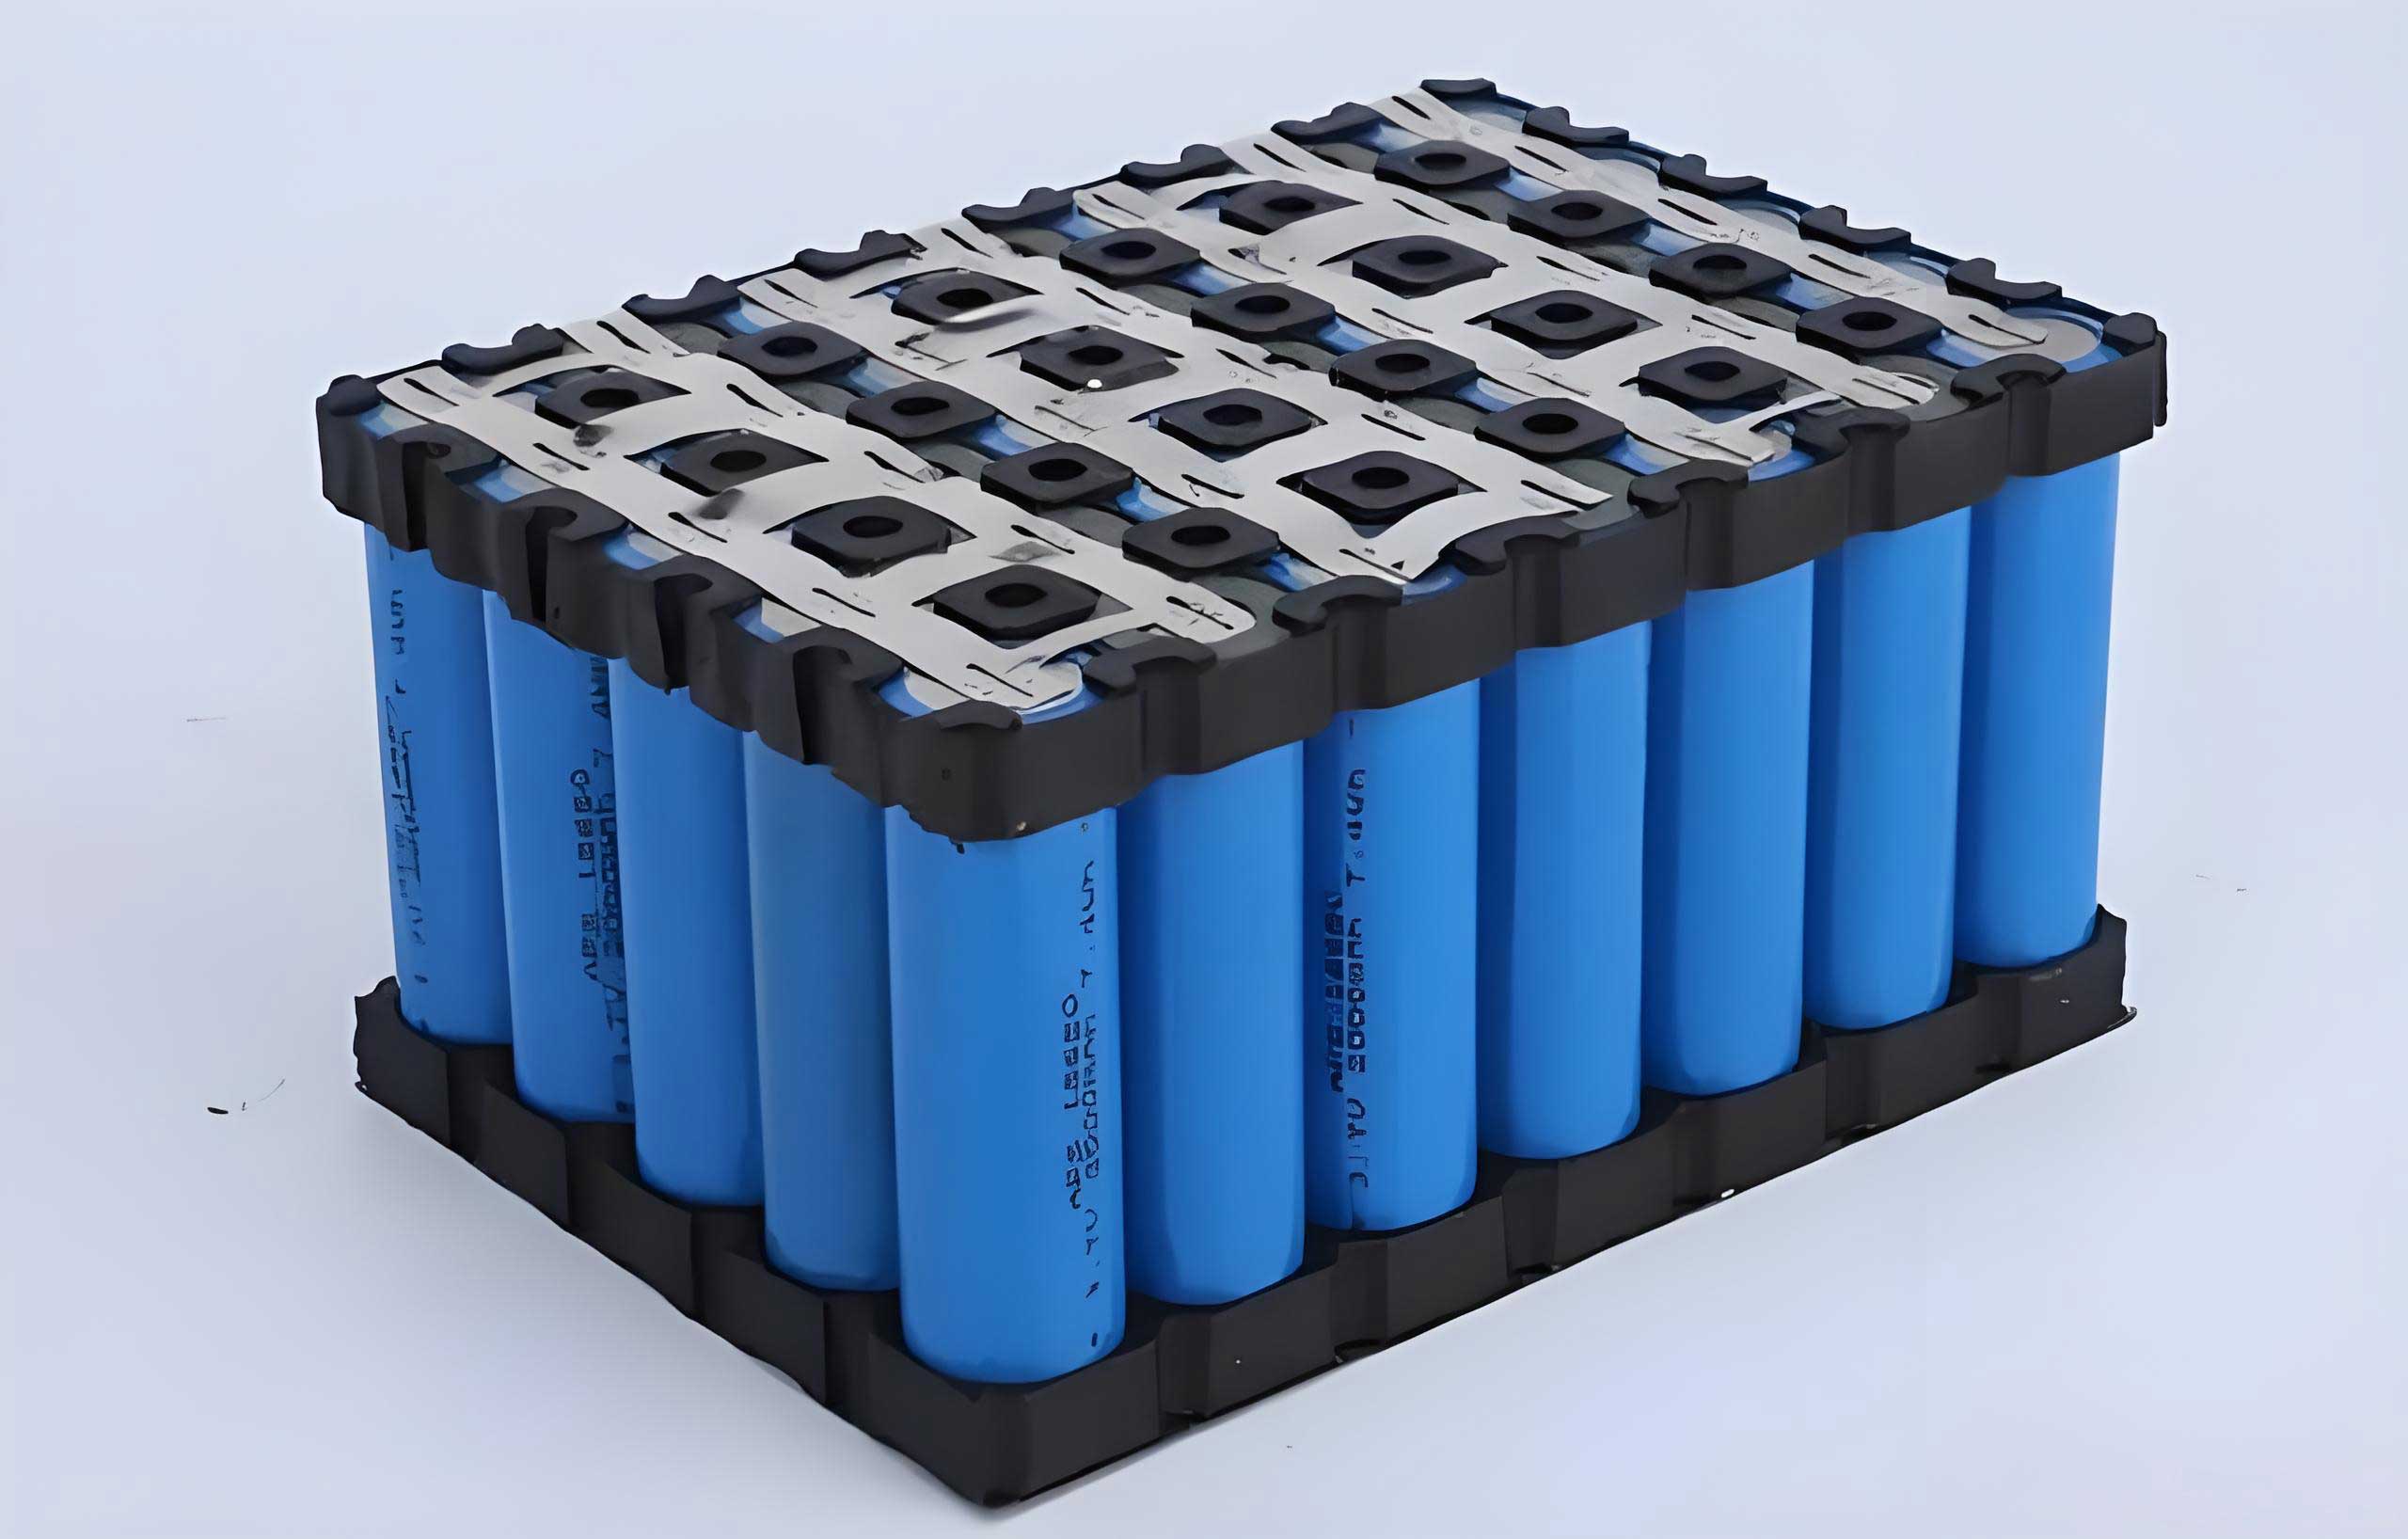
Our investigation centers on retired lithium iron phosphate battery modules originally used in electric vehicles. A module, typically composed of multiple 26650 cells in a 15P4S configuration, represents a more practical unit for evaluation compared to individual cells, as dismantling modules into cells is costly and prone to damage. The core hypothesis is that the probability density of voltage at characteristic points on the charge or discharge curve holds a definitive relationship with the module’s available capacity, hence its SOH. To test this, we subjected several lithium iron phosphate battery modules to controlled aging cycles, periodically measuring their available capacity to determine SOH. Concurrently, we collected high-resolution voltage data during standard charge and discharge cycles. This data was then processed using PDF analysis to extract features—namely, the peak probability density and the integrated probability within specific voltage intervals—which were subsequently correlated with the measured SOH values.
The mathematical foundation linking PDF and ICA is crucial for understanding its validity. Let us denote the voltage sequence as \( V_{d,k} = V_0 + k \delta V \) for \( k = 0, 1, 2, \ldots \), where \( V_0 \) is the starting voltage and \( \delta V \) is a small voltage increment. Similarly, the capacity sequence is \( Q_{d,k} = Q_0 + k \delta Q \). The fundamental relationship is \( V = f(Q) \) and \( Q = f^{-1}(V) \). For a given voltage \( V_{d,k} \), the number of data points (frequency) \( N_k \) within the interval \( [V_{d,k}, V_{d,k+1}] \) is counted. The probability density \( P_k \) at \( V_{d,k} \) is then \( P_k = N_k / L \), where \( L \) is the total number of sampling points. The derivative \( dQ/dV \) at \( V_{d,k} \) can be approximated as:
$$ \frac{dQ}{dV} \bigg|_{V_{d,k}} \approx \frac{Q_{d,k+1} – Q_{d,k}}{\delta V}. $$
Through derivation, it can be shown that:
$$ \frac{dQ}{dV} \bigg|_{V_{d,k}} \propto N_k \frac{\delta Q}{\delta V} = P_k L C_{QV}, $$
where \( C_{QV} = \delta Q / \delta V \). This proportionality confirms the equivalence between the PDF peak height and the ICA peak height. Therefore, analyzing the probability density function is fundamentally akin to analyzing the incremental capacity, but without the numerical instability issues.
The experimental procedure was designed to simulate real-world aging. We utilized retired lithium iron phosphate battery modules with a nominal capacity of 40 Ah. The aging protocol involved repeated charge-discharge cycles at a rate of C/2, with 100% depth of discharge. After every 100 cycles, a reference capacity test was conducted at a C/3 rate to determine the actual available capacity \( C_{avl} \). The SOH was calculated using the standard formula:
$$ \text{SOH} = \frac{C_{avl}}{C_{rated}} \times 100\%. $$
Voltage data during these C/3 calibration cycles was recorded at a high sampling frequency for subsequent PDF analysis. The data processing flow involved importing the voltage array into computational software, generating a histogram, and then fitting a continuous probability density function using a kernel smoothing function. The key steps are summarized below:
| Step | Action | Mathematical Representation |
|---|---|---|
| 1 | Collect Voltage Data | \( \mathbf{x} = [V_1, V_2, \ldots, V_n] \) |
| 2 | Compute PDF | \( [f, xi] = \text{ksdensity}(\mathbf{x}) \) |
| 3 | Identify Characteristic Peaks | Locate maxima in \( f \) vs. \( xi \) plot |
| 4 | Extract Features | Peak height (PD), peak area (P) |
The results were striking. The PDF curves derived from the charge and discharge data of the lithium iron phosphate battery modules exhibited distinct peaks. During charging, a prominent peak (denoted A1) appeared around 13.5 V (approximately 3.375 V per cell). During discharging, a peak (A2) was observed near 12.9 V (approximately 3.225 V per cell). These peaks correspond to the superimposed phase transition processes of lithium iron phosphate cathode material. As the cycle number increased and SOH declined, these PDF peaks systematically increased in height and shifted slightly towards lower voltages, visually corroborating the capacity fade. The central finding is the strong linear relationship between the SOH of the lithium iron phosphate battery module and the probability density value at these peaks.
The quantitative analysis solidifies this observation. For the charging process, plotting SOH against the probability density of peak A1 revealed a highly linear trend. Similarly, for the discharging process, SOH versus the probability density of peak A2 also showed excellent linearity. We performed linear regression to establish the empirical models. The equations and their coefficients of determination (R²) are presented in the following table:
| Process | Linear Regression Equation | R² Value |
|---|---|---|
| Charging | \( \text{SOH} = 119.7 – 16.71 \times PD_{A1} \) | 0.9727 |
| Discharging | \( \text{SOH} = 148.5 – 32.19 \times PD_{A2} \) | 0.9639 |
These results unequivocally demonstrate that probability density serves as an excellent rapid evaluation index for the health of a lithium iron phosphate battery module. The high R² values indicate that over 96% of the variance in SOH can be explained by the PDF-derived feature alone. For comparison, we also examined the relationship between SOH and the integrated probability (the area under the PDF curve around the peak). The linearity was notably inferior, especially for the charging process, as shown below:
| Process | Linear Regression Equation (Probability) | R² Value |
|---|---|---|
| Charging | \( \text{SOH} = 168.8 – 1.610 \times P_{A1} \) | 0.3664 |
| Discharging | \( \text{SOH} = -2.80 + 1.770 \times P_{A2} \) | 0.9055 |
Thus, while probability from the discharge curve shows a reasonable correlation, probability density is a far superior and more consistent indicator across both charge and discharge phases for assessing the state of health of a lithium iron phosphate battery module.
The practical application of this method is straightforward and fast. Once the linear model (e.g., \( \text{SOH} = a – b \times PD \)) is established for a given type of lithium iron phosphate battery module, evaluating an unknown module requires only a single charge or discharge cycle—preferably under standardized conditions like C/3. The battery management system records the voltage profile, which is then processed to generate the PDF and extract the probability density at the predetermined characteristic voltage. This value is plugged into the linear equation to instantly obtain an estimated SOH without the need for a full, time-consuming capacity test. For instance, consider a retired lithium iron phosphate battery module with an actual SOH of 75.30%. Its charge voltage PDF yields a \( PD_{A1} \) of 2.695. Substituting into the charging model: \( \text{SOH} = 119.7 – 16.71 \times 2.695 = 74.67\% \), an error of only -0.84%. Using the discharge model with \( PD_{A2} = 2.263 \) gives \( \text{SOH} = 148.5 – 32.19 \times 2.263 = 75.65\% \), an error of +0.46%. This high accuracy validates the method’s potential for rapid screening in battery second-life applications.
Further discussion illuminates the advantages of the PDF method. Firstly, it overcomes the inherent limitation of ICA when dealing with perfectly flat voltage plateaus. Secondly, it operates directly on voltage-time data readily available from standard battery monitors, requiring no complex instrumentation or invasive measurements. Thirdly, by focusing on the module level, it aligns with the practical constraints of battery repurposing, where dismantling is undesirable. The method’s sensitivity stems from its direct reflection of electrode phase transformation dynamics. As the lithium iron phosphate battery ages, the solid-phase diffusion of lithium ions slows, and the active material area diminishes, which compresses the voltage plateau. The PDF captures this compression by showing a higher concentration of data points (hence higher probability density) at a narrowing voltage range. This physical basis underpins the robust statistical correlation. It is worth noting that the specific coefficients in the linear model may vary slightly depending on the module’s manufacturer, cell configuration, and initial condition. Therefore, calibrating the model with a small sample of modules from a given batch is recommended for optimal accuracy. Nonetheless, the fundamental linear relationship between SOH and probability density appears to be a generalizable feature for lithium iron phosphate chemistry.
In the broader context of energy storage, the ability to quickly and reliably grade retired lithium iron phosphate battery modules is transformative. It significantly reduces the cost and time associated with the testing phase of battery second-life projects. This efficiency makes the business case for grid-scale storage using repurposed batteries more compelling. Moreover, the method can be integrated into onboard diagnostic systems for electric vehicles to provide real-time SOH estimations, aiding in maintenance and end-of-life prediction. The environmental benefits are also substantial, as it facilitates the circular economy for battery materials, reducing waste and the demand for virgin resources. Future work could explore the application of this PDF-based technique to other lithium-ion battery chemistries, such as NMC or LTO, and investigate the fusion of probability density features with other simple parameters like internal resistance or temperature rise for an even more comprehensive health assessment model. Machine learning algorithms could be trained on large datasets of PDF curves to predict not only SOH but also remaining useful life under various operating conditions.
To delve deeper into the mathematical formulation, the probability density function for a continuous random variable \( X \) (here, voltage) is defined such that the probability of \( X \) falling within a specific interval \( [a, b] \) is given by \( P(a \leq X \leq b) = \int_a^b f(x) dx \), where \( f(x) \) is the PDF. In our discrete sampling context, we estimate \( f(x) \) from the data. The kernel density estimation used in our processing smooths the histogram and provides a continuous approximation. The choice of kernel bandwidth can affect the smoothness of the resulting PDF, but for the characteristic peaks of a lithium iron phosphate battery module, the results are robust across reasonable bandwidth selections. The key equations governing the data transformation are:
$$ \text{Voltage Sequence: } V_i, \quad i = 1, 2, \ldots, N. $$
$$ \text{Estimated PDF: } \hat{f}(v) = \frac{1}{Nh} \sum_{i=1}^N K\left(\frac{v – V_i}{h}\right), $$
where \( K(\cdot) \) is the kernel function (e.g., Gaussian) and \( h \) is the bandwidth. The peak location \( v_{\text{peak}} \) satisfies \( \hat{f}'(v_{\text{peak}}) = 0 \) and \( \hat{f}”(v_{\text{peak}}) < 0 \). The probability density feature is simply \( \hat{f}(v_{\text{peak}}) \). This computational procedure is efficient and can be implemented in embedded systems for real-time analysis, further enhancing the method’s practicality for evaluating lithium iron phosphate battery modules in various settings.
In conclusion, this study establishes the probability density function analysis of charge-discharge voltage data as a powerful, rapid, and accurate method for evaluating the state of health of retired lithium iron phosphate battery modules. The strong linear relationship between SOH and the probability density at characteristic voltage peaks during both charge and discharge processes provides a simple yet effective quantitative tool. This method bypasses the limitations of traditional capacity tests and incremental capacity analysis, offering a viable solution for the fast screening needed in the growing field of battery second-life applications. By enabling low-cost and efficient consistency grading, this approach can accelerate the adoption of retired lithium iron phosphate battery modules in energy storage systems, contributing to a more sustainable energy ecosystem. The robustness of the linear models, as evidenced by high coefficients of determination, underscores the reliability of probability density as a key indicator for the health assessment of lithium iron phosphate battery packs. As the world continues to embrace electrification, such innovative diagnostic techniques will be indispensable for managing the lifecycle of battery resources effectively.