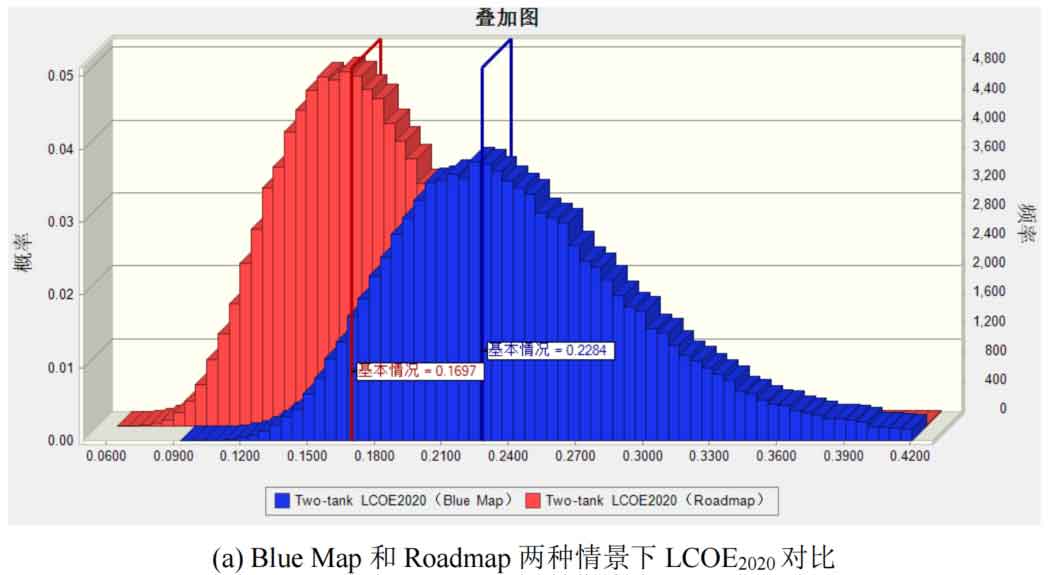
Based on the probability distribution and range of changes of the input parameters mentioned above, use Monte Carlo simulation method to analyze and evaluate the sensitivity of key input parameter changes. To ensure the accuracy and robustness of the estimation results, the number of simulations is set to 100000.
Obtain the distribution of LCOE for different energy storage systems using the above equation and input parameters, with 2020 as the time point. In addition to obtaining the levelized electricity cost of energy storage systems under different conditions, their distribution can also be observed. From the distribution results, it can be concluded that the larger the curve range, the wider the possible distribution of LCOE results, indicating greater uncertainty in the energy storage technology.
(1) Dual tank molten salt energy storage system
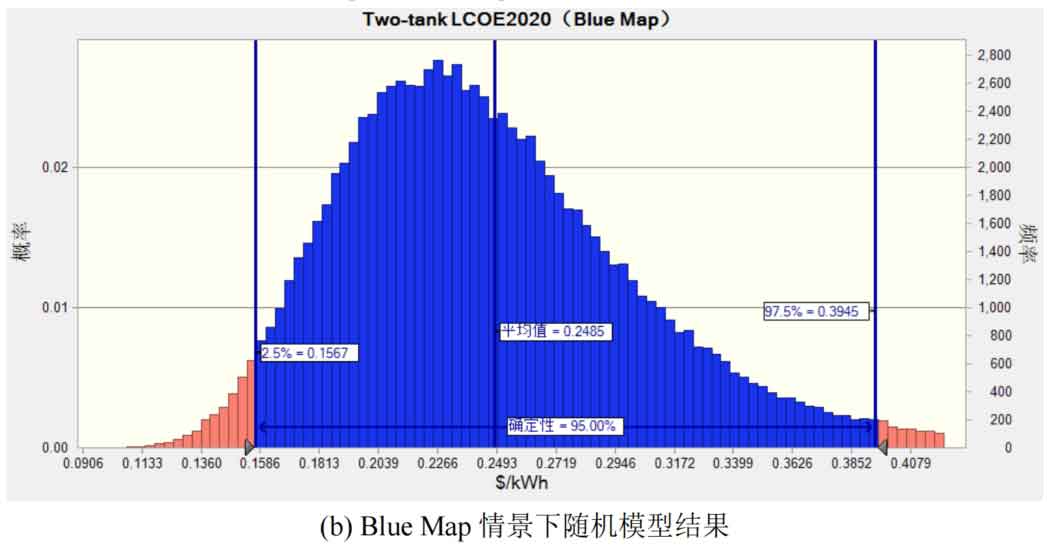
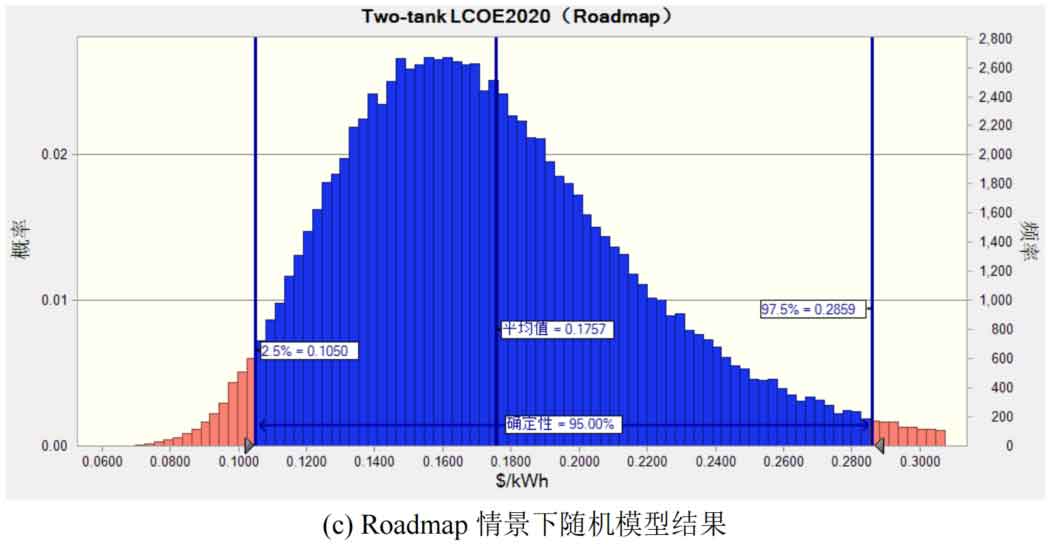
Figure 1 shows the stochastic model results of LCOE for a dual tank molten salt energy storage system. The result of a random model is no longer a single value, but a distribution of many possible values. From the distribution of LCOE results for the two scenarios in Figure 1 (a), it can be seen that the LCOE2020 value of the system in the Roadmap scenario is mostly smaller than the value in the Blue Map scenario. This is mainly due to cost reduction caused by economies of scale. From the results of Figure 1 (b) and Figure 1 (c), it can be seen that in the Blue Map scenario, the mean value of system LCOE2020 is 0.2485 $/kWh, with 95% certainty ranging from 0.1567 to 0.3945 $/kWh. In the Roadmap scenario, the mean LCOE2020 of the system is 0.1757 $/kWh, with 95% certainty being between 0.1050 and 0.2859 $/kWh.
In two scenarios of cumulative installed capacity development for photothermal power plants, the distribution of LCOE2020 results has a long tail at the right end, indicating that in some cases, the levelized electricity cost of a dual tank molten salt energy storage system may have an extremely high value, but the probability of such a situation occurring is relatively small. And the left end of the result distribution has a relatively short tail, indicating that there are fewer cases of extremely small values. Compared to deterministic models, using a stochastic model can observe a more comprehensive distribution of LCOE.
Figure 2 shows the sensitivity analysis results of parameters affecting LCOE2020 in a dual tank molten salt energy storage system. In the hurricane chart, the centerline represents the levelized kilowatt hour cost under the baseline scenario (the center value of parameters in the random model). Sort the results by their impact on LCOE2020, from top to bottom in descending order. From the graph, it can be seen that the importance of factors affecting the LCOE of the system varies between the two scenarios of photovoltaic power plant development.
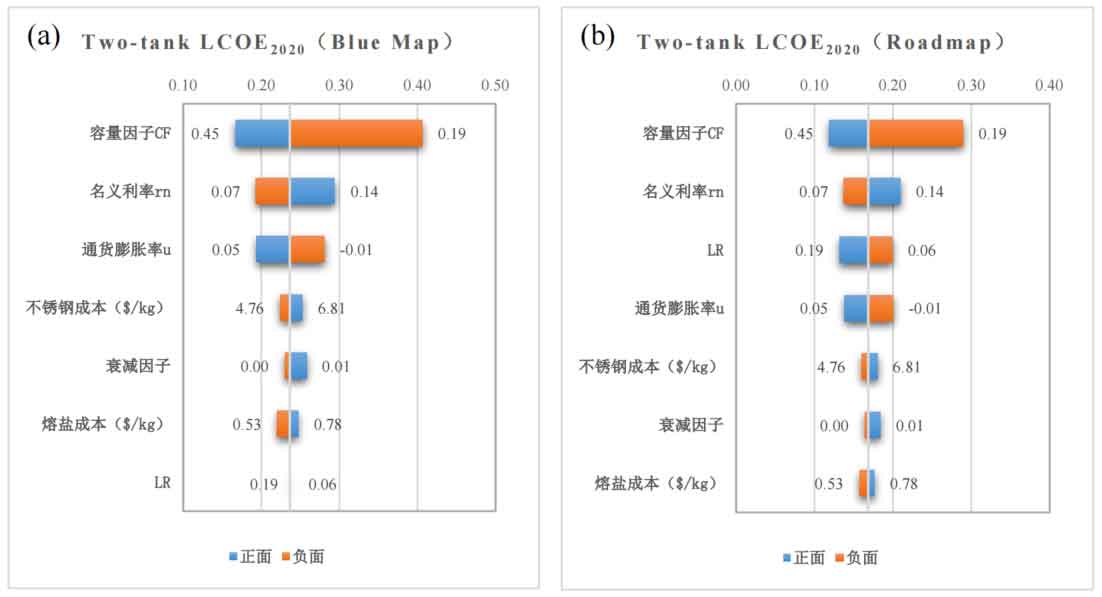
Figure 2 (a) shows the key driving factors of LCOE2020 in a dual tank molten salt energy storage system under the Blue Map scenario. From the graph, it can be seen that the change in capacity factor has the most significant impact on the LCOE2020 system, with a negative correlation between the two. As the capacity factor increases, the cost of system levelized electricity decreases. The sensitivity analysis results indicate that increasing the capacity factor from 32% of the benchmark value to 45% reduces the system’s levelized electricity cost from 0.2364 $/kWh to 0.1667 $/kWh. If the capacity factor is reduced to 19%, it leads to an increase in the system’s levelized electricity cost to 0.4063 $/kWh.
Figure 2 (b) shows the ranking of key influencing factors in the LCOE2020 system under the Roadmap scenario. The sensitivity analysis results indicate that capacity factor is still the most critical influencing factor on the LCOE of the system. The capacity factor has increased from 32% to 45%, and the levelized electricity cost of the system has decreased from 0.1666 $/kWh to 0.1188 $/kWh. When the capacity factor decreases from 32% to 19%, the system’s levelized electricity cost increases from 0.1666 $/kWh to 0.2895 $/kWh.
In both scenarios, the nominal interest rate is the second most important factor affecting the LCOE2020 system, and as the nominal interest rate increases, the system’s cost of leveling electricity also increases. In the Blue Map scenario, the learning rate LR has the least impact on the system’s levelized cost of electricity, with learning rate LR varying between 6% and 19%, and the system’s levelized cost of electricity remaining around 0.2364 $/kWh. However, in the Roadmap scenario, the learning rate LR is the third most important factor affecting the cost of system leveling, indicating its significant effect in large-scale capacity. As the learning rate increases, the cost of system leveling decreases. The learning rate increased from the baseline to 19%, and the system LCOE2020 value decreased from 0.1666 $/kWh to 0.1316 $/kWh. When the learning rate decreased from the baseline to 6%, the system LCOE2020 value increased from 0.1666 $/kWh to 0.1994 $/kWh. The cost of molten salt has the least impact on the cost of system levelized kilowatt hours, and it is positively correlated with the cost of system levelized kilowatt hours. The cost of molten salt fluctuates between 0.5255-0.7842 $/kg, while the LCOE2020 value of the system varies from 0.1570 to 0.1762 $/kWh.
(2) Concrete sensible heat energy storage system
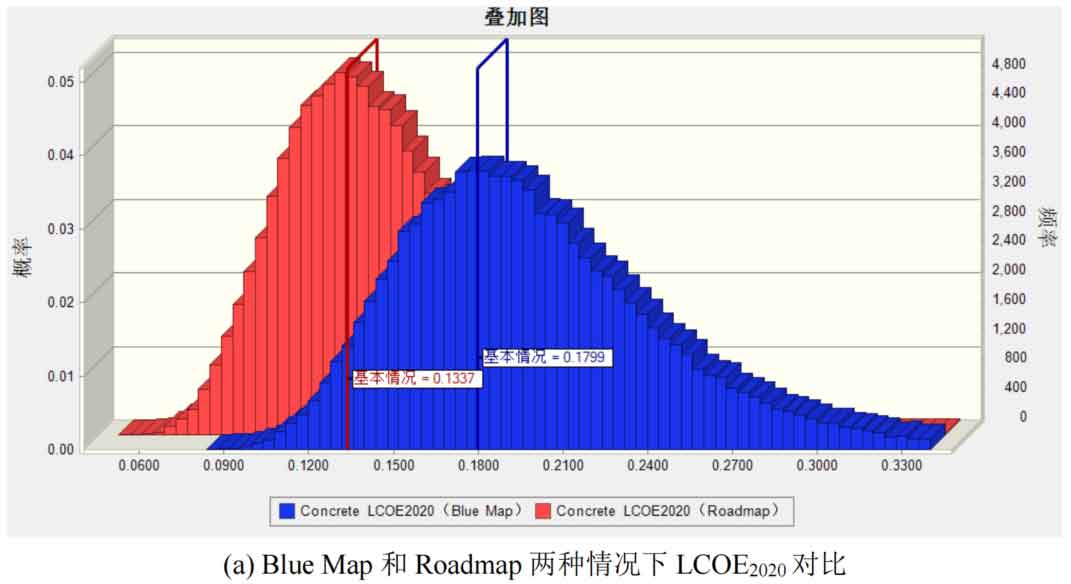
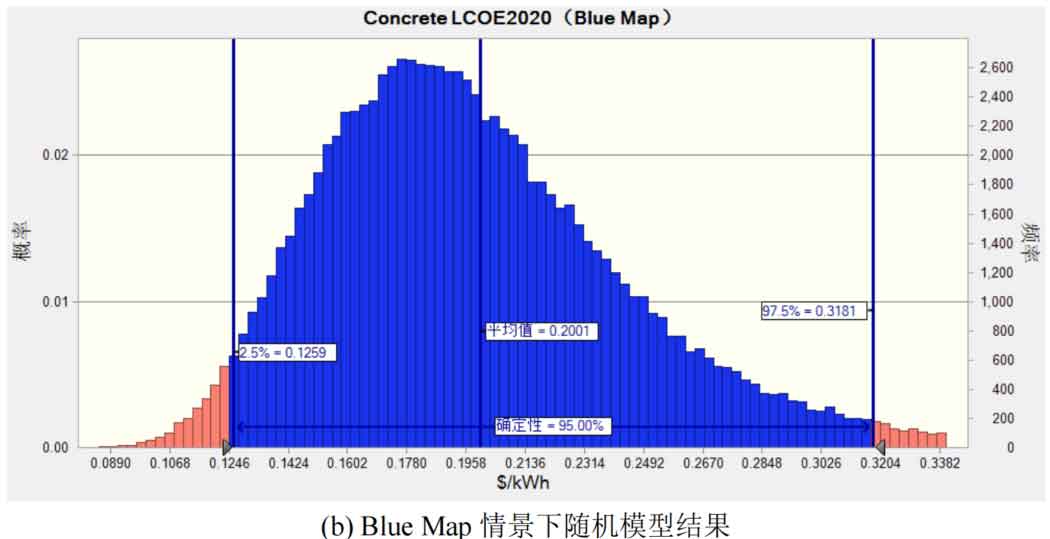
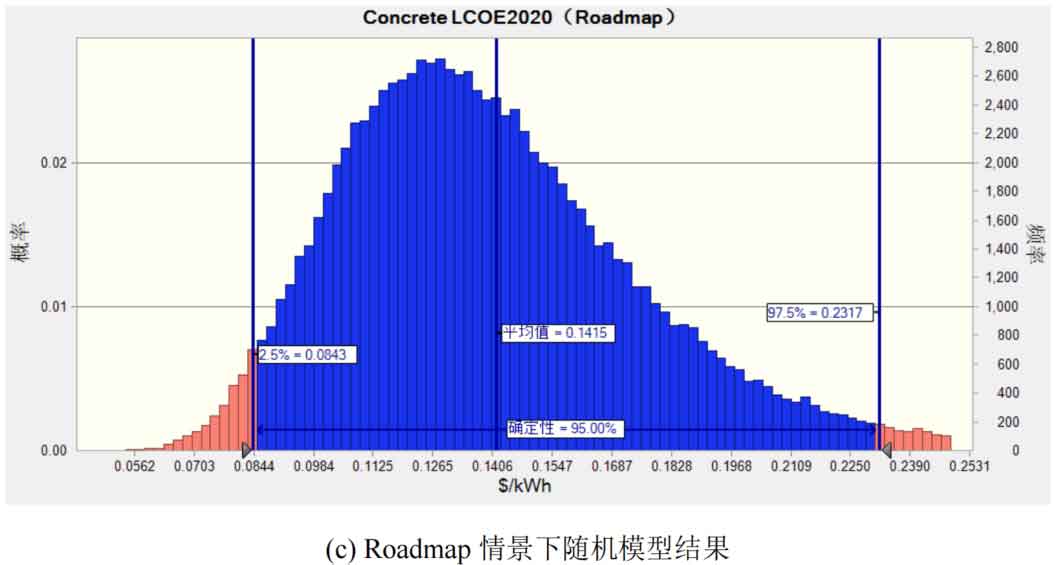
Figure 3 shows the random model analysis results of the concrete sensible heat energy storage system LCOE. In most cases, the LCOE2020 value of the system in the Roadmap scenario is still lower than the value in the Blue Map scenario. From Figure 3 (b), it can be seen that in the Blue Map scenario, the mean value of the system LCOE2020 is 0.2001 $/kWh, and 95% of the LCOE2020 value is between 0.1259 and 0.3181 $/kWh. In Figure 3 (c), under the Roadmap scenario, the mean LCOE2020 of the system is 0.1415 $/kWh, and 95% of the LCOE2020 values are between 0.0843 and 0.2317 $/kWh. From the symmetry of the distribution, it can be seen that in both cases, the LCOE2020 value is skewed to the right, indicating a high likelihood of a larger value appearing in the system LCOE2020.
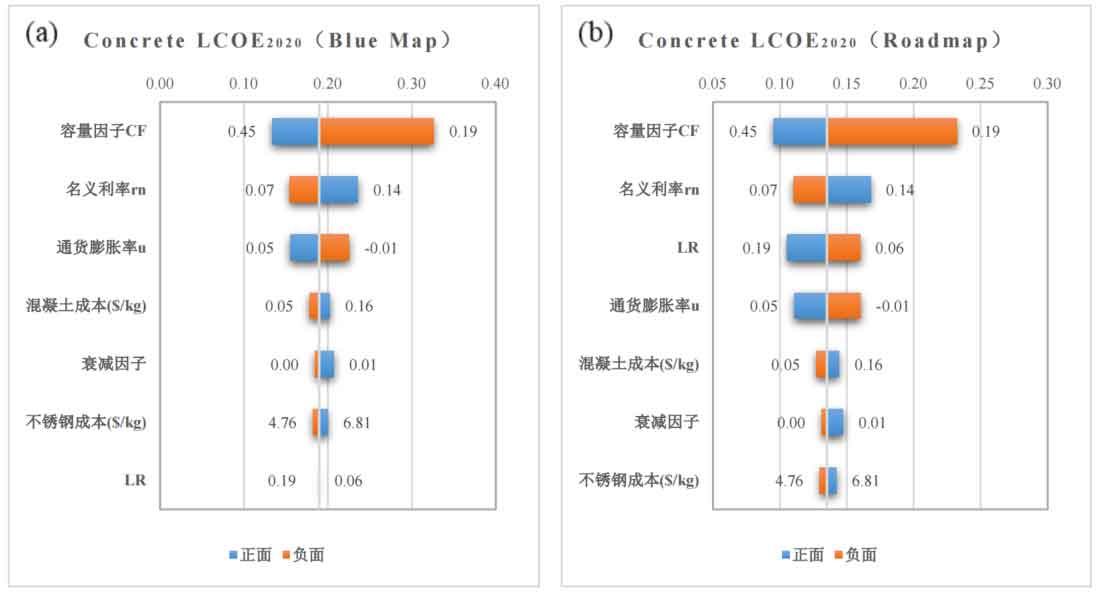
Figure 4 shows the sensitivity analysis results of the parameters affecting LCOE2020 in the concrete sensible heat energy storage system. From the hurricane chart, it can be seen that under the two development scenarios, capacity factor is the most important factor affecting LCOE2020, followed by nominal interest rate. The inflation rate will affect the size of the real interest rate. As the inflation rate increases, the actual discount rate decreases, resulting in a decrease in the LCOE2020 value of the system. In the Blue Map scenario, the learning rate LR has the least impact on the system LCOE2020, and within the distribution range of learning rate LR, the LCOE2020 value of the energy storage system remains basically unchanged. This is mainly because in this situation, the scale of the photovoltaic power plant is still relatively small, and the impact of learning rate is relatively small. However, in the Roadmap scenario, the scale of solar thermal power plants is relatively high, and the learning rate LR has a significant impact on the system’s levelized cost of electricity, becoming the most influential factor on LCOE2020 besides capacity factor and nominal interest rate.
(3) Single phase change energy storage system
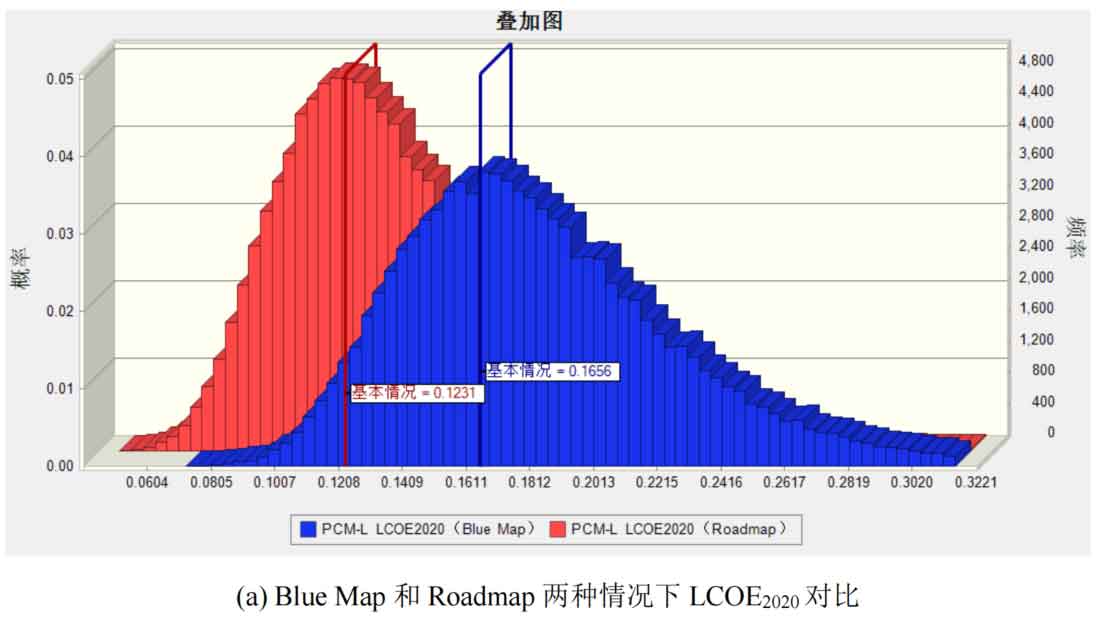
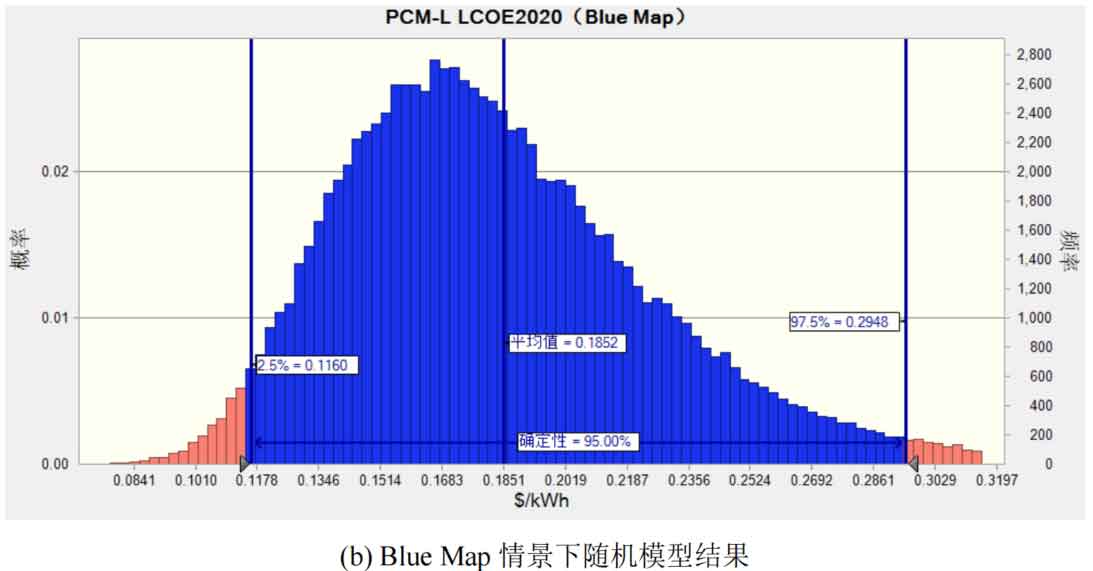
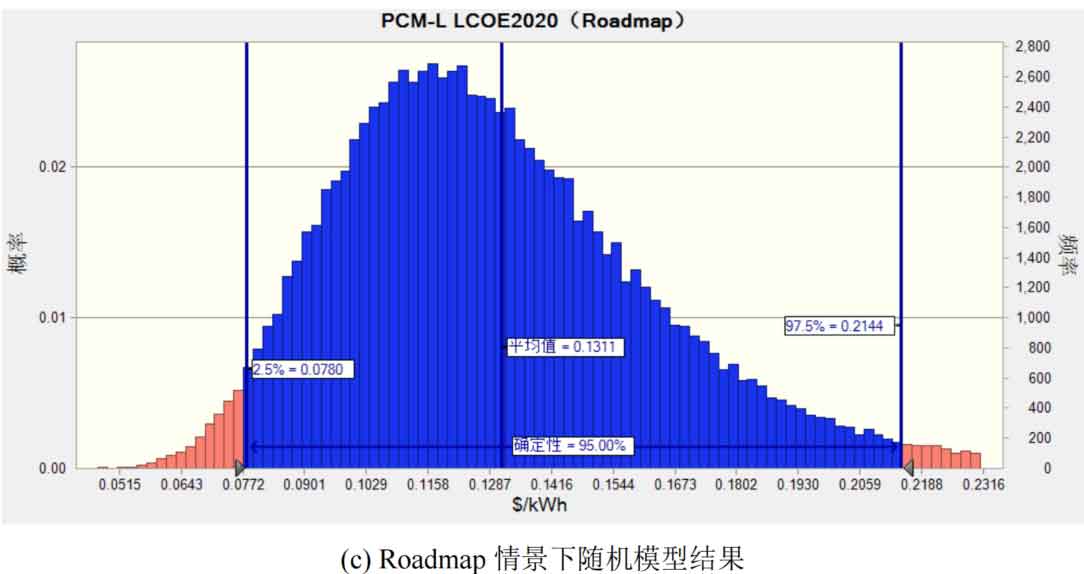
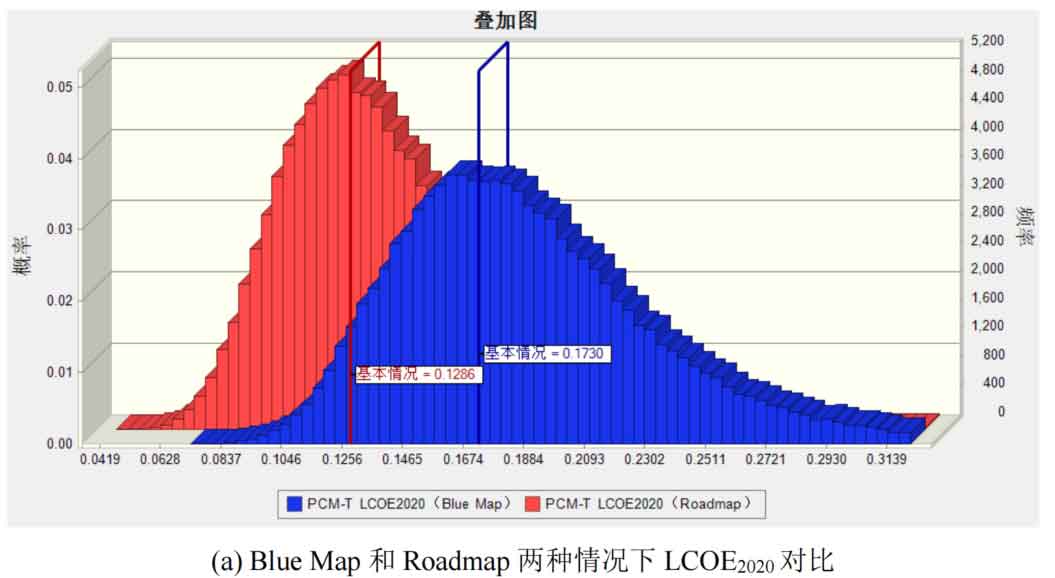
Figure 5 shows the random model results of LCOE for low-temperature phase change energy storage system. From the graph, it can be seen that the average cost of levelized kilowatt hours for low-temperature phase change energy storage systems is lower than the above two energy storage systems. As shown in Figure 5 (b), under the BlueMap scenario, the average LCOE2020 of the low-temperature phase change energy storage system is 0.1852 $/kWh, and 95% of the LCOE2020 value falls between 0.1160 and 0.2948 $/kWh. In Figure 5 (c), under the Roadmap scenario, the mean LCOE2020 of the system is 0.1311 $/kWh, and 95% of the LCOE2020 values are between 0.0780 and 0.2144 $/kWh. In both cases, the levelized cost of electricity in the system also shows a longer rightward trailing distribution, indicating that in some extreme cases, the low-temperature phase change energy storage system LCOE2020 may also have a larger extreme value.
Figure 6 shows the sensitivity analysis results of parameters affecting LCOE2020 in low-temperature phase change energy storage systems. From the hurricane chart, it can be seen that, similar to the impact results of the energy storage system mentioned above, in both development scenarios, capacity factor is the most important factor affecting LCOE2020, followed by nominal interest rate. Due to the significant proportion of tank cost in low-temperature phase change energy storage systems, the price of stainless steel has a relatively significant impact on the LCOE2020 system. In the Blue Map scenario, when the price of stainless steel decreases from 5.63 $/kg to 4.76 $/kg, the system’s levelized electricity cost decreases from 0.1754 $/kWh to 0.1650 $/kWh. When the price of stainless steel rises to 6.81 $/kg, the system’s levelized electricity cost increases to 0.1894 $/kWh. In the Roadmap scenario, when the price of stainless steel varies within the range of 4.76-6.81 $/kg, the variation range of the low-temperature phase change energy storage system LCOE2020 is 0.1176-0.1350 $/kWh. In both scenarios, the price of molten salt as a heat transfer fluid has a relatively small impact on the system’s levelized electricity cost, mainly because it accounts for a small proportion of the system’s cost composition.
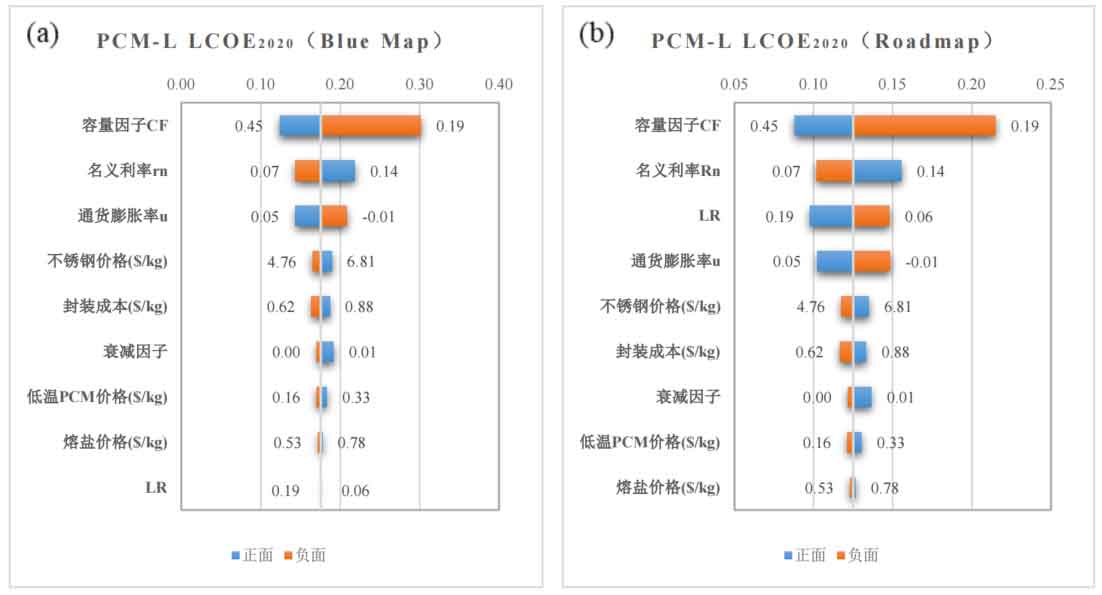
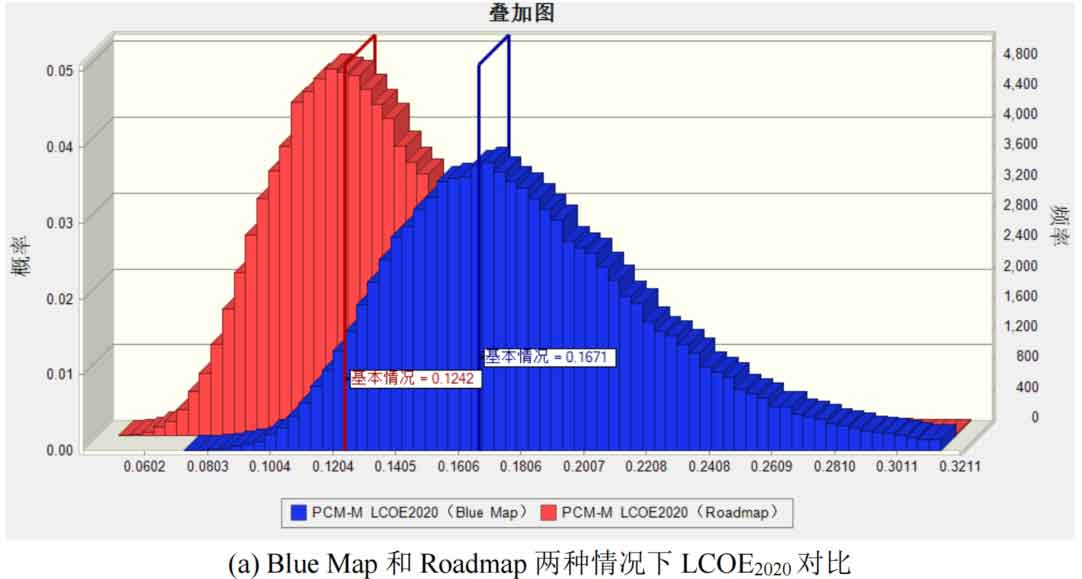
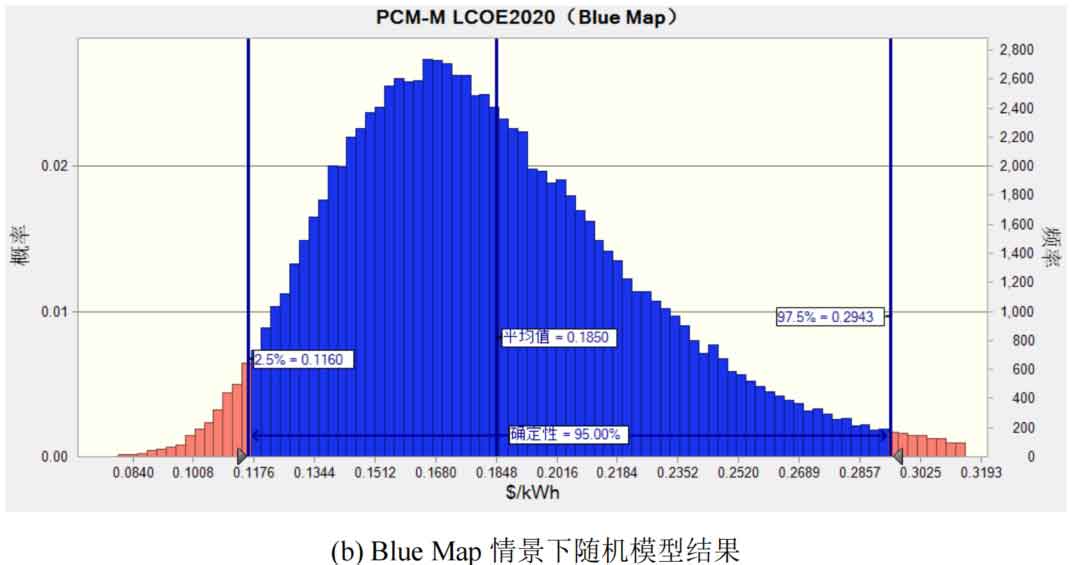
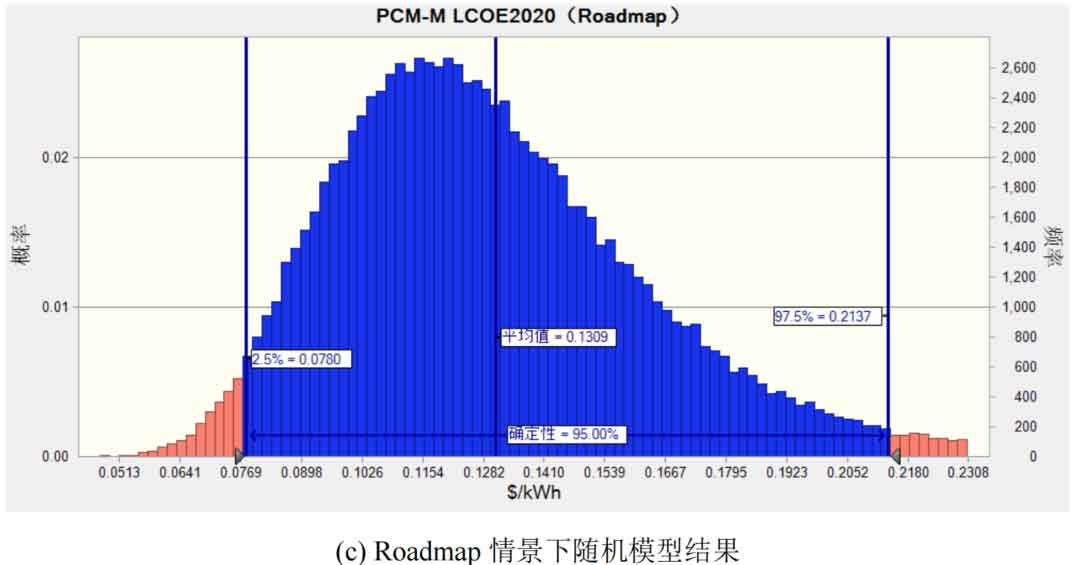
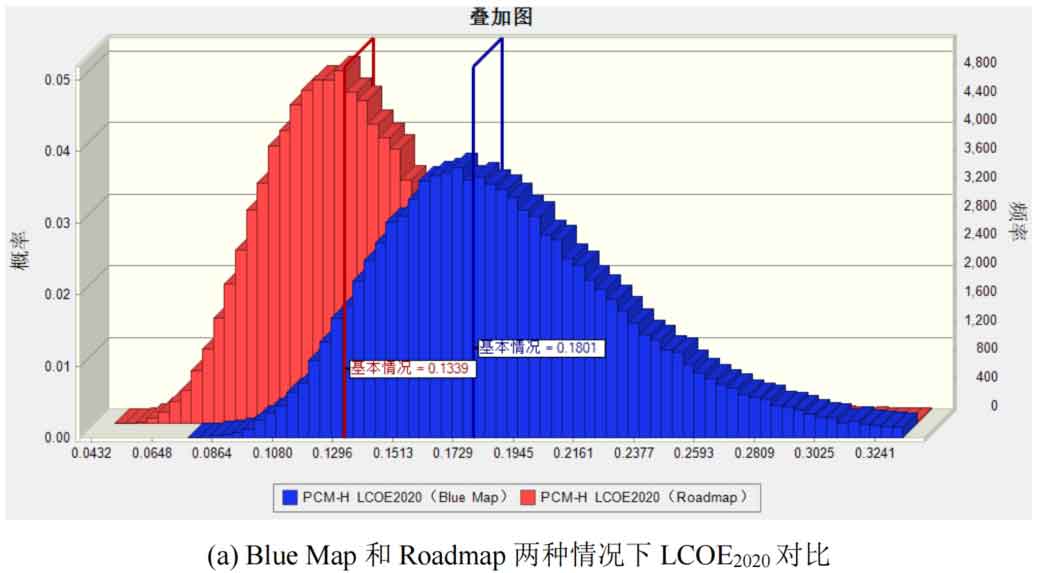
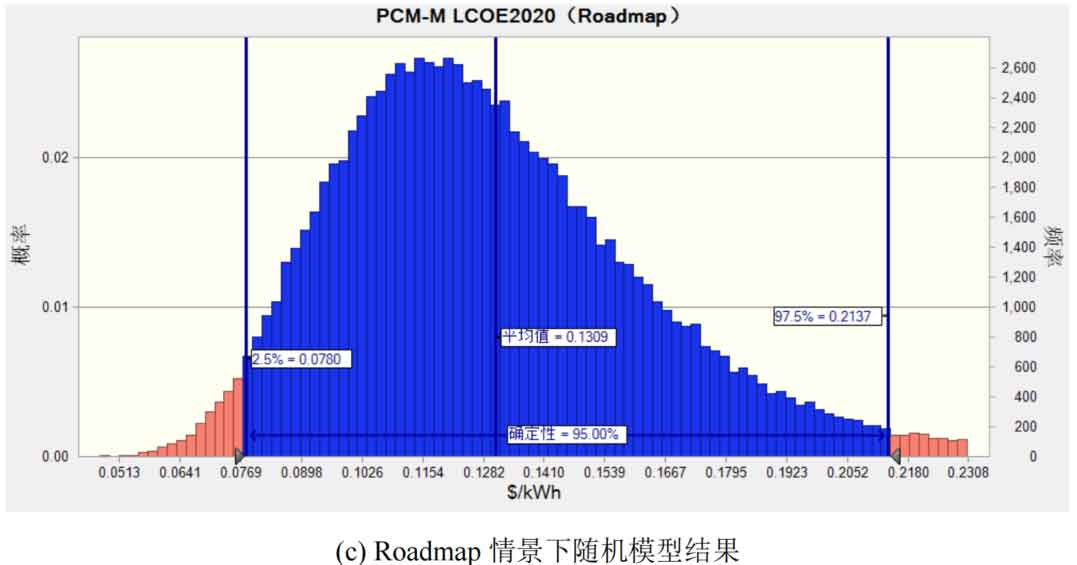
Figure 7 shows the stochastic model results of LCOE for a medium temperature phase change energy storage system. From the graph, it can be seen that the benchmark levelized kilowatt hour cost of a medium temperature phase change energy storage system is slightly higher than that of a low-temperature phase change energy storage system. This is mainly because the energy storage and phase change material prices of the system have increased, and the combined effect of the two has also increased the levelized kilowatt hour cost of the system, but the amplitude is relatively small. As shown in Figure 6-13 (b), under the Blue Map scenario, the average LCOE2020 of the medium temperature phase change energy storage system is 0.1850 $/kWh, and 95% of the LCOE2020 values are distributed between 0.1160 and 0.2943 $/kWh. In Figure 7 (c), under the Roadmap scenario, the mean LCOE2020 of the system is 0.1309 $/kWh, and the value of LCOE2020 has 95% certainty to be between 0.0780 and 0.2137 $/kWh. In both cases, the system’s levelized cost per kilowatt hour also exhibits a longer rightward trailing distribution.
Figure 8 shows the sensitivity analysis results of parameters affecting LCOE2020 in a medium temperature phase change energy storage system. From the hurricane chart, it can be seen that under the two development scenarios, capacity factor and nominal interest rate are still the most important factors affecting LCOE2020. In a medium temperature phase change energy storage system, the impact of packaging cost on the system’s levelized electricity cost is higher than the impact of stainless steel price. This is mainly because as the phase change temperature increases, the density of phase change materials increases, and the mass per unit volume of phase change materials increases, resulting in an increase in packaging costs. The packaging cost is positively correlated with the system’s levelized kilowatt hour cost. The unit mass packaging cost of phase change materials fluctuates in the range of 0.62-0.88 $/kg. In the Blue Map scenario, the LCOE2020 of the medium temperature phase change energy storage system varies in the range of 0.1635-0.1875 $/kWh, while in the Roadmap scenario, the LCOE2020 of the medium temperature phase change energy storage system varies in the range of 0.1165-0.1336 $/kWh. In both scenarios, the prices of phase change materials and molten salt have a relatively small impact on the system’s levelized electricity cost. This is because the prices of phase change materials and molten salt are relatively low, and they account for a relatively small proportion of the system cost. The factors such as interest rate level and inflation rate have a relatively large impact on the cost of system leveling electricity, indicating that external factors are also key factors affecting the cost of system leveling electricity, and their effects need to be considered.
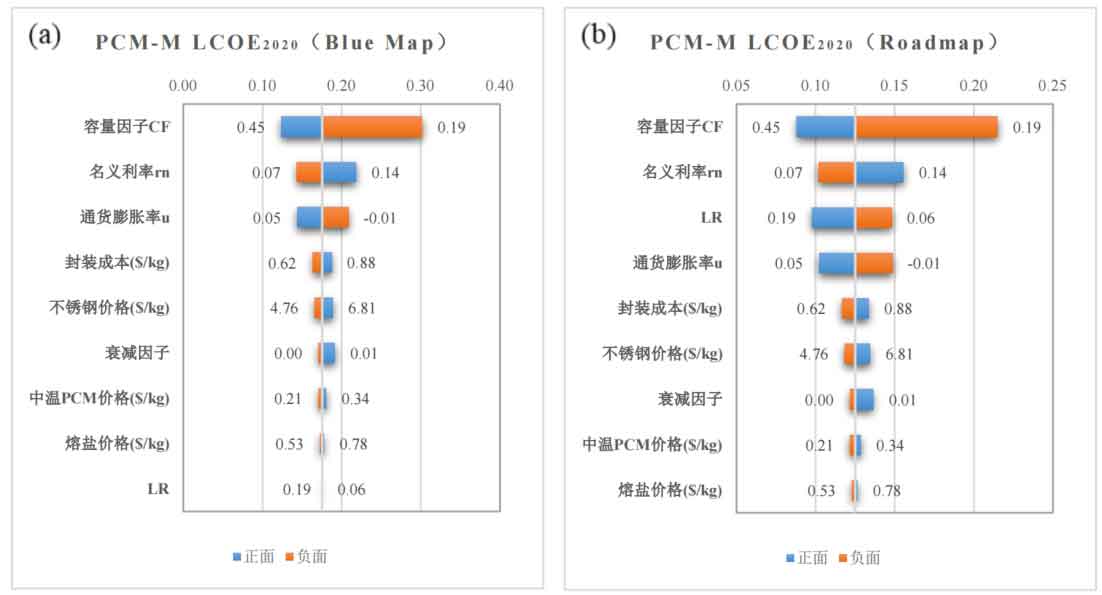
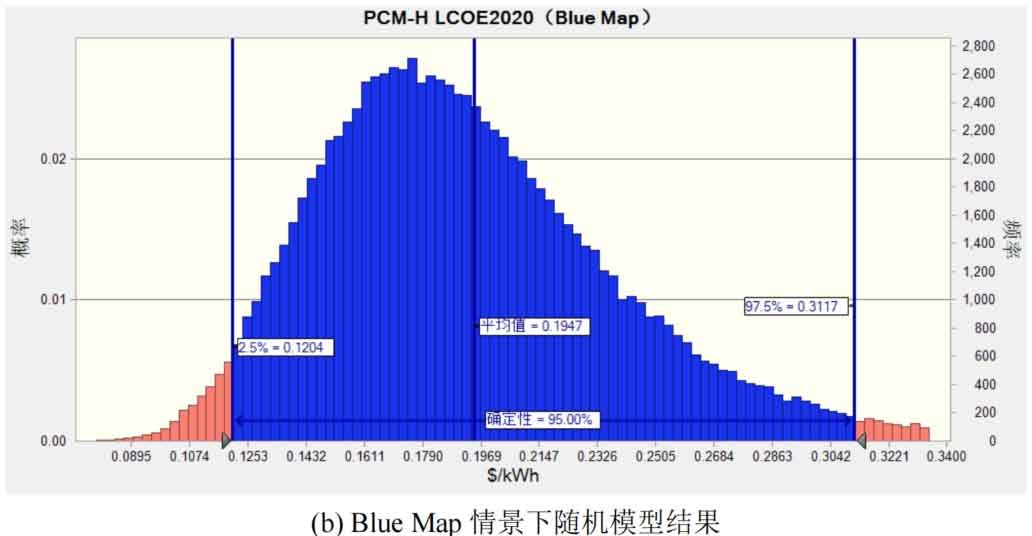
Figure 9 shows the stochastic model results of LCOE for high-temperature phase change energy storage systems. From the graph, it can be seen that in a single phase change energy storage system, the high-temperature phase change energy storage system has the highest levelized electricity cost. This is mainly because the price of high-temperature phase change materials is higher (compared to the price increase of medium and low-temperature phase change materials by several times), but the increase in energy storage is much smaller than the increase in material cost, which leads to a relatively high cost of levelized kilowatt hours. From Figure 9 (b), it can be seen that in the BlueMap scenario, the mean LCOE2020 of the high-temperature phase change energy storage system is 0.1947 $/kWh, which is higher than that of the medium and low-temperature phase change energy storage systems. The value of LCOE2020 is 95% distributed between 0.1204 and 0.3117 $/kWh. In Figure 9 (c), under the Roadmap scenario, the mean LCOE2020 of the high-temperature phase change energy storage system is 0.1378 $/kWh, and 95% of the LCOE2020 values are between 0.0808 and 0.2266 $/kWh. In both cases, the system’s levelized cost per kilowatt hour also exhibits a longer rightward trailing distribution.
Figure 10 shows the sensitivity analysis results of parameters affecting LCOE2020 in high-temperature phase change energy storage systems. From the hurricane chart, it can be seen that under the two development scenarios, capacity factor and nominal interest rate are still the most important factors affecting LCOE2020. In high-temperature phase change energy storage systems, due to the high price of phase change materials, their impact on the system’s levelized cost of electricity is relatively significant. The price of high-temperature phase change materials is positively correlated with the cost of system leveling. In the Blue Map scenario, when the price of high-temperature phase change materials increases from 1.95 $/kg to 2.42 $/kg, the value of system LCOE2020 increases from 0.1857 $/kWh to 0.2085 $/kWh. When the price drops to 1.39 $/kg, the value of system LCOE2020 decreases to 0.1590 $/kWh. In the Roadmap scenario, the range of LCOE2020 high-temperature phase change energy storage system with changes in phase change material prices is 0.1133-0.1485 $/kWh.
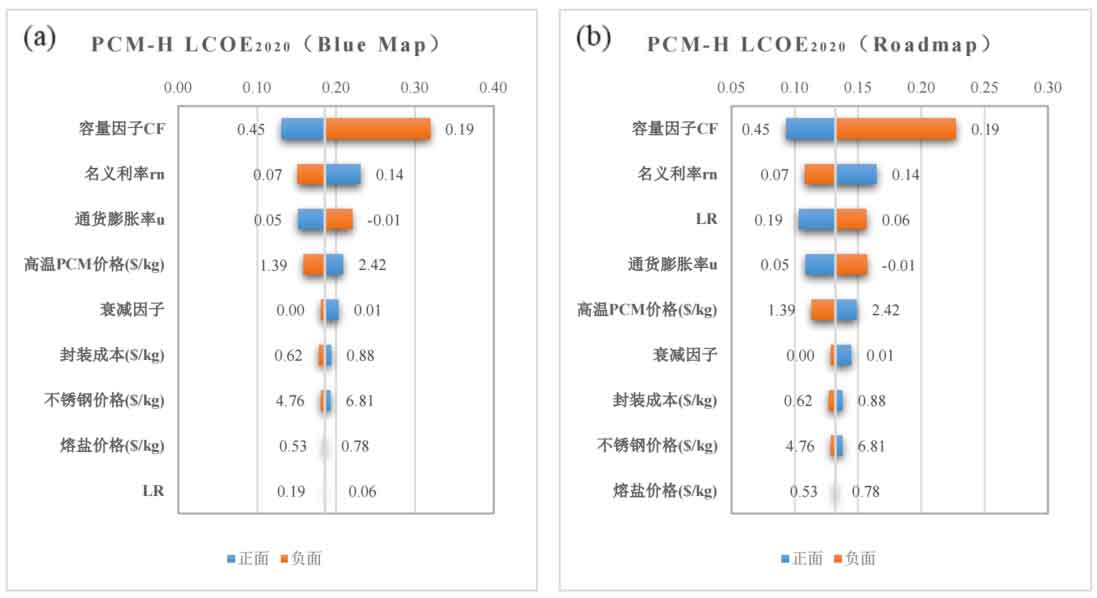
In high-temperature phase-change energy storage systems, the price changes of stainless steel and molten salt have a relatively small impact on the system’s levelized electricity cost. Due to economies of scale, in the Roadmap scenario, the influence of learning rate LR on the system’s levelized kilowatt hour cost becomes significant in high-temperature phase change energy storage systems. The learning rate is negatively correlated with the cost of system leveling electricity. When the learning rate LR varies within the range of 5.9% to 18.8%, the variation range of system LCOE2020 is 0.1034 $/kWh to 0.1566 $/kWh.
(4) Three layer phase change energy storage system
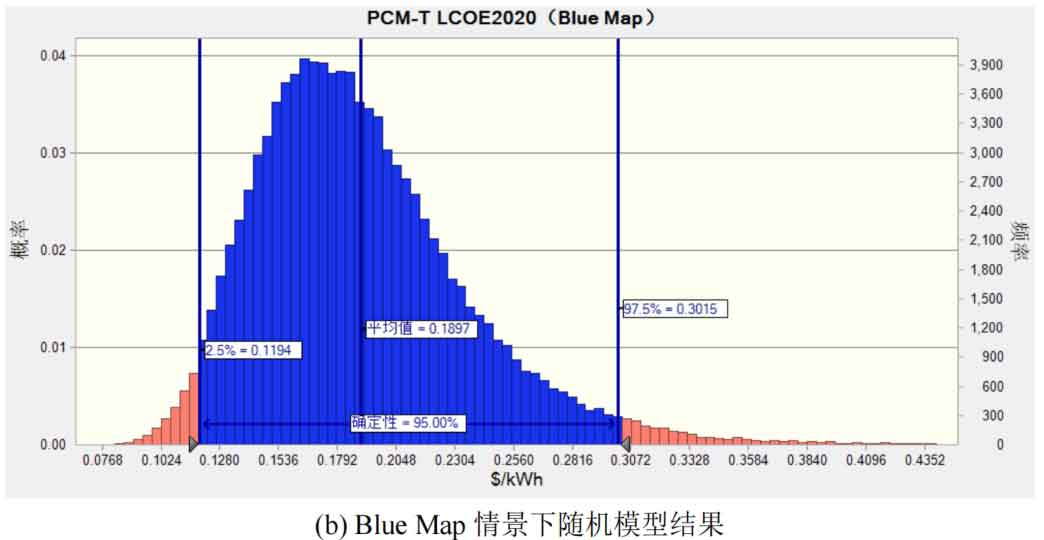
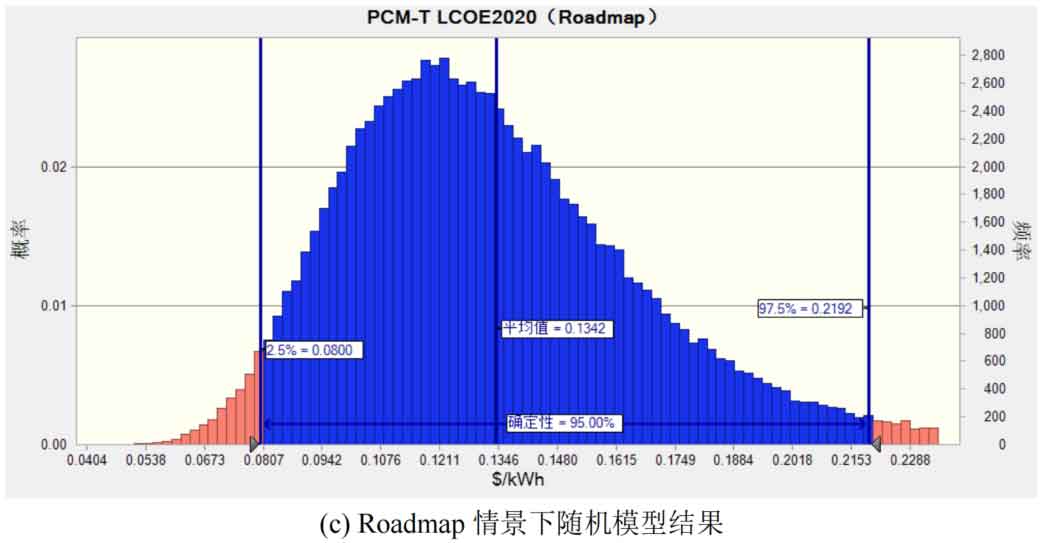
Figure 11 shows the random model results of a three-layer phase change energy storage system LCOE. From the graph, it can be seen that the levelized electricity cost of the three-layer phase change energy storage system is lower than that of the high-temperature phase change energy storage system. In Figure 11 (b), under the Blue Map scenario, the mean LCOE2020 of the three-layer phase-change energy storage system is 0.1897 $/kWh, and the distribution of LCOE2020 values is 95% between 0.1194 and 0.3015 $/kWh. On the right side of the graph, it can be observed that there may be larger values in the system. In Figure 11 (c), under the Roadmap scenario, the mean LCOE2020 of the three-layer phase change energy storage system is 0.1342 $/kWh, and the value distribution of LCOE2020 has 95% certainty to be between 0.0800 and 0.2192 $/kWh. In both cases, the distribution of system levelized electricity cost shifts to the right, exhibiting a longer rightward trailing distribution.
Figure 12 shows the sensitivity analysis results of parameters affecting LCOE2020 in a three-layer phase change energy storage system. From the hurricane chart, it can be seen that capacity factors and nominal interest rates are still the most important factors affecting LCOE2020. In a three-layer phase-change energy storage system, although the volume proportion of high-temperature phase-change materials decreases, their impact on the system’s levelized electricity cost is still relatively large compared to medium and low-temperature phase-change materials. In the Blue Map scenario, the capacity factor increased from 32% to 45%, and the three-layer phase change energy storage system LCOE2020 decreased from 0.1804 $/kWh to 0.1272 $/kWh. When the capacity factor decreases to 19%, the system LCOE2020 increases to 0.3099 $/kWh. In the Roadmap scenario, the capacity factor varies between 19% and 45%, and the variation range of the system LCOE2020 is 0.0906-0.2208 $/kWh, which is smaller than the size in the Blue Map scenario.
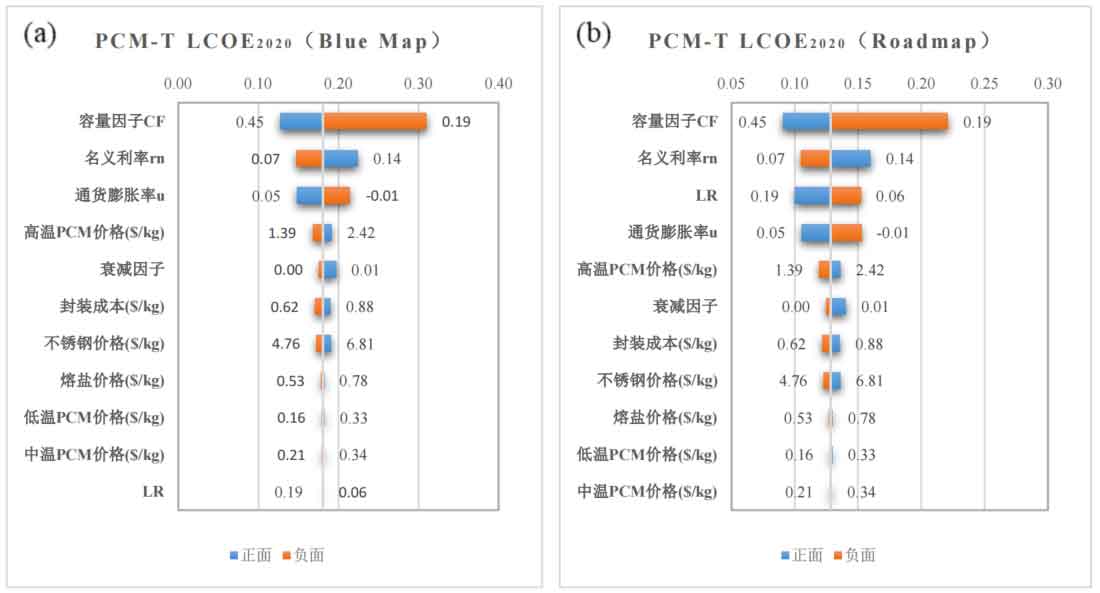
The inflation rate is also one of the external factors that has a significant impact on the cost of system leveling electricity, and it is negatively correlated with the cost of system leveling electricity. The inflation rate fluctuates within the range of -0.5% to 5%. The LCOE2020 system in the Blue Map scenario ranges from 0.1478 to 0.2141 $/kWh, while in the Roadmap scenario it ranges from 0.1053 to 0.1526 $/kWh. The prices of medium and low temperature phase change materials and molten salts have a relatively small impact on the cost of system leveling, while the impact of learning rate LR on the cost of system leveling is similar to the above situations.
(5) Sensible latent heat combined energy storage system
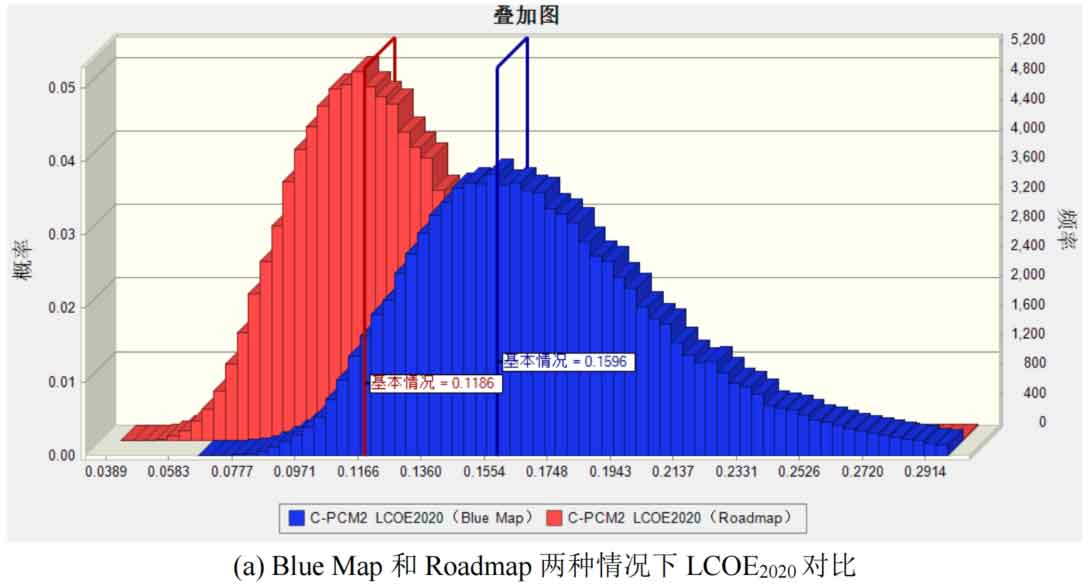
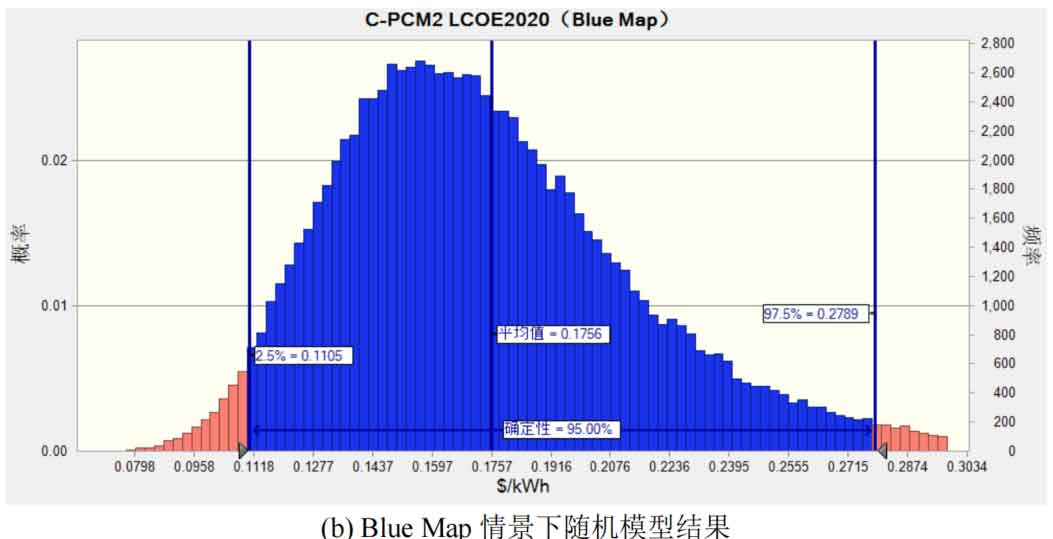
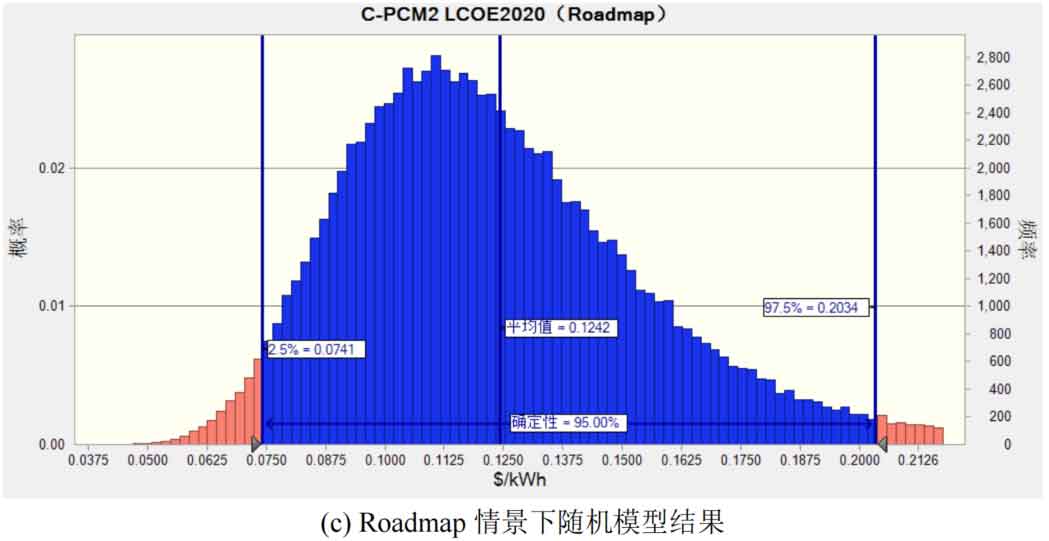
Figure 13 shows the random model results of the LCOE of the sensible latent heat combined energy storage system. From the graph, it can be seen that compared to a three-layer phase-change energy storage system, using concrete to replace some phase-change materials can reduce the system’s levelized electricity cost. In Figure 13 (b), under the Blue Map scenario, the mean LCOE2020 of the sensible latent heat combined energy storage system is 0.1756 $/kWh, and the distribution of LCOE2020 values in the range of 0.1105-0.2789 $/kWh has a 95% probability. In Figure 13 (c), under the Roadmap scenario, the mean LCOE2020 of the sensible latent heat combined energy storage system is 0.1242 $/kWh, and the value of LCOE2020 has 95% certainty to be between 0.0741 and 0.2034 $/kWh. The use of concrete as a partial replacement for phase change materials reduces material costs, but the energy storage per unit volume of the energy storage system also decreases. The combined effect of the two results in a reduction in the system’s levelized electricity cost, but the reduction is relatively small.
Figure 14 shows the sensitivity analysis results of LCOE2020 in a sensible latent heat combined energy storage system. From the hurricane chart, it can be seen that the most important factors affecting the LCOE2020 system are still the capacity factor and nominal interest rate. In the sensible latent heat energy storage system, due to the relatively small proportion of high-temperature phase change materials (25%), their impact on the system’s levelized electricity cost is smaller than the impact of stainless steel prices. In the sensible latent heat combined energy storage system, under the Blue Map scenario, the capacity factor increases from 32% to 45%, and the LCOE2020 system decreases from 0.1669 $/kWh to 0.1177 $/kWh.
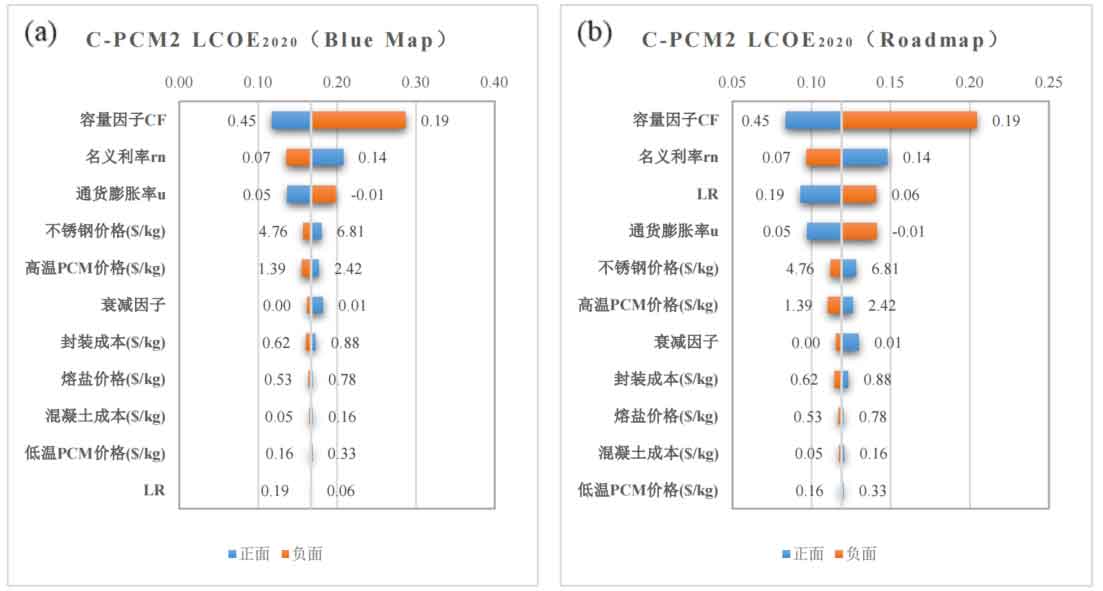
When the capacity factor decreases to 19%, the system LCOE2020 increases to 0.2868 $/kWh. In the Roadmap scenario, the capacity factor varies between 19% and 45%, and the variation range of the system LCOE2020 is 0.0839-0.2043 $/kWh, which is smaller than the size in the Blue Map scenario.
In the combination of sensible and latent heat energy storage system, the price of concrete and low-temperature phase change materials has a relatively small impact on the system’s levelized electricity cost, and the same applies to molten salts as heat transfer fluids. Therefore, in order to reduce the cost of system leveling electricity, emphasis should be placed on capacity factors and external economic factors (such as inflation rate and nominal interest rate). In different development scenarios, the impact of learning rate LR should be distinguished.
The distribution of LCOE in different energy storage systems can be represented using box plots, as shown in Figures 15 and 16. The box plot contains six statistical measures, namely minimum, lower quartile, median, mean, upper quartile, and maximum. The box plot can visually display the distribution and dispersion of data. The interquartile distance in a box plot is the distance between the 25th and 75th percentiles, represented by a box in the graph. The horizontal lines within the box represent the median, the mean is represented by black squares, and the upper and lower lines represent the maximum and minimum values of the system’s economic indicators.
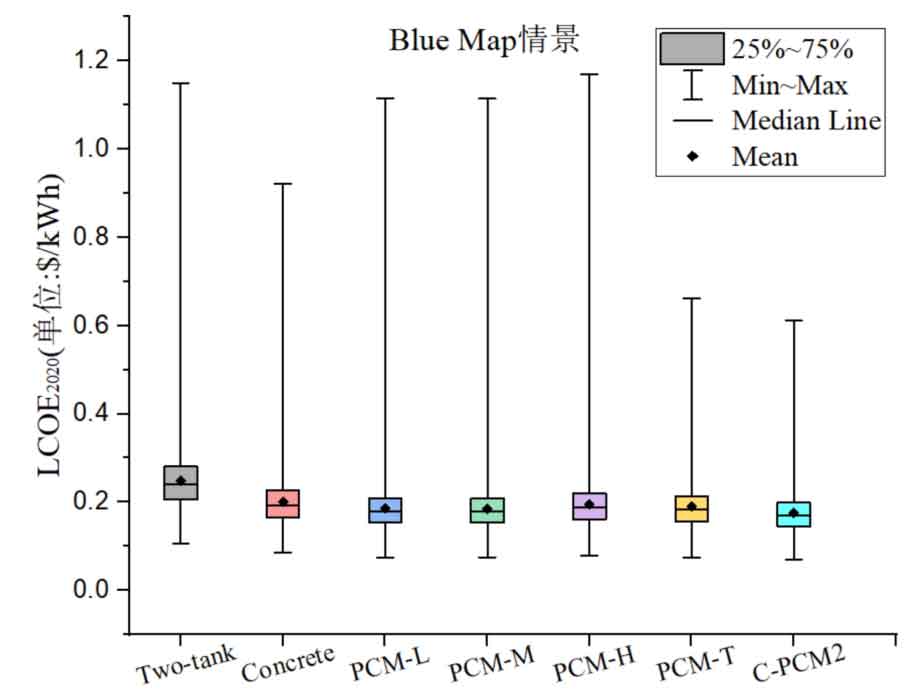
Figure 15 depicts a comparison of different energy storage systems LCOE2020 under the Blue Map scenario, and it is clear that each energy storage system has a right leaning “tail”. Especially for the PCM-H energy storage system, its levelized electricity cost has a relatively wide range of possible values, indicating a high level of uncertainty. The possible values of LCOE2020 for PCM-T energy storage system and C-X1 energy storage system are relatively small, and the uncertainty is also relatively small. Among all energy storage systems, the range of LCOE2020 values in the C-X1 energy storage system is the smallest, indicating that using concrete as a partial replacement for phase change materials can reduce the levelized cost and uncertainty of the system.
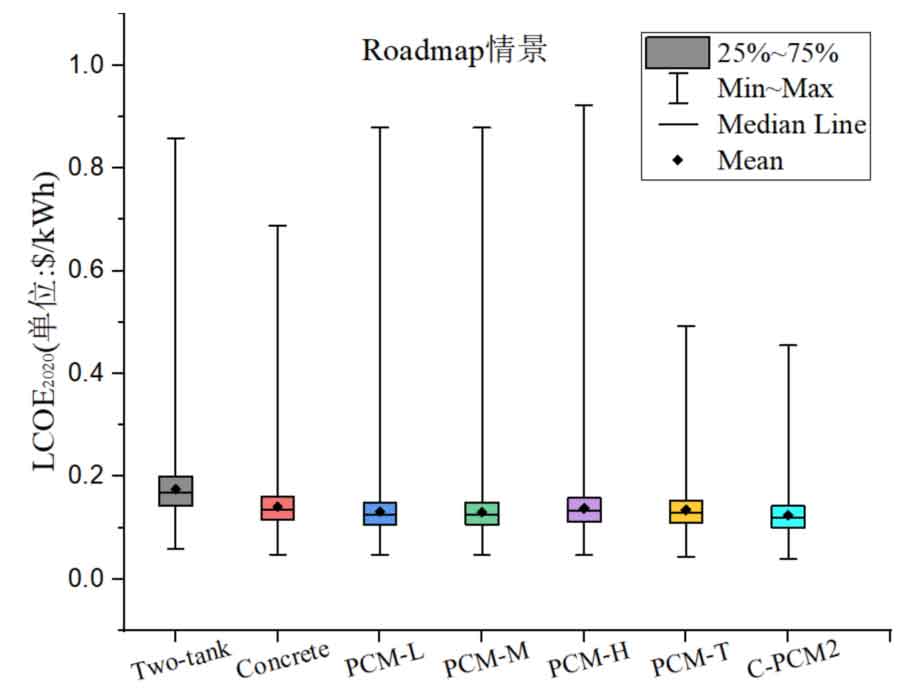
Figure 16 depicts a comparison of different energy storage systems LCOE2020 under the Roadmap scenario, and the results obtained are similar to Figure 15. Compared to the Blue Map scenario, the range of possible values for LCOE2020 in the Roadmap scenario becomes narrower, indicating a decrease in uncertainty. The C-X1 energy storage system still has the least uncertainty among all systems, and the average LCOE is much lower than that of the Two tank energy storage system, indicating that it is an ideal alternative to the traditional dual tank molten salt energy storage system.

