
1.Introduction
With the increasing scale of new energy generation, the impact of intermittency and volatility on the power grid is becoming increasingly prominent. In order to further enhance the penetration rate of new energy in the power grid, there is an urgent need to solve the problem of peak shaving and frequency regulation caused by large-scale grid connection of new energy. Among them, battery energy storage is one of the effective methods to solve this problem. The battery energy storage system has a fast and accurate power response ability, which can fully leverage the advantages of fast response and flexible regulation methods when used to assist in power grid frequency regulation. Its frequency regulation effect is far superior to traditional units.
The active participation of energy storage systems in the primary frequency regulation control of the power grid is an important research direction to improve the performance of the primary frequency regulation of the power grid. A reasonable control system architecture and frequency regulation control strategy can better play the role of energy storage in the primary frequency regulation of the power grid. To this end, the shortcomings of current battery energy storage participating in the primary frequency regulation strategy of the power grid were analyzed. A centralized energy storage primary frequency regulation control architecture and strategy were proposed, and specific strategy implementation methods and power instruction allocation methods were provided. Finally, the feasibility and implementation effect of the strategy were verified through experiments.
2 Analysis of Distributed Primary Frequency Modulation Control
2.1 Decentralized frequency modulation control strategy
A complete battery energy storage unit is generally composed of main components such as energy storage batteries, battery management systems (BMS), energy storage converters (PCS), transformers, etc. Due to the limitation of battery series voltage, the capacity of a single energy storage unit is limited, usually in the hundreds of kilowatts or megawatts level.
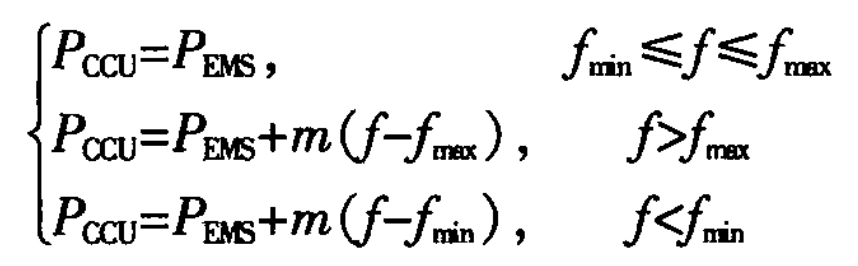
To form a large capacity energy storage system of tens or even hundreds of megawatts, multiple energy storage units need to be connected in parallel. Therefore, the primary frequency regulation control function of the large capacity battery energy storage system requires that when dozens of units are within the dead band range, the energy storage station operates in peak shaving mode, and the PCS operates in active reactive power command (P-Q) control mode, The active power command PACQ of each PCS comes from the Energy Management System (EMS). The active response of the system meets the following requirements:
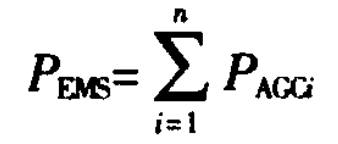
For each PCS, the current system frequency is calculated using its own AC outlet voltage, and the PCS charging power is defined as positive. The charging and discharging power of each PCS is:
In the equation, m is the slope of the sag curve.
Due to the fact that the commands of Automatic Generation Control (AGC) come from power grid scheduling and EMS, which are relatively random, PAGa may be charging, discharging, or zero within the frequency dead band. The PCS droop control curves under different operating states are shown in Figure 1, and curves 1-3 respectively show the PCS operating curves when the AGC command is charging, zero (no charging or discharging), and discharging.
2.2 Analysis of Circulation Caused by Power Command Differences
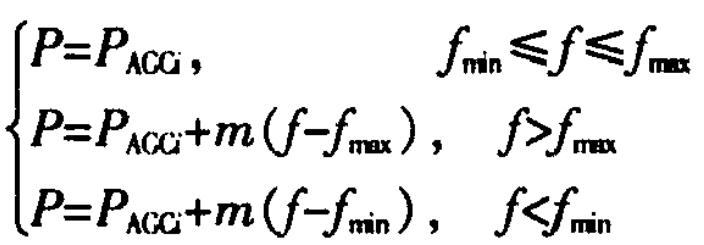
Due to the control requirement of balancing the State of Charge (SOC) between different energy storage battery units, the power of each PCS is not equal during peak shaving operation mode. Taking two of them as examples for analysis, the operating curves of the two PCS do not coincide, and the difference in the curves can cause one PCS to be in a charging state and the other PCS to be in a discharging state, forming a circulating current inside the energy storage system. As shown in Figure 2, taking the discharge state within the frequency dead band as an example, the AGC instructions of both PCSs are currently negative. At a certain moment corresponding to the dashed line in the figure, even if the system frequency calculated by the two PCSs has no error at all, if the AGC power instructions are different, the relationship with frequency is satisfied as follows:
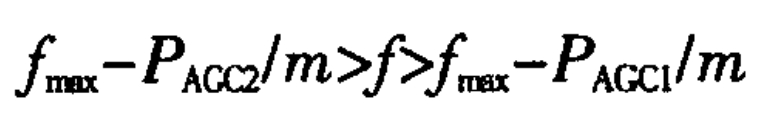
PCS1 runs at point 0 on the curve in the graph, while PCS2 runs at point 6. When P (a)>0, PCS1 is charged, and when P (6)<0, PCS2 is discharged, forming an internal power circulation in the energy storage system.
When using the same method to analyze the AGC command for charging, the PCS power command is positive, and the difference in command may also form internal circulation.
2.3 Analysis of Circulation Caused by Frequency Calculation Differences
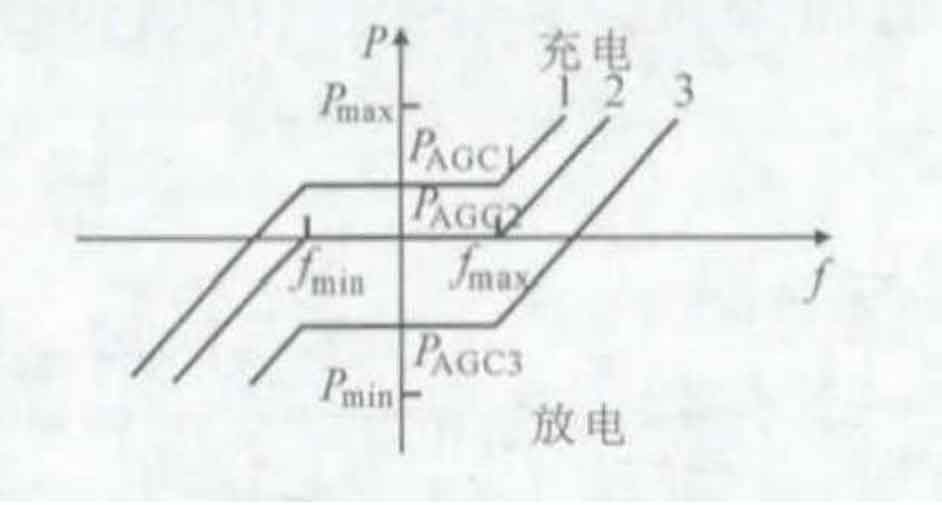
Even if PCS uses the same supplier’s products, there are still differences in sampling and calculation accuracy for each PCS, and there may be deviations in the frequency of calculation for different PCS.
As shown in Figure 3, taking the discharge state as an example, when the AGC command is the same, the operating curves of PCS1 and PCS2 coincide.
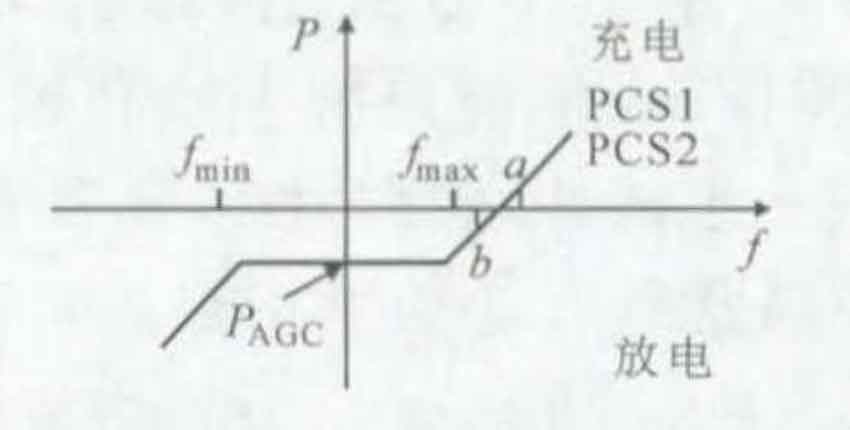
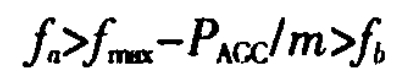
PCS1 runs at point a of the curve in the graph, while PCS2 runs at point 6. When P (a)>0, PCSl is in the charging state, and P (6)<0, PCS2 is in the discharging state. At this time, the energy storage system forms an internal power circulation.
Using the same method to analyze AGC command charging may also cause power circulation when the frequency exceeds the lower limit.
3. Centralized primary frequency control strategy
For the power grid, in the decentralized primary frequency control strategy, each PCS operates according to their respective power droop curve, which is actually equivalent to multiple frequency modulation power sources. The frequency calculation accuracy of each PCS is required to be high, and the consistency and controllability of frequency modulation performance are also poor. Based on the above analysis, some operating conditions are prone to internal circulation, and the overall frequency modulation effect is not ideal in actual operation.
3.1 Architecture and Strategy of Centralized Primary Frequency Control System
A centralized primary frequency regulation control scheme is proposed here, which is configured with a converter cluster controller for a large capacity battery energy storage system. The architecture of the centralized primary frequency regulation control system is shown in Figure 4.
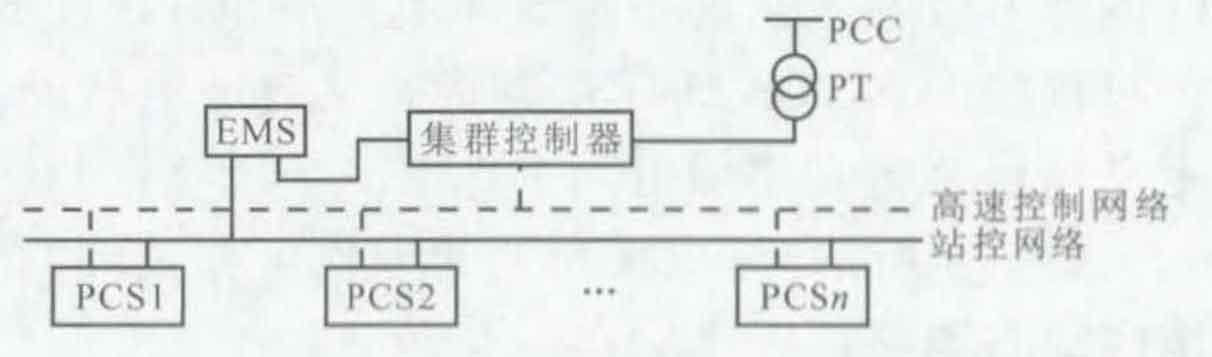
The cluster controller collects the voltage at the grid connection point of the energy storage system and calculates the system frequency and voltage. Connect to the station control layer network and communicate with EMS to obtain the system charging and discharging power command issued by EMS, which comes from power grid scheduling or local settings. The communication delay of the high-speed control network connected to the PCS cluster is milliseconds. At the same time, the PCS cluster is directly connected to the station control layer to achieve EMS monitoring of the PCS cluster. The high-speed control network only transmits a small amount of power command signals and energy storage unit status signals, ensuring small communication delays.
After using a cluster controller to centrally control the PCS cluster, all PCS charge and discharge control commands are uniformly issued by the cluster controller. The PCS always operates in P-Q control mode, without frequency calculation, and is used for droop control. The peak shaving and frequency modulation commands of the energy storage system are uniformly generated and distributed by the cluster controller. The total active power command of the cluster controller is:
In the formula, Pems is the total control command of the energy storage system issued by EMS to the cluster controller.
3.2 Power instruction allocation method for cluster controllers
By allocating power instructions to each PCS through the cluster controller, the PAGO meets the following requirements:
3.2.1 Power instruction allocation method
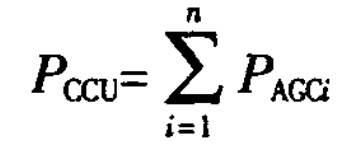
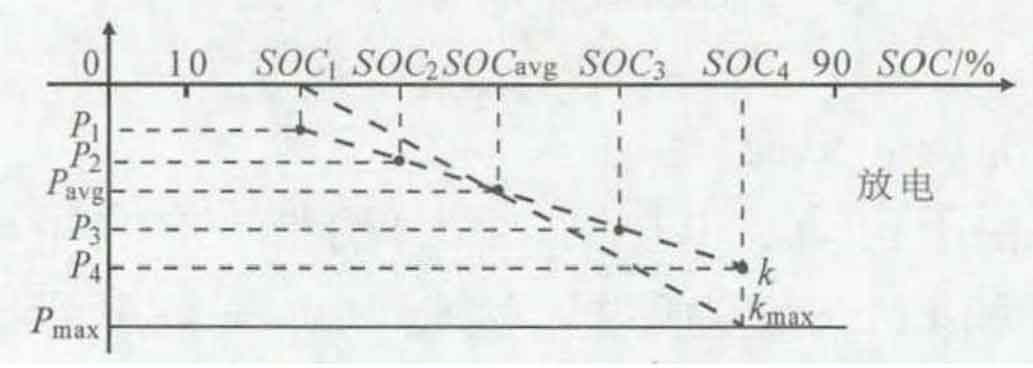
Due to the differences in the operating status of each energy storage unit during actual operation, and the failure of some battery clusters in the battery unit can lead to a decrease in the PCS power limit, it is necessary to consider the different states and power limits of the energy storage unit for real-time dynamic power allocation adjustment. Here, a power instruction allocation strategy based on S0C balance control is adopted, and the power instructions for each energy storage unit are:
In the formula, Pavg is the average power instruction of multiple PCSs that can participate in power allocation, and coefficient A represents the equalization speed of S0C. The larger the value of A, the faster the SOC equalization speed is. A value of zero represents power equalization.
3.2.2 Value range analysis
The value of K needs to consider the power limit of a single PCS, and there is no circulating current between multiple internal PCSs. It is not allowed for multiple PCSs to have both charging and discharging states at the same time. The power limit of a single PCS is defined as Pmaxi.
As shown in Figure 5, the value of charging state A can be dynamically adjusted within the range of equation (8):

As shown in Figure 6, the value of discharge state A can be dynamically adjusted within the range of equation (9):

3.3 Centralized Primary Frequency Control Process
Based on the above analysis, the centralized primary frequency control process is shown in Figure 7.
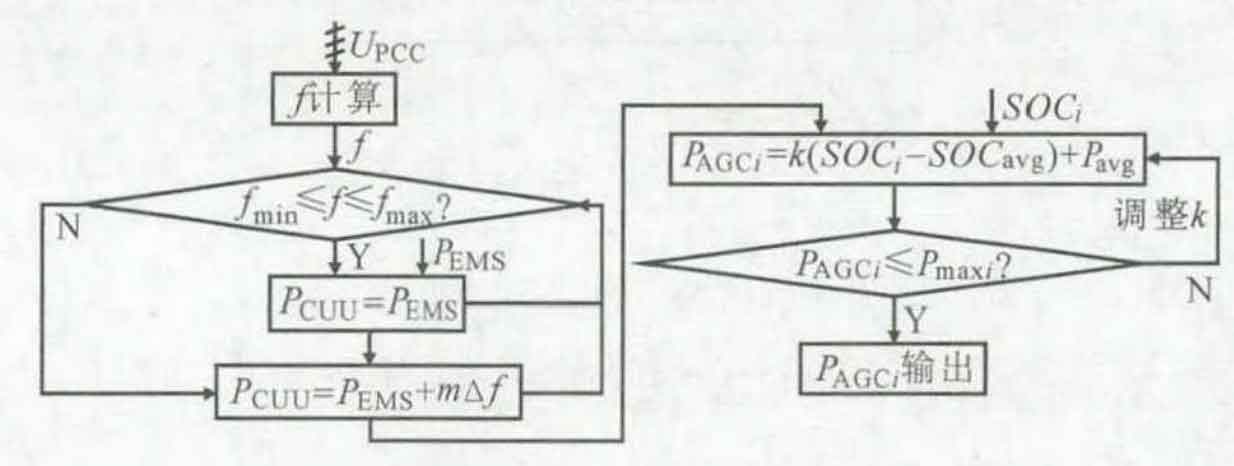
The cluster controller collects system voltage and calculates system frequency to determine whether the frequency is within the normal range. If it is within the normal range, the total power command of the cluster controller is the power command issued by the EMS. If the frequency exceeds the limit, a droop control command is added to the EMS command. Afterwards, the total instruction allocates power based on the S0C and power limit values of each energy storage unit. If a certain PCS power instruction exceeds the limit, the it value coefficient is adjusted in real-time, and the control instruction for each PCS is finally calculated. The instruction is transmitted in real-time to each PCS for execution through a high-speed control network.
4. Tests
To verify the centralized primary frequency modulation control strategy and power allocation method mentioned above, a simulation model is built on a semi physical RTDS platform. The PCS controller and cluster controller connected to the RTDS simulator are all controlled by practical engineering applications. Due to the limited number of RTDS interfaces, the experiment used 6 PCS connected to 1 cluster controller. The main circuit parameters are as follows: the total capacity of the energy storage system is 3MW/3MW, h, consisting of two 1.5MW energy storage units. Each 1.5MW unit is connected in parallel by three 500kWPCS AC sides and then boosted to 10kV through one booster transformer. The two booster transformers are connected to a 10kV interval by hand, The cluster controller collects the system voltage on the 10kV side. The experimental parameters are as follows: the frequency dead band is set to ± 0.02Hz, and any set of initial SOC values for PCS1-PCS6 energy storage subunits are 25%, 35%, 45%, 60%, 20%, and 55%, respectively. In equation (5), m=5. According to equation (9), Kmax=1.25 is calculated, and the initial distribution coefficient is taken as 1.25. The power limit of each PCS unit is set to 500kW.
4.1 Frequency limit exceeding test
The system frequency operates normally at 50Hz, and the cluster controller executes the instructions issued by EMS, set to -1.5MW. The energy storage operates normally in the discharge state of 1.5MW.
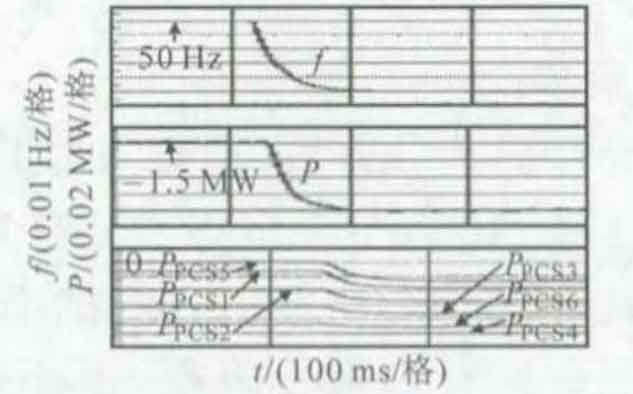
4.1.1 Frequency drop test
Simulate the system frequency decreasing from 50Hz to 49.8Hz on the RTDS platform. During the frequency decreasing process, when the frequency exceeds the set dead band and falls below 49.98Hz, the energy storage system gradually increases discharge according to the droop control strategy. The frequency decreasing test waveform is shown in Figure 8. Among them,/is the system frequency, P is the total power of the energy storage system, and Prcsp/W is the single machine power of six PCS. Due to the energy storage support effect, the discharge power was increased to around 1.9MW, and the frequency stabilized at 49.9Hz, which is consistent with the theoretical calculation of the sag curve.
4.1.2 Frequency rise test
The frequency of the simulation system increases from 50Hz to 50.2Hz. During the frequency increase process, when the frequency exceeds the set dead band and exceeds 50.02Hz, the energy storage system gradually reduces discharge according to the droop control strategy. The frequency increase test waveform is shown in Figure 9.
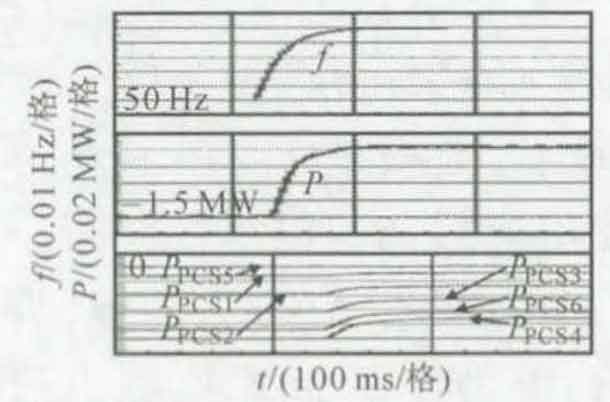
Due to energy storage support, the discharge power of energy storage is reduced to around 0.6MW, and the frequency is stable at 50.1Hz, which is consistent with theoretical calculations. It can be seen that no matter how the frequency changes, the six PCS always operate in P-Q control mode, and the active power values of each PCS operate according to the active power allocation instructions issued by the cluster controller. The consistency of power changes and the responsiveness of the six PCS are good.
4.2 Power distribution test
Table 1 lists the real-time power values of 6 PCS under different working conditions. The cluster controller allocates power commands for each PCS based on a pre-set power distribution coefficient of 1.25, and the command values for each PCS are the same as the actual power values.
| f=49.9Hz | f=50Hz | f=50.1Hz | |
| PCS∑ | -1.9 | -1.506 | -1.101 |
| PCS1 | -0.179 | -0.062 | -0.046 |
| PCS2 | -0.271 | -0.187 | -0.138 |
| PCS3 | -0.363 | -0.321 | -0.229 |
| PCS4 | -0.5 | -0.499 | -0.367 |
| PCS5 | -0.133 | 0 | 0 |
| PCS6 | -0.454 | -0.437 | -0.321 |
During normal operation at 50Hz, manually change the power limit of PCS4 from 500kW to 300kW, and the cluster controller will automatically adjust the distribution coefficient to 0.25.
| Before modifying the limit value | After modifying the limit value | |
| PCS∑ | -1.497 | -1.499 |
| PCS1 | -0.062 | -0.212 |
| PCS2 | -0.187 | -0.237 |
| PCS3 | -0.312 | -0.262 |
| PCS4 | -0.499 | -0.3 |
| PCS5 | 0 | -0.2 |
| PCS6 | -0.437 | -0.288 |
Table 2 lists the real-time power comparison of each PCS before and after the limit modification. It can be seen that PCS4 is limited within the limit, and excess power is allocated to other PCSs, while the total power is not affected.
5. Conclusion
For large-capacity battery energy storage systems, the possible circulation mechanisms of existing decentralized primary frequency control methods were analyzed. The proposed centralized primary frequency control strategy always operates in P-Q mode, with instructions uniformly and quickly distributed by the cluster controller. The steady-state peak shaving and primary frequency modulation smooth function transition were achieved, And it eliminates the possible circulation problem between PCS during decentralized primary frequency modulation. After adopting this strategy, the energy storage system exhibits the characteristics of a single frequency modulation power source for the power grid, with good controllability and consistency of power for each PCS. The proposed power instruction allocation method not only flexibly adjusts the balancing speed of S0C, but also adjusts the dynamic allocation coefficient in real-time according to the changes in the limit value of a single PCS, meeting the total power output requirements of the system while ensuring that the single power does not exceed the limit. The correctness of the above strategy and power allocation method has been verified through experiments based on a real-time digital simulation platform. The proposed control strategy and power allocation method have been implemented in engineering applications, providing reference for the design of large capacity battery energy storage systems and the application of primary frequency modulation control in the future.