
Abstract
This paper investigates the operational strategies and effectiveness of photovoltaic-energy storage system in detached residences under various electricity pricing models. By modeling the electricity consumption of sample buildings and PV system power generation, two operational strategies—regular operation mode and mixed operation mode—are developed for photovoltaic-energy storage system in the contexts of tiered electricity pricing and time-of-use electricity pricing. The economic indicators, net present value (NPV) and self-consumption rate (SC), are analyzed for energy storage unit prices ranging from 1000 to 2500 yuan/(kWh) as storage capacity increases. Results reveal that the larger the installed PV capacity, the higher the initial NPV value. In the regular operation mode, the self-consumption rate gradually increases with storage capacity, whereas in the mixed operation mode, it remains relatively constant. Optimal storage capacity considering only economic factors is found at the peak of the NPV curve, with different PV capacities leading to varying initial NPV values and rankings.
Introduction
Photovoltaic (PV) technology has emerged as a widely adopted renewable energy solution, demonstrating significant potential and promise. Initially serving large power plants and commercial buildings, PV systems are increasingly being utilized in residential electricity supply, driven by cost reductions and global incentives for renewable energy utilization. However, enhancing the consumption capacity of PV-generated electricity in detached residences remains a challenge. The integration of energy storage technology can effectively elevate self-consumption rates, expand the potential of PV power supply, and reduce grid pressure and transmission losses.
Recent advancements in energy storage technologies have led to cost reductions, fostering the deployment of flexible dispatch strategies through energy storage devices. Distributed photovoltaic-energy storage system, particularly suitable for detached residences, enable local PV array and storage device installations, offering higher safety due to their decentralized nature and potential economic benefits over the long term.
Electricity pricing models significantly influence photovoltaic-energy storage system operation strategies. Tiered, time-of-use, and dynamic pricing models prevail globally, each demanding tailored operational approaches. Understanding the interplay between storage capacity, operational modes, and pricing models is crucial for optimal system design and management.
1. Electricity and Energy Consumption System Modeling
To analyze the operational effects of photovoltaic-energy storage system under different pricing models, accurate modeling of detached residence electricity consumption and PV power generation is essential. This section outlines the modeling process and verifies its accuracy using measured data.
1.1 Power Balance in Sample Building’s Electrical System
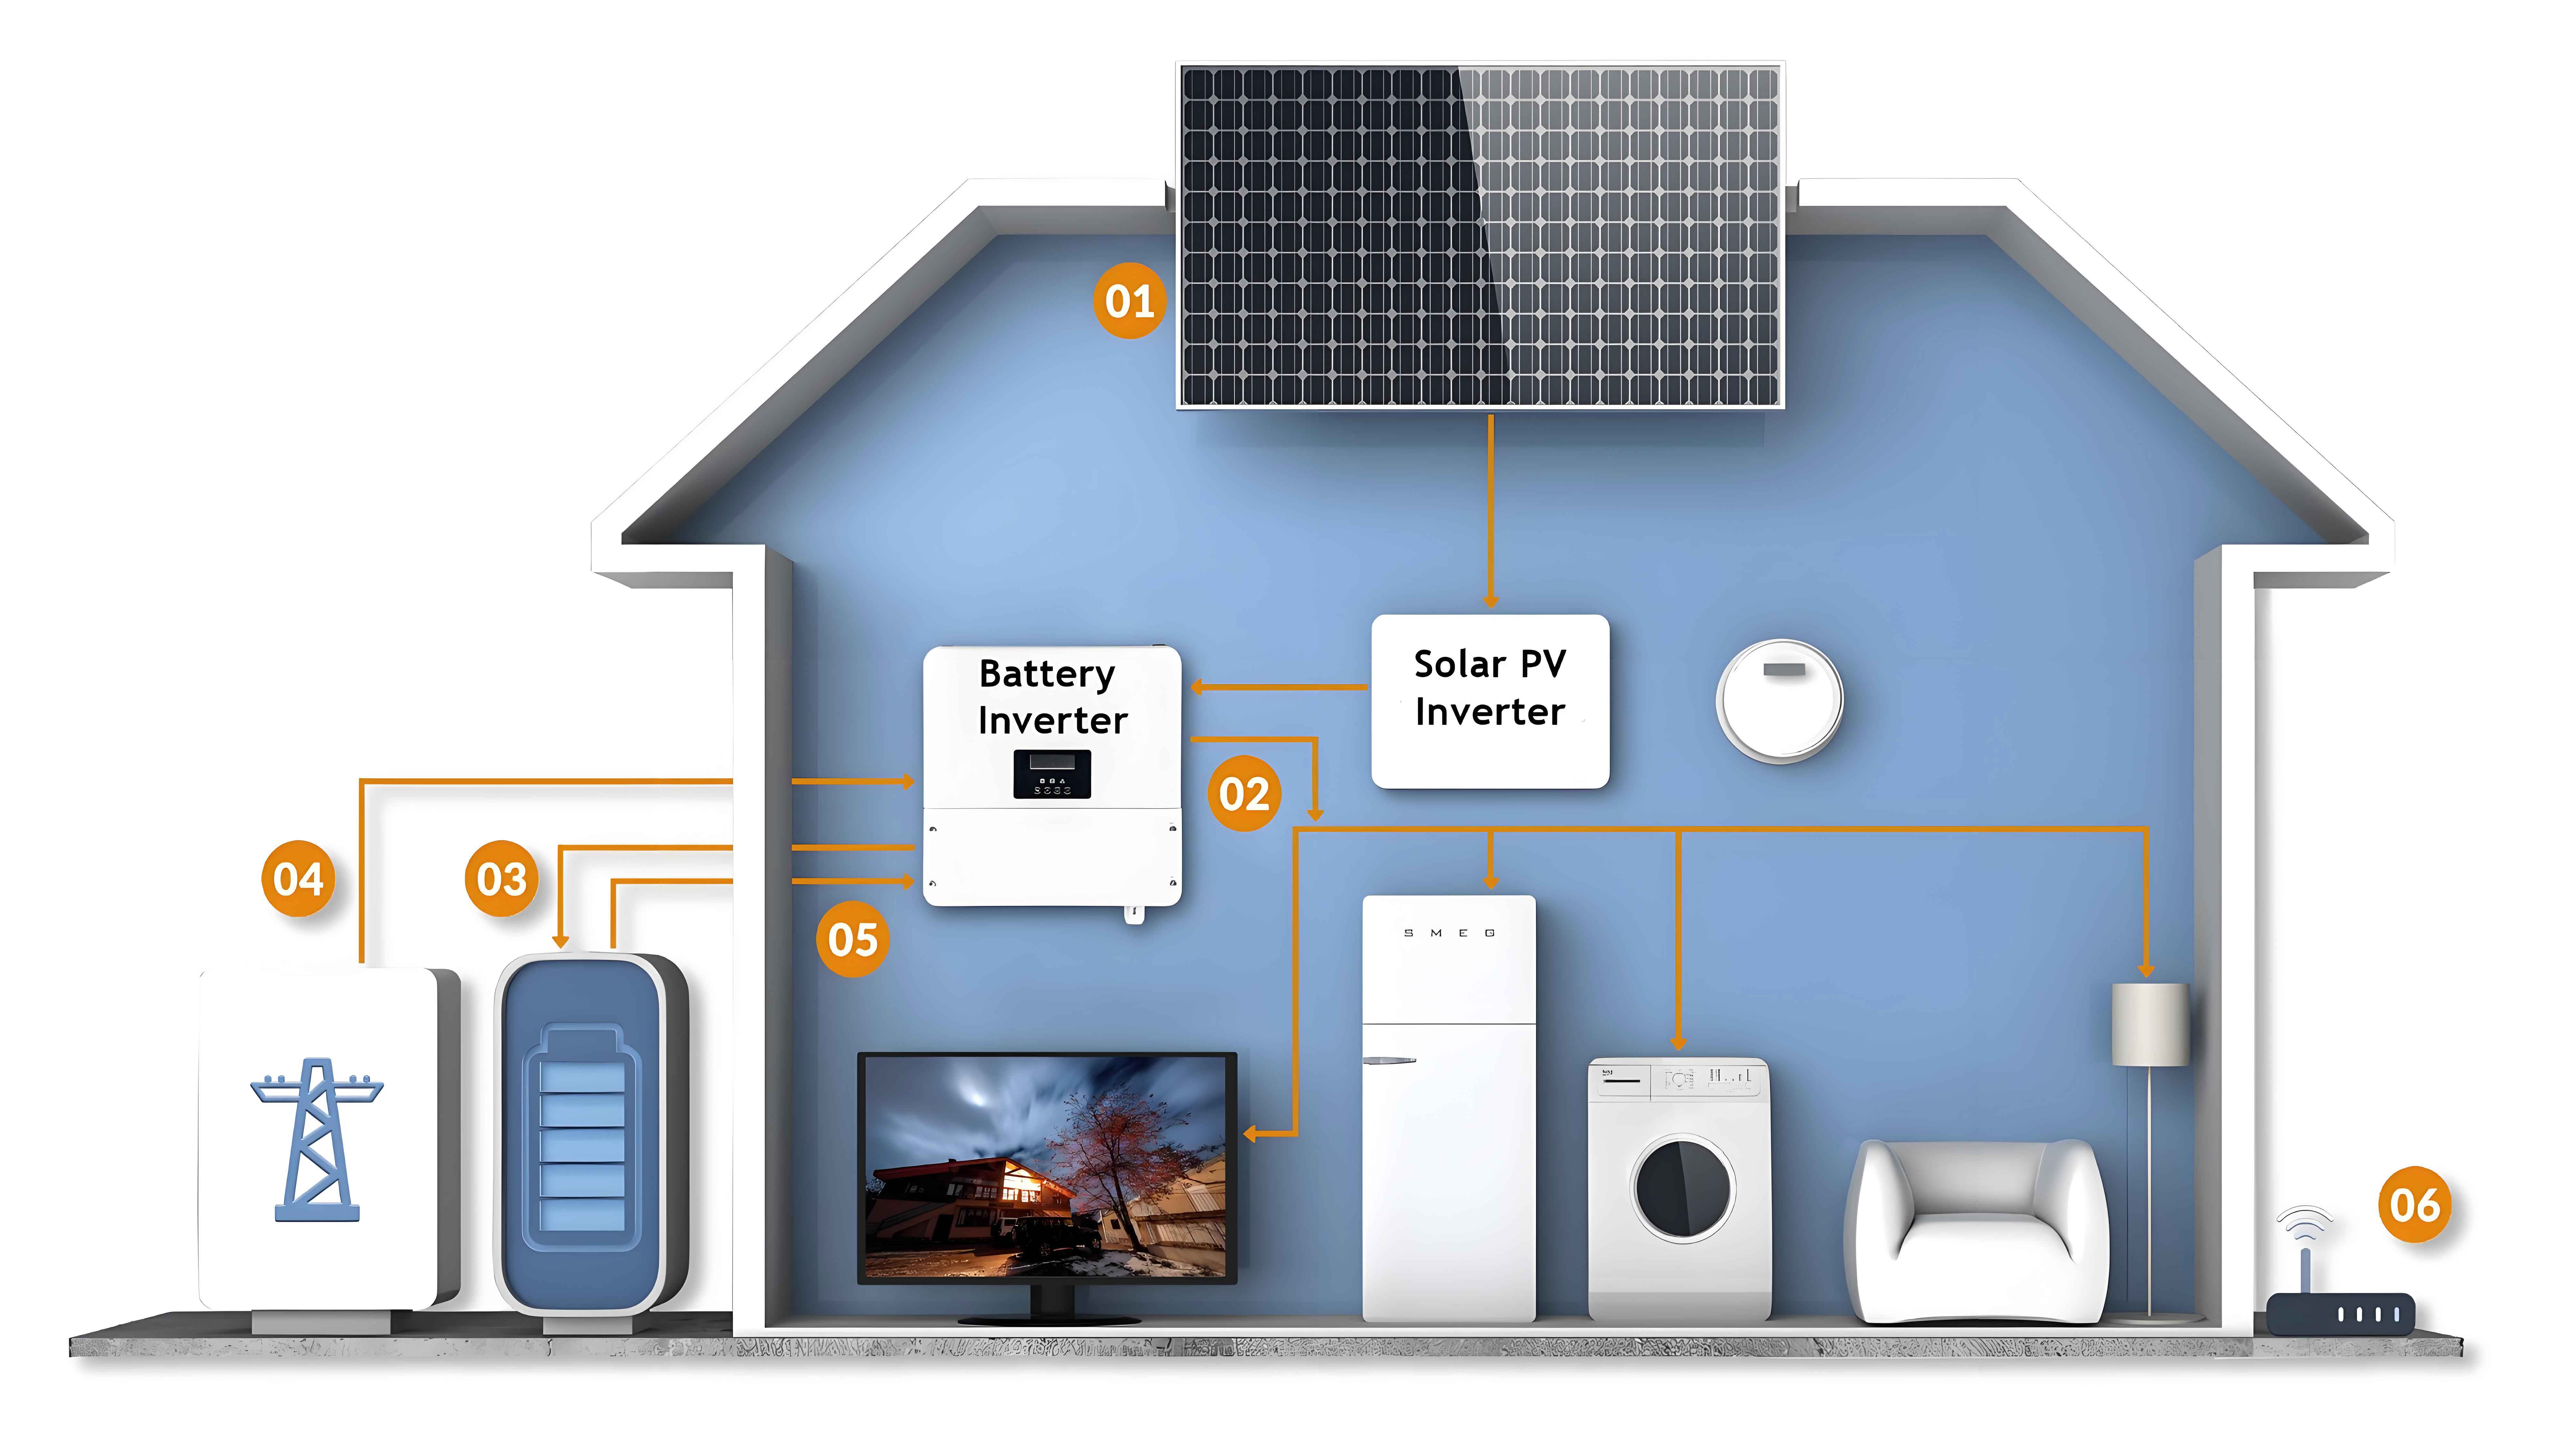
The integrated power supply and distribution system, including PV, energy storage, and grid connections. The power balance equations governing this system are:
PL=Ppv2L+Pb2L+Pgim(1)
Ppv=Ppv2L+Ppv2b+Pgex(2)
where:
- PL is the residential load demand,
- Ppv is the PV system’s total generation,
- Ppv2L is the power supplied to the load from the PV system,
- Pb2L is the power supplied to the load from the storage battery,
- Pgim is the power drawn from the grid,
- Ppv2b is the power fed into the storage battery from the PV system, and
- Pgex is the excess power exported to the grid.
Simultaneous grid import and export are prevented using the following controls:
Pgim≤zgPlimgim(3)
Pgex≤(1−zg)Plimgex(4)
where zg=1 when Pgim>0 and zg=0 when Pgex>0.
1.2 Energy Storage Battery Model
The battery model considers charging and discharging processes, represented by:
Et+Δt=Et+ξPES,chηchΔt−(1−ξ)ηdisPES,disΔt(5)
where:
- Et and Et+Δt are battery energies at times t and t+Δt,
- PES,ch and PES,dis are charging and discharging powers,
- ξ controls simultaneous charging and discharging,
- ηch and ηdis are charging and discharging efficiencies, and
- Δt is the time step.
Battery state-of-charge (SOC) and power constraints are:
SOCminXES≤Et≤SOCmaxXES(6)
0≤PES,ch≤Pmax,chand0≤PES,dis≤Pmax,dis(7)
where:
- SOCmin and SOCmax are minimum and maximum SOC limits,
- XES is battery capacity, and
- Pmax,ch and Pmax,dis are maximum charging and discharging powers.
1.3 Building Energy Consumption and PV Generation Simulation
A detached residence in Beijing, China, with a floor area of 380 m² and annual electricity consumption of approximately 15,000 kWh was modeled using TRNSYS. the simulated annual energy consumption. Validation against measured data confirmed an accuracy within 5%.
Different PV capacities (4-12 kWp) were simulated, yielding annual generations ranging from 4,372.47 to 13,117.41 kWh.
2. Electricity Pricing Mechanisms
2.1 Tiered Electricity Pricing
Based on Beijing’s residential tiered electricity pricing (Table 1), three tiers are defined with increasing prices.
| Tier | Monthly Consumption (kWh/household) | Price (CNY/kWh) |
|---|---|---|
| 1 | 1-240 | 0.4883 |
| 2 | 241-400 | 0.5383 |
| 3 | >400 | 0.7883 |
2.2 Time-of-Use (TOU) Electricity Pricing
TOU pricing, adapted from Gansu province’s policy (Table 2), divides the day into peak, off-peak, and flat periods.
| Time Period | Price (CNY/kWh) |
|---|---|
| 00:00-02:00 | 0.538 |
| 02:00-04:00 | 0.269 |
| 04:00-07:00 | 0.538 |
| 07:00-09:00 | 0.807 |
| 09:00-11:00 | 0.538 |
| 11:00-17:00 | 0.269 |
| 17:00-23:00 | 0.807 |
| 23:00-00:00 | 0.538 |
2.3 Feed-in Tariff for PV
Without subsidies, the feed-in tariff for PV-generated electricity is set at Beijing’s coal-fired power benchmark price of 0.3598 CNY/kWh.
3. Photovoltaic-Energy Storage System Operation Modes
3.1 Regular Operation Mode under Tiered Pricing
In this mode, excess PV power charges the battery; once full, excess power is exported. When PV power is insufficient, the battery supplies power, followed by the grid if necessary.
3.2 Mixed Operation Mode under TOU Pricing
During off-peak hours, the battery charges at maximum power, utilizing grid power if needed. During peak and flat hours, the system operates in regular mode.
4. Economic Indicators and Self-Consumption Rate Calculation
4.1 Photovoltaic-Energy Storage System Revenue
Revenue comprises self-consumed PV power savings (( R_{ER,y} )) and feed-in tariff income (( R_{EX,y} )):
Ry=RER,y+REX,y(8)
where:
RER,y=t=1∑8760(PL,t−Pgim,t)⋅Elr,t(9)
REX,y=t=1∑8760Pgex,t⋅Elw,t(10)
4.2 Net Present Value (NPV)
NPV considers investment costs (( I_{nv} )), operation and maintenance costs (( C_{o&m,y} )), and revenue over the system’s 25-year lifetime:
NPV=y=1∑25(1+dr)y(Ry−Co&m,y)−Inv(11)
where the discount rate (( dr )) is 2%.
4.3 Self-Consumption Rate (SC)
SC measures the instantaneous overlap between generation and load curves:
SC=∫t1t2P(t)dt∫t1t2M(t)dt(12)
where M(t)=min(L(t),P(t)+S(t)).
5. Results and Analysis
5.1 Regular Operation Mode
Self-Consumption Rate: Without storage, self-consumption decreases with increasing PV capacity. With storage, self-consumption increases with capacity, approaching 100% for high storage capacities.
Economics: NPV curves for different PV capacities and storage unit prices. Optimal storage capacity for economic benefit lies at NPV peaks. For unit prices below 1500 yuan/(kWh), installing storage becomes economically viable.
5.2 Mixed Operation Mode
Self-Consumption Rate: Initial self-consumption decreases with PV capacity but remains relatively constant with increasing storage capacity.
Economics: NPV curves show higher positive values compared to regular mode, with optimal storage capacities shifting rightward as unit prices decrease.
6. Conclusion
- In the regular operation mode, self-consumption increases with storage capacity, approaching 100% with sufficient capacity. In the mixed mode, self-consumption remains stable.
- Optimal storage capacity for economic benefit occurs at NPV peaks in both modes.
- NPV values are positively correlated with PV capacity. In the regular mode, NPV curves maintain their order with increasing storage. In the mixed mode, the order reverses at higher storage capacities.