
At present, research on the performance and control strategies of different types of energy storage battery energy storage systems is relatively focused both domestically and internationally, actively focusing on the research of new types of energy storage batteries. At the same time, various active control systems for microgrid energy storage systems have been proposed, which achieve optimal control of energy storage battery charging and discharging based on battery capacity and charging and discharging frequency limits, and can optimize the charging and discharging curve of energy storage batteries. On the basis of improving the performance of energy storage batteries, it also helps to effectively improve the quality of grid connected electricity. This is a comparative analysis of the performance of lead-carbon batteries and lead-acid battery microgrid integrated energy storage systems, in order to achieve the selection of batteries and propose corresponding control strategies.
1.Performance comparison of different types of energy storage batteries
This study focuses on lead-acid batteries and lead-carbon batteries as research objects. As one of the new types of batteries, lead-carbon batteries are a composite electrode made of carbon materials with double-layer capacitance characteristics and sponge shaped lead combined to form the negative electrode. Lead dioxide is used as the positive electrode material. Lead carbon batteries combine the characteristics of lead-acid batteries and supercapacitors, enabling effective suppression of negative plate sulfation during battery discharge and early hydrogen evolution during charging. Compared with lead-acid batteries, lead carbon batteries significantly improve cycle life and rated charge discharge rate, and also help reduce battery costs. However, in order for lead-carbon batteries to have a long cycle life, it is not possible to implement too large a discharge depth, which has certain limitations on the maximum charging and discharging power of lead-carbon batteries and also affects their widespread application.
1.1 Indicator Selection
This study focuses on lead-carbon batteries and lead-acid batteries, as both can meet the requirements for microgrid stability. Therefore, the focus of this study is to analyze the microgrid economy of energy storage systems. Because the available capacity of the two batteries is relatively close, their type has little impact on the revenue of the microgrid, but it will have a significant impact on the configuration cost and replacement frequency of the batteries. Therefore, in this analysis, the total cost of batteries within the full life of the microgrid is set at 15 years to explore the performance of the two types of batteries.
1.2 Calculation of battery life expectancy
The battery cycle life (N) B is directly affected by the depth of discharge (DOD) during battery use, and usually the deeper the discharge, the shorter the battery cycle life. The correlation between the cycle life and discharge depth of the two types of batteries in this study is represented as follows.
The expression for lead carbon batteries is as follows:

The expression for lead-acid batteries is as follows:

Assuming the discharge depth of the i-th cycle of the battery is DODi, the equivalent number of cycles Neq for each charge and discharge during battery operation is expressed as follows:

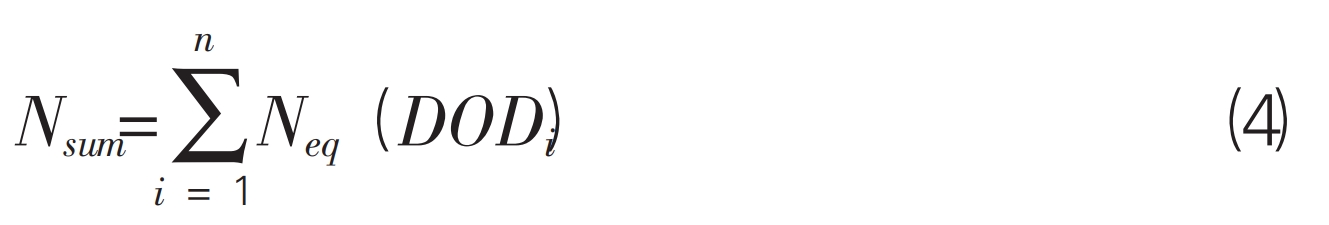
During the entire operation cycle of the project, the equivalent number of battery cycles Nsum is specifically expressed as follows:
If it is in the case of Nsum=N (BI), that is, the service life of this battery pack has ended and needs to be replaced. The DOD of the battery in each cycle can be extracted from the SOC change curve of the battery during the time change process using the rain flow counting method. The relevant process in actual operation is as follows:
Firstly, rotate the SOC time change curve clockwise by 90 ° to ensure that the time axis is in a vertical downward direction. The relevant data is like rainwater dripping from the roof, starting from the starting point and at various eaves (peak points) thereafter.
Secondly, the rainwater flow should be dripped vertically from the eaves until a peak greater than the peak appears, which can then end. Once a situation of rain flow from the eaves above is detected, the rain flow will stop and form a cycle during this process.
Thirdly, draw the cycle period based on the starting and ending points of the rain flow, and record the peak and valley values of each cycle in detail. The discharge depth during the cycle is the horizontal length of each rain flow.
So, for the performance analysis of each battery, in order to extract DOD, it is necessary to first obtain the SOC curve in time variation. The calculation method for SOC during battery charging and discharging can be expressed as follows:
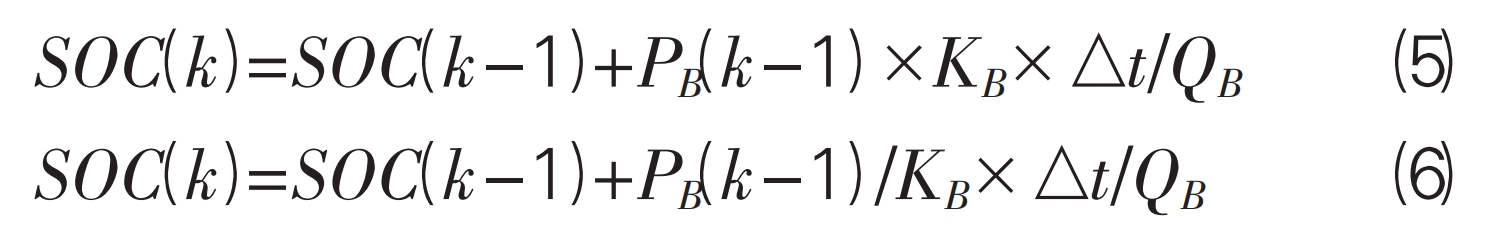
In formulas (5) and (6), SOC (k) represents the current sampling time SOC, and SOC (k-1) represents the previous sampling time SOC; KB represents the charging/discharging efficiency of the battery; P (B k-1) represents the battery output power at the previous sampling time; QB represents the battery capacity; △ t represents the sampling time interval.
1.3 Performance Comparison Results
For the study on the equivalent cycle times of two types of batteries within a year, the annual meteorological data of a certain company’s microgrid was used as data, and the annual SOC curve of the batteries was analyzed using Meteonorm software. Assuming that the usage of two types of batteries is consistent every year, the calculation method for the expected service life of the battery is N (B) I/equivalent number of battery cycles per year. This method can be used to determine the number of battery replacements within 15 years. In this calculation mode, the results obtained are shown in Table 1.
| Category | Expected battery life (years) | Number of battery replacements (times) | Cost of battery body throughout its entire life cycle (10000 yuan) | PCS equipment cost (10000 yuan) | Total Life Cycle Cost (10000 yuan) |
| Lead acid battery | 4.26 | 3 | 6200 | 80 | 6280 |
| Lead carbon battery | 5.71 | 2 | 4500 | 80 | 4580 |
Through the above analysis, it is found that the service life of the two types of batteries is continuously increasing, and the number of replacement times is gradually decreasing. In the comparison of the cost of two types of batteries, the total cost of lead-carbon batteries is significantly lower than that of lead-acid batteries. Therefore, in the comparison of the two groups, lead-carbon batteries have become the optimal choice for comprehensive energy storage systems in microgrids.
2.Charging and discharging control of microgrid energy storage system
Regarding the charging and discharging control of microgrid energy storage systems, it is necessary to monitor the charging and discharging status of each energy storage unit in the system, in order to reasonably reduce battery overcharging or discharging, improve the working efficiency of the energy storage system, and further extend the battery service life. In this control research process, estimation and analysis were conducted on the real-time SOC of lead-carbon batteries and supercapacitors in hybrid energy storage units based on the energy margin of each energy storage unit, in order to reasonably arrange successful discharge tasks.
2.1 When PHESS<0
In this case, if the DOD value of the i-th battery in the hybrid energy storage module can meet the condition of DODi ≥ DODmax, it means that the corresponding battery cannot continue to discharge. The flow power on both converters can be expressed as:

If the DOD value of the jth battery in the hybrid energy storage module can meet the condition of DO Di<DODmax, that is, the corresponding battery unit can continue to discharge, and the corresponding discharge power can be expressed as follows:
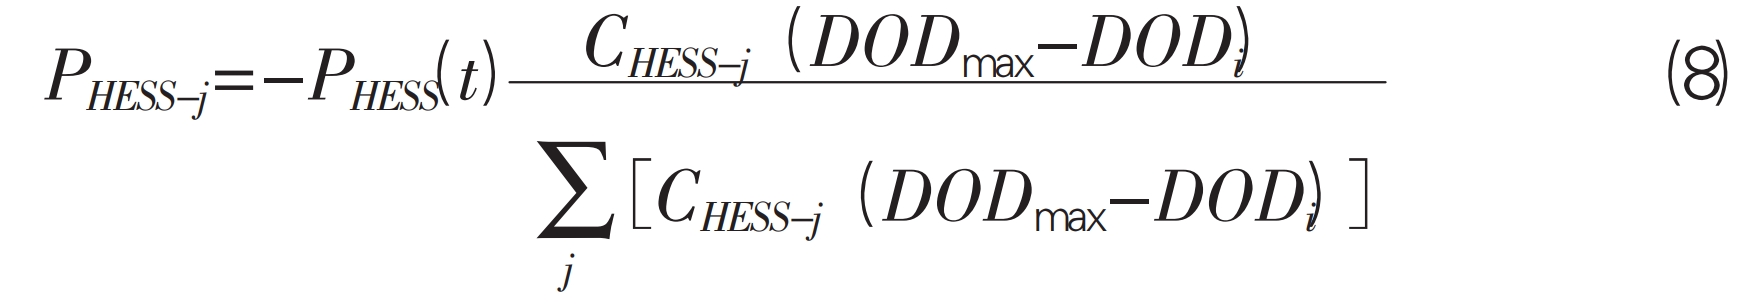
In formula (8), CHESS-j represents the basic capacity of the jth energy storage unit, and CHESS-j (DODmax DOD) i represents the remaining capacity of the jth energy storage unit.
2.2 When PHESS>0
In this case, if the SOC value of the i-th battery in the hybrid energy storage module can meet the condition of SOCi>SOCmax, it means that the corresponding battery cannot continue to discharge. The flow power on both converters can be expressed as follows:

If the DOD value of the jth battery in the hybrid energy storage module can meet the condition of SO Ci<SOCmax, that is, the corresponding battery unit can continue to discharge, and the corresponding discharge power can be expressed as follows:
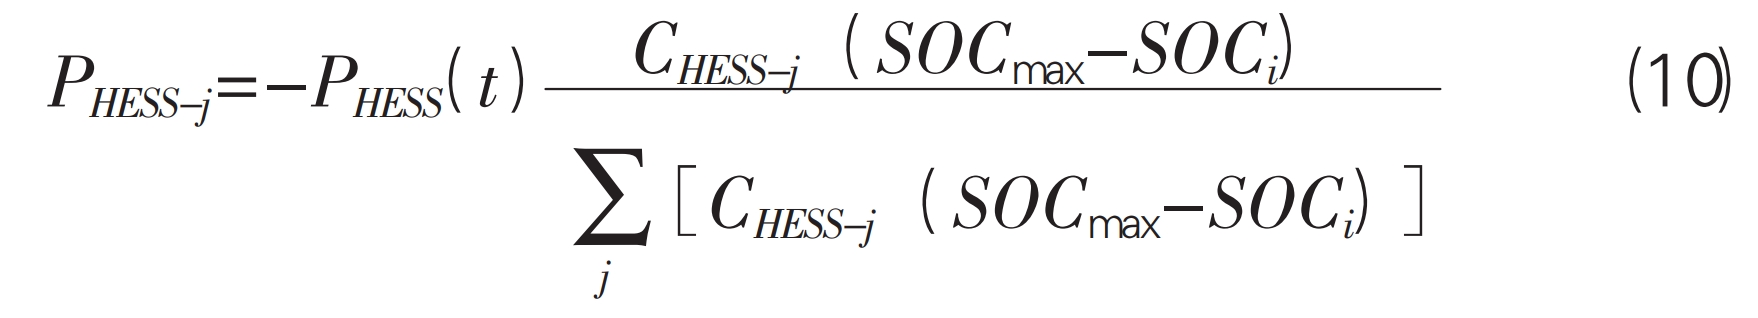
In formula (10), CHESS-j represents the basic capacity of the jth energy storage unit, and CHESS-j (SOCmax SOC) i represents the remaining capacity of the jth energy storage unit.
3.Experimental analysis
To analyze the rationality of the above control scheme application and apply it in the microgrid, a fluctuation frequency similar to the grid connection time of the microgrid is provided, with a time constant of 2400 seconds. Based on the MATLAB platform, the original wind and photovoltaic output data is called and imported, ensuring that the total configured capacity of the energy storage system is within 10% of the distributed resources, with a specific value of 7 MW and a rated capacity of 500 kW for a single module, So in this experiment, parallel use of 10 hybrid energy storage units was achieved. During the experimental process, it is necessary to implement smoothing treatment for randomly generated wind and light uncertainty power situations. At the same time, analysis found that HESS has significant advantages in smoothing raw power fluctuations compared to supercapacitors, mainly due to significant improvements in HESS energy density and a single energy storage method, which can ensure that the final output power waveform meets the system scheduling requirements. Among them, the charging and discharging power waveforms of supercapacitors and lead-carbon batteries in the hybrid energy storage system were separately compared and analyzed. The distribution details of the charging and discharging curves of the two are shown in Figure 1 and Figure 2.
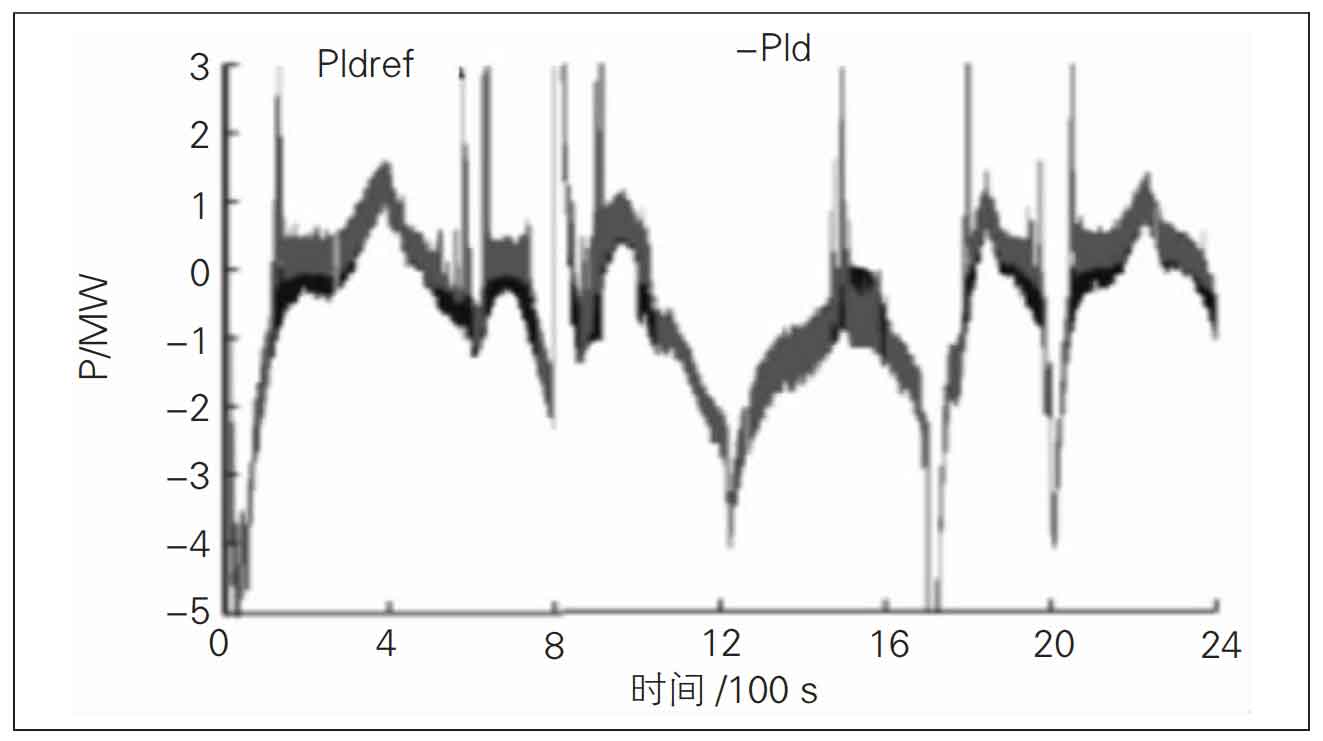
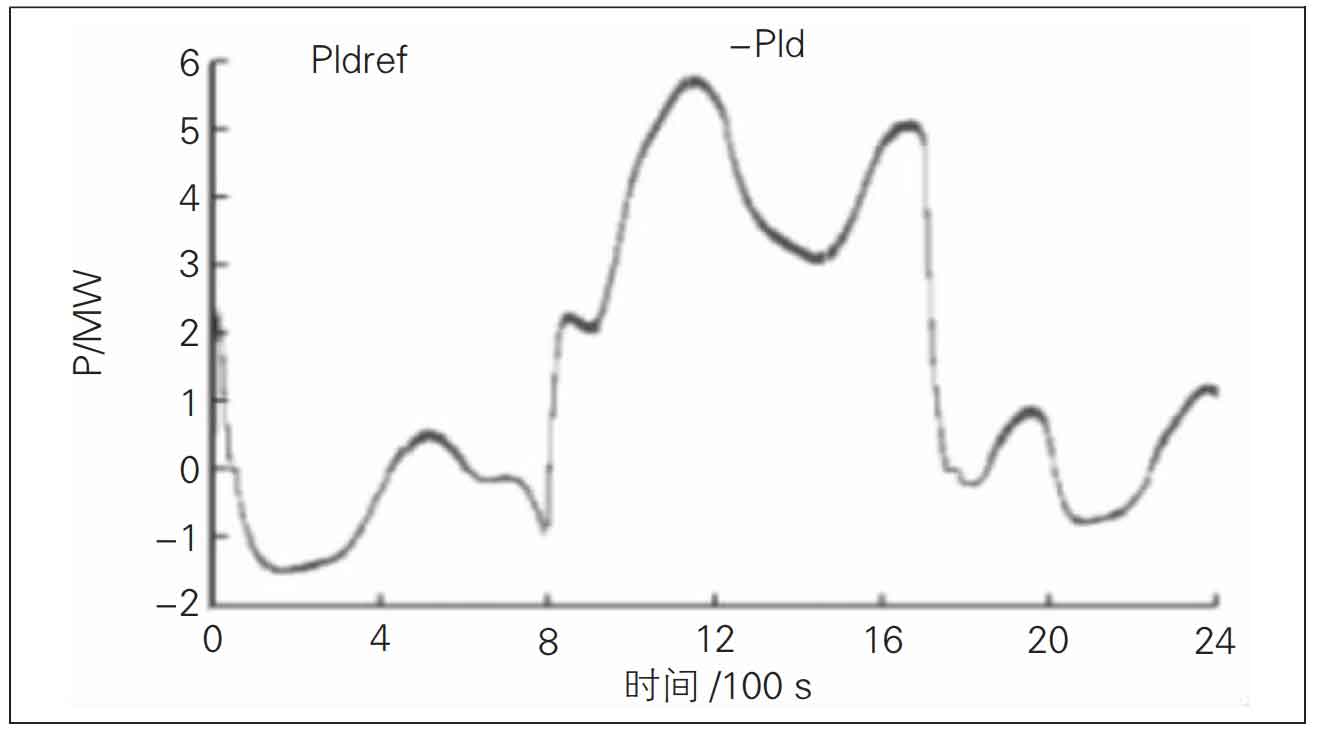
Figure 1 shows that the charging and discharging capacity of supercapacitors is relatively high and frequent at various time points, while Figure 2 shows that lead-carbon batteries have relatively low charging and discharging capacity and low frequency at various time points. For the cause analysis, the second-order filtering principle is adopted in this study. The first order is the application of smoothing the high-frequency fluctuation component of the original output power of the supercapacitor and the required fast response battery power response delay of the system. The second order lead carbon battery can achieve further smoothing. In this process, on the basis of fully utilizing supercapacitors and ensuring the normal operation of lead-carbon batteries, the relief of excessive charging and discharging pressure can be achieved, which can further improve the efficiency and operating time of lead-carbon batteries.
4.Conclusion
In summary, the following conclusions can be drawn through research: firstly, in this study, the performance analysis of lead-acid batteries and lead-carbon batteries was conducted. Lead carbon batteries themselves are based on lead-acid batteries, so the total cost of operation within 15 years was selected for analysis. The results showed that the total cost of operation of lead-carbon batteries is significantly lower than that of lead-acid batteries, indicating that lead-carbon batteries are more optional compared to lead-acid batteries. Secondly, through the research on the charging and discharging control of microgrid energy storage systems and the analysis of their application effects, it was found that the application of this control scheme in microgrids can not only ensure the normal operation of lead-carbon batteries, but also alleviate the pressure of overcharging and discharging, and optimize the efficiency and operating time of lead-carbon batteries.
In the current development of microgrid energy storage systems, in order to meet the energy-saving and environmental protection needs of the current social environment, there has been the emergence of optical storage microgrids, mainly using distributed power sources such as photovoltaics. Compared with traditional large grid power supply methods, this method can better meet the high safety and reliability needs of users, and provide personalized power supply services for different users. The “photovoltaic power generation+energy storage system microgrid” has become an important way to implement China’s energy sustainable development strategy, with great development potential. Therefore, in future development, it is necessary to increase research on the “photovoltaic power generation+energy storage system microgrid” to promote its development and achieve China’s energy sustainable development strategy.