
China has become the country with the largest installed capacity of wind and photovoltaic power in the world, and issues such as wind and solar power curtailment are becoming increasingly prominent. In order to improve the ability of the power grid to accept new energy, on the basis of fully utilizing the peak shaving capacity of conventional hydropower and thermal power units, a large number of power technology workers have conducted extensive research on peak shaving power sources such as pumped storage and electrochemical energy storage. Studied the impact of the operation mode of pumped storage power stations on reducing abandoned wind power. A study was conducted on the benefits of developing photothermal power in Xinjiang power grid, and the capacity and electricity benefits of photothermal power stations in Xinjiang power grid, as well as their national economic benefits, were analyzed. Establish a mixed integer programming model for coordinated operation of wind power and pumped storage with the objective of minimizing wind curtailment. A unit combination model for wind storage combined operation based on cost-benefit analysis was proposed. Researched the coordinated operation and economic feasibility of new energy and various energy storage sources in Qinghai’s high proportion new energy power system. A full lifecycle benefit evaluation was conducted on electrochemical energy storage in Shaanxi power grid. Analyzed the impact of energy storage power stations on purchasing characteristics. By utilizing the fast response characteristics and bidirectional power regulation ability of electrochemical energy storage, it can be incorporated into the third line of defense for frequency safety to address low-frequency issues caused by high power shortages. Explored the feasibility and compatibility of utilizing idle energy storage capacity and power to participate in the electricity energy market and backup auxiliary service market, in order to improve energy storage utilization efficiency. A study was conducted on the configuration of energy storage power sources in high proportion new energy systems.
Under the guidance of the “dual carbon” goal, the installed capacity of renewable energy will develop rapidly, and the peak shaving resources of the power system will become increasingly scarce. Electrochemical energy storage and pumped storage, as the key to solving the grid connected utilization of renewable energy, are effective ways to improve the economic and safety of power grid operation. Taking Xinjiang Power Grid as the research object, analyze the long-term peak shaving demand and energy storage power supply configuration scheme of Xinjiang Power Grid. Divide the peak shaving balance problem into two sub problems for consideration. Firstly, the focus is on the short-term load regulation problem, which mainly answers whether the power supply installation plan can follow the daily load changes normally. The second step is to analyze the long-term peak shaving problem of new energy, that is, to analyze the situation of water, wind, and light waste.
1.Mathematical model
1.1 Research Methods
For high proportion new energy systems, analyzing peak shaving issues on a typical day or monthly basis is not comprehensive enough. Meanwhile, traditional peak shaving balance analysis only focuses on the operation of load power sources at peak and low time points, ignoring power sources such as photovoltaics operating at the waist of the load. Traditional peak shaving balance is difficult to deal with situations where the system abandons wind and light at the installed level.
The output of new energy is greatly affected by natural resource conditions. Usually, the cumulative characteristics of its electricity consumption are obtained by analyzing the annual output characteristics of 8760 hours to determine its effective capacity. The cumulative characteristics of new energy electricity in a certain region are shown in Figure. The effective capacity coefficient corresponding to 100% electricity is 0.64, indicating that the annual output of this new energy source is not greater than 0.64 of the installed capacity at any time of the year. The effective capacity coefficient corresponding to 95% of the electricity is 0.38, indicating that the cumulative power generation during the period when the annual output does not exceed 0.38 accounts for 95% of the entire year.
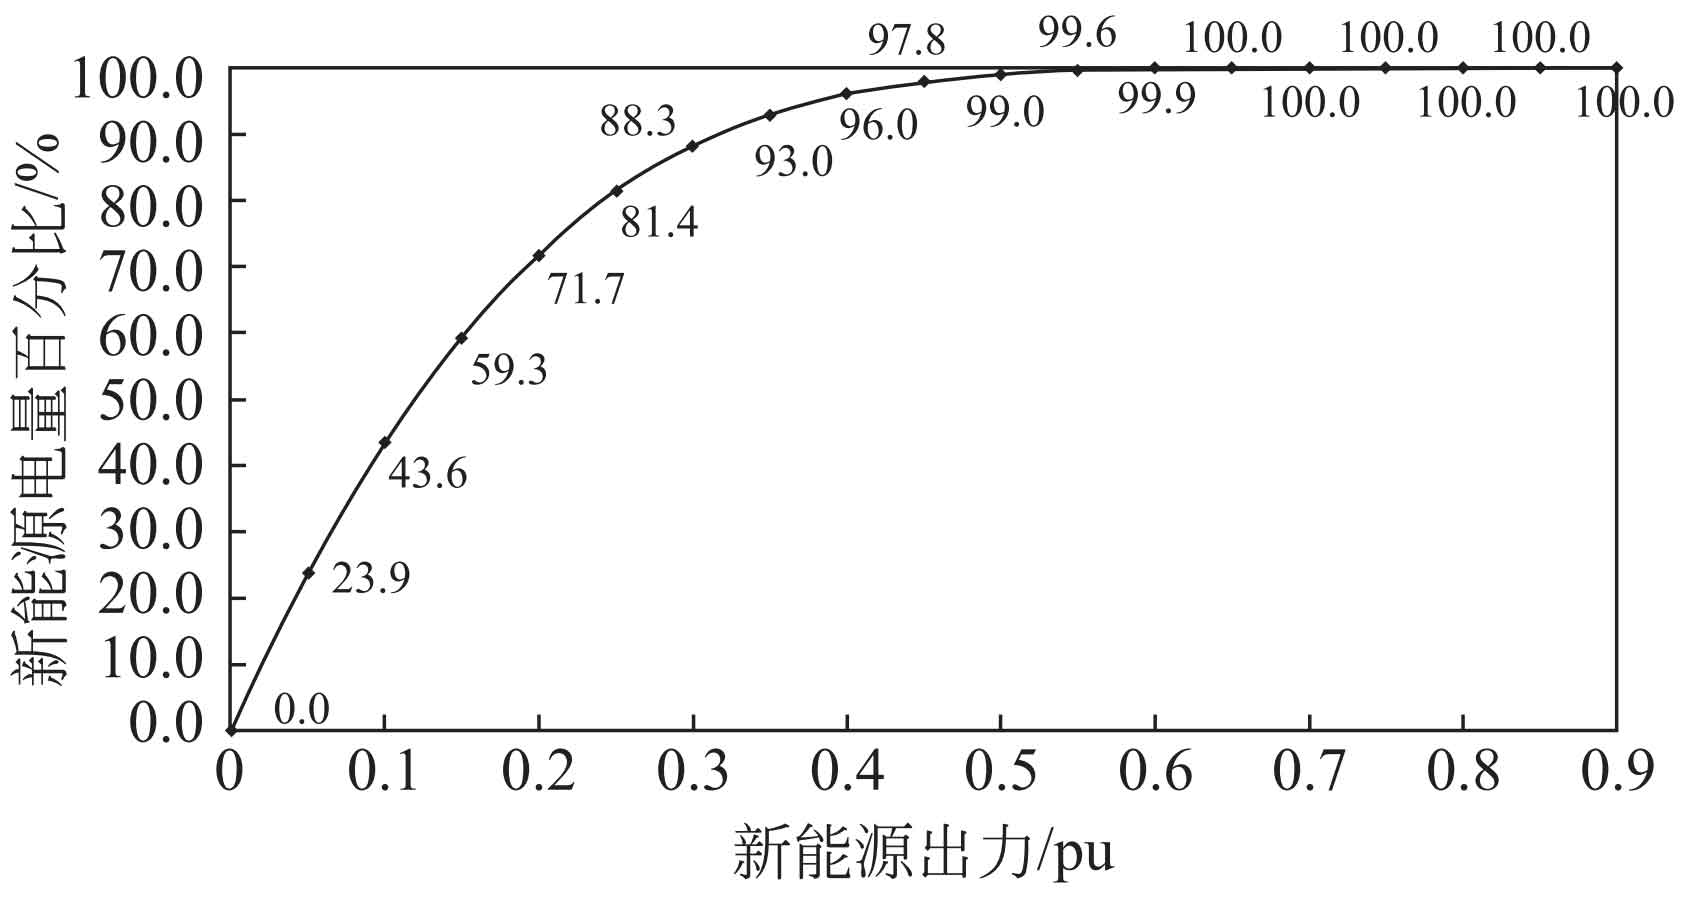
From the perspective of system peak shaving balance, adding new energy sources will increase the system’s downward peak shaving demand equivalent to its effective capacity. Since the previous system peak shaving was basically breakeven, the configured energy storage power supply power should be equal to the effective capacity of the new energy sources in order to maintain system peak shaving balance. The power selection of energy storage depends on the selection of the effective capacity coefficient of new energy. Under equal capacity, the energy storage power source should be selected with high power as much as possible. Therefore, it should be considered to choose an effective capacity coefficient that is close to or equal to 100% of the electricity. After selecting the energy storage power, its energy storage duration should be determined through production simulation based on the system’s needs to ensure that the system’s new energy curtailment rate meets the requirements.
1.2 Full time production simulation program
Through weekly time-series production simulation, high-resolution production simulation calculations were conducted with the goal of minimizing system operating costs. A power output model including conventional units and various renewable energy sources was established, and various unit output plans were arranged in detail, providing important reference for power system optimization planning.
Taking into account the abandonment of new energy and coal consumption for power generation, while meeting load demand constraints, the objective function is to minimize the abandonment of new energy and coal consumption for system power generation:
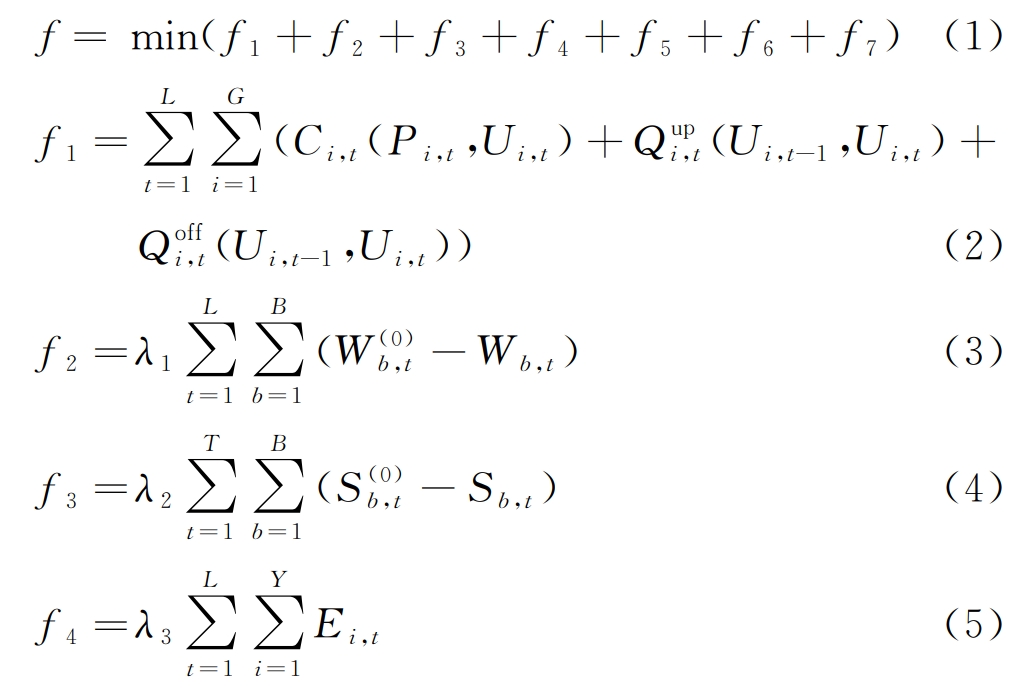
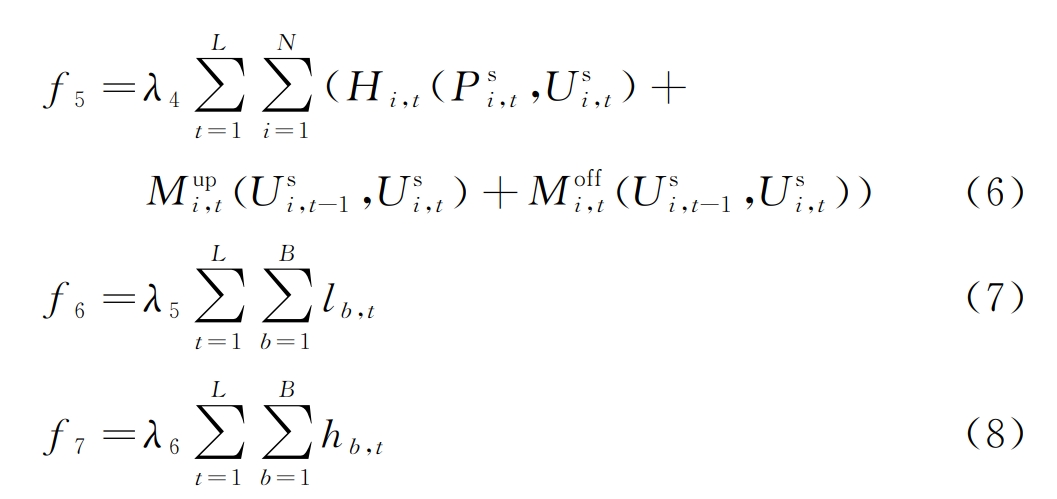
In the formula: Ci, t is the power generation cost function of coal motor group i at time t; Pi, t is the active output of unit i at time t; Ui, t and Ui, t-1 are the operating states of unit i at time t and time t-1, respectively; Qupi, t and Qofi, t are the start-up and shutdown costs of unit i at time t, respectively; λ 1, λ 2, λ 3, λ 4 are penalty factors for wind, solar, water, and efficiency reduction caused by peak shaving operation of solar thermal units; λ 5 is the penalty factor for loss of load; λ 6 is the penalty factor for loss of reserve; Wb, t is the wind farm output at time t node b; W (0) b, t is the predicted output of the wind farm at time t node b; Sb, t is the output of the photovoltaic power station at time t node b; S (0) b, t is the predicted output of the photovoltaic power station at time t node b; Ei, t is the amount of abandoned water at time t of the water motor unit i; Lb, t, and hb, t respectively represent the amount of load loss and backup loss at time t node b; Hb, t is the efficiency of photothermal unit i at time t; Mupi, t and Moffi, t are the start-up and shutdown costs of photothermal unit i at time t, respectively; Usi, t, Usi, t-1 represent the operating status of photothermal unit i at time t and time t-1, respectively; Pi, t is the active output of photothermal unit i at time t; G is the number of thermal power units; Y is the number of hydroelectric units; N is the number of photothermal units; B is the number of nodes.
The constraints of the objective function include system balance constraints, power plant/unit operation constraints, inter regional interconnection line power constraints, etc. The specific expressions can be found in the reference.
2. Analysis of Peak shaving Demand in Xinjiang Power Grid
2.1 Boundary conditions
The load and new energy forecast of Xinjiang power grid are shown in Table 1.
| Comparison items | Total social electricity consumption/(109kW · h) | Maximum social load/GW | Wind power/GW | Photovoltaic/GW | Total/GW |
| 2030 | 500.4 | 69.160 | 58.0 | 44.5 | 102.5 |
| 2035 | 563.2 | 78.320 | 68.5 | 63.5 | 132.0 |
2.2 Calculation of Peak shaving Gap in Xinjiang Power Grid
2.2.1 Peak shaving gap calculation for load and external DC transmission
Considering the peak shaving demand of load and DC, as well as the peak shaving capacity of power supply, without considering new energy, we will unify the consideration of external DC transmission and internal load, and analyze the peak shaving gap of Xinjiang power grid. The principle of peak shaving balance without considering new energy is:
(1) The difference between peak and valley loads is calculated through seasonal imbalance coefficients and daily minimum load rates;
(2) The DC peak valley difference is calculated through the DC curve;
(3) Rotating standby only considers the load within the network, taking a value of 5%;
(4) The working position of water and electricity is calculated by the production simulation program;
(5) The pumping and peak shaving capacity is considered to be twice the capacity.
The load and DC peak shaving results of Xinjiang power grid in 2030 and 2035 are shown in Table 2. It can be seen that the peak shaving surplus of Xinjiang power grid is 19.85 GW and 34.40 GW, respectively.
| Comparison items | Network load | Direct current | Rotating backup | Total | Water and electricity output | Water and electricity supply as backup | Pumped output | Thermal power output | Thermal power undertakes backup | Minimum technical output | Shortage of electricity and peak shaving | |
| 2030 | High load time | 69.16 | 28.00 | 3.46 | 100.62 | 7.30 | 3.43 | 2.40 | 87.46 | 0.02 | 0.00 | 0.00 |
| 2030 | Low load time | 61.00 | 14.00 | 0.00 | 75.00 | 2.81 | 0.00 | -2.40 | 0.00 | 0.00 | 54.74 | 0.00 |
| 2030 | Peak valley difference | 8.16 | 14.00 | 3.46 | 25.62 | -7.92 | -7.92 | -4.80 | -32.74 | -32.74 | -32.74 | -19.85 |
| 2035 | High load time | 78.32 | 28.00 | 3.92 | 110.24 | 8.54 | 3.92 | 2.40 | 95.38 | 0.00 | 0.00 | 0.00 |
| 2035 | Low load time | 67.67 | 14.00 | 0.00 | 81.67 | 3.23 | 0.00 | -2.40 | 0.00 | 0.00 | 46.43 | 0.00 |
| 2035 | Peak valley difference | 10.65 | 14.00 | 3.92 | 28.57 | -9.22 | -9.22 | -4.80 | -48.95 | -48.95 | -48.95 | -34.4 |
2.2.2 Calculation of New Energy Peak shaving Gap
Using a full time production simulation program, calculate the new energy peak shaving gap of the Xinjiang power grid in 2030 and 2035. The calculation results are shown in Table 3.
| Comparison items | Wind power/GW | Photovoltaic/GW | Abandonment rate/% | New energy peak shaving demand (95%)/GW | Peak shaving gap/GW |
| 2030 | 58.00 | 44.50 | 18.1 | 41.86 | 13.10 |
| 2035 | 68.50 | 63.50 | 10.0 | 54.45 | 8.65 |
From Table 3, it can be seen that the new energy curtailment rates in 2030 and 2035 are 18.1% and 10.0%, respectively. Considering that the abandonment rate of new energy does not exceed 5%, the peak shaving gap of Xinjiang power grid in 2030 is 13.10GW, and the peak shaving gap in 2035 is 8.65GW.
2.3 Xinjiang Peak shaving Resource Allocation Plan
The production simulation results of Xinjiang in 2030 are shown in Table 4. By 2030, all flexibility renovations for thermal power in Xinjiang will be completed, with an increase of 4GW × After 2 hours of energy storage power supply, the system’s curtailment rate does not exceed 5%, the proportion of new energy consumption is 34%, and the proportion of renewable energy can reach 42%. If a pumped storage power station is used as the energy storage power source, a 2.4GW configuration is required × An 8-hour pumped storage power station.
| Comparison items | Internal electricity consumption/(10 ^ 9kW · h) | DC power/(10 ^ 9kW · h) | Hydroelectric power/(10 ^ 9kW · h) | Thermal power generation/(10 ^ 9kW · h) | Wind power consumption/(10 ^ 9kW · h) | Photovoltaic power/(10 ^ 9kW · h) | Energy storage capacity/(10 ^ 9kW · h) | New energy curtailment rate/% | The proportion of new energy consumption/% | Renewable energy electricity proportion/% |
| Flexibility renovation of all thermal power plants, increasing energy storage capacity by 4GW × 2h | 465.4 | 155.0 | 53.3 | 356.9 | 141.8 | 69.2 | -0.8 | 5.0 | 34.0 | 42.6 |
| Flexibility renovation of all thermal power plants, increasing pumping and storage capacity by 2.4GW × 8h | 465.4 | 155.0 | 53.3 | 357.4 | 141.7 | 69.1 | -1.0 | 5.1 | 34.0 | 42.6 |
The production simulation results of Xinjiang Power Grid in 2035 are shown in Table 5. After the flexibility renovation of thermal power, an increase of 16.0GW will be achieved × After 2 hours of energy storage power supply, the system’s curtailment rate does not exceed 5%, the proportion of new energy generation is 39%, and the proportion of renewable energy exceeds 45%. If pumped storage power stations are used as energy storage power sources, 8.4GW will need to be configured separately × An 8-hour pumped storage power station.
| Increase energy storage | Internal electricity consumption/(10 ^ 9kW · h) | DC power/(10 ^ 9kW · h) | Hydroelectric power/(10 ^ 9kW · h) | Thermal power generation/(10 ^ 9kW · h) | Wind power consumption/(10 ^ 9kW · h) | Photovoltaic power/(10 ^ 9kW · h) | Energy storage capacity/(10 ^ 9kW · h) | New energy curtailment rate/% | The proportion of new energy consumption/% | Renewable energy electricity proportion/% |
| 16.0GW × 2h | 528.2 | 155.0 | 60.3 | 358.4 | 168.6 | 97.7 | -1.8 | 4.9 | 39.0 | 47.8 |
| 8.4GW × 8h | 528.2 | 155.0 | 60.3 | 360.5 | 167.1 | 98.0 | -2.6 | 5.4 | 38.8 | 47 |
3. Conclusion
A study was conducted on the peak shaving demand of Xinjiang Power Grid from 2025 to 2035. In the calculation, a full time production simulation program based on mathematical optimization is considered, which can consider thermal power flexibility transformation, cross day adjustment of energy storage power sources, etc. The research results indicate that:
(1) By 2030, Xinjiang thermal power will undergo full flexibility transformation and increase by 4.0GW × After 2 hours of energy storage, the utilization rate of new energy in the system exceeds 95%. If a pumped storage power station is used as the energy storage power source, a 2.4GW configuration is required × An 8-hour pumped storage power station.
(2) By 2035, Xinjiang will increase by 16.0 GW × After 2 hours of energy storage, the utilization rate of new energy in the system exceeds 95%. If a pumped storage power station is used as the energy storage power source, 8.4GW needs to be configured × An 8-hour pumped storage power station.