
The widespread adoption of photovoltaic (PV) technology is a cornerstone of the global transition to sustainable energy. However, the operational efficiency of solar power plants, particularly those in arid and semi-arid regions, faces a persistent and significant challenge: the accumulation of dust and particulate matter on the surface of solar panels. This layer of grime, often referred to as “soiling,” directly attenuates the amount of solar irradiance reaching the photovoltaic cells, leading to a substantial and often underestimated reduction in power generation. Our observations and numerous industry reports confirm that unchecked soiling can lead to annual energy losses exceeding 20% in certain environments, representing a major economic setback and a barrier to achieving optimal return on investment for solar assets. Therefore, developing intelligent strategies for panel cleaning is not merely an operational concern but a critical factor for the financial viability and reliability of solar power generation.
The conventional approach to mitigating soiling losses relies on periodic, scheduled cleaning. This method, while straightforward, is inherently inefficient. For large-scale utility solar farms located in remote areas, mobilizing cleaning crews and equipment is logistically complex and costly. Cleaning too frequently wastes water and labor, while cleaning too infrequently results in prolonged periods of suboptimal energy harvest. The core of the problem lies in the variable nature of dust accumulation itself. The rate at which dust settles on solar panels is not constant; it is a dynamic process influenced by a complex interplay of local environmental and meteorological factors. Key influencers include wind speed and direction, which transport dust; ambient humidity, which can cause particles to adhere more strongly; the lack of rainfall, which acts as a natural cleaner; and even local soil composition and human activity. Consequently, a fixed cleaning schedule cannot adapt to these changing conditions, leading to either wasted resources or lost revenue.
To address this, we propose a shift from calendar-based maintenance to a condition-based, predictive strategy. The premise is to forecast the daily soiling rate based on readily available meteorological data. By accurately predicting how much dust will accumulate on a given day, plant operators can make data-driven decisions about when to initiate cleaning cycles, optimizing both energy yield and operational expenditure. This study presents a novel predictive modeling framework for solar panel soiling. We developed and tested an advanced machine learning model that correlates historical meteorological parameters with measured dust density on panel surfaces. The model’s heart is a Support Vector Machine (SVM) for regression, a powerful algorithm known for its effectiveness with small to medium-sized datasets. However, the predictive performance of an SVM is highly sensitive to the selection of its internal parameters. To overcome this, we integrated an enhanced optimization metaheuristic—an Improved Sparrow Search Algorithm (ISSA)—to automatically find the optimal SVM configuration. Our results demonstrate that this ISSA-SVM hybrid model achieves superior prediction accuracy compared to other common optimization techniques, providing a reliable tool for forecasting soiling on solar panels.
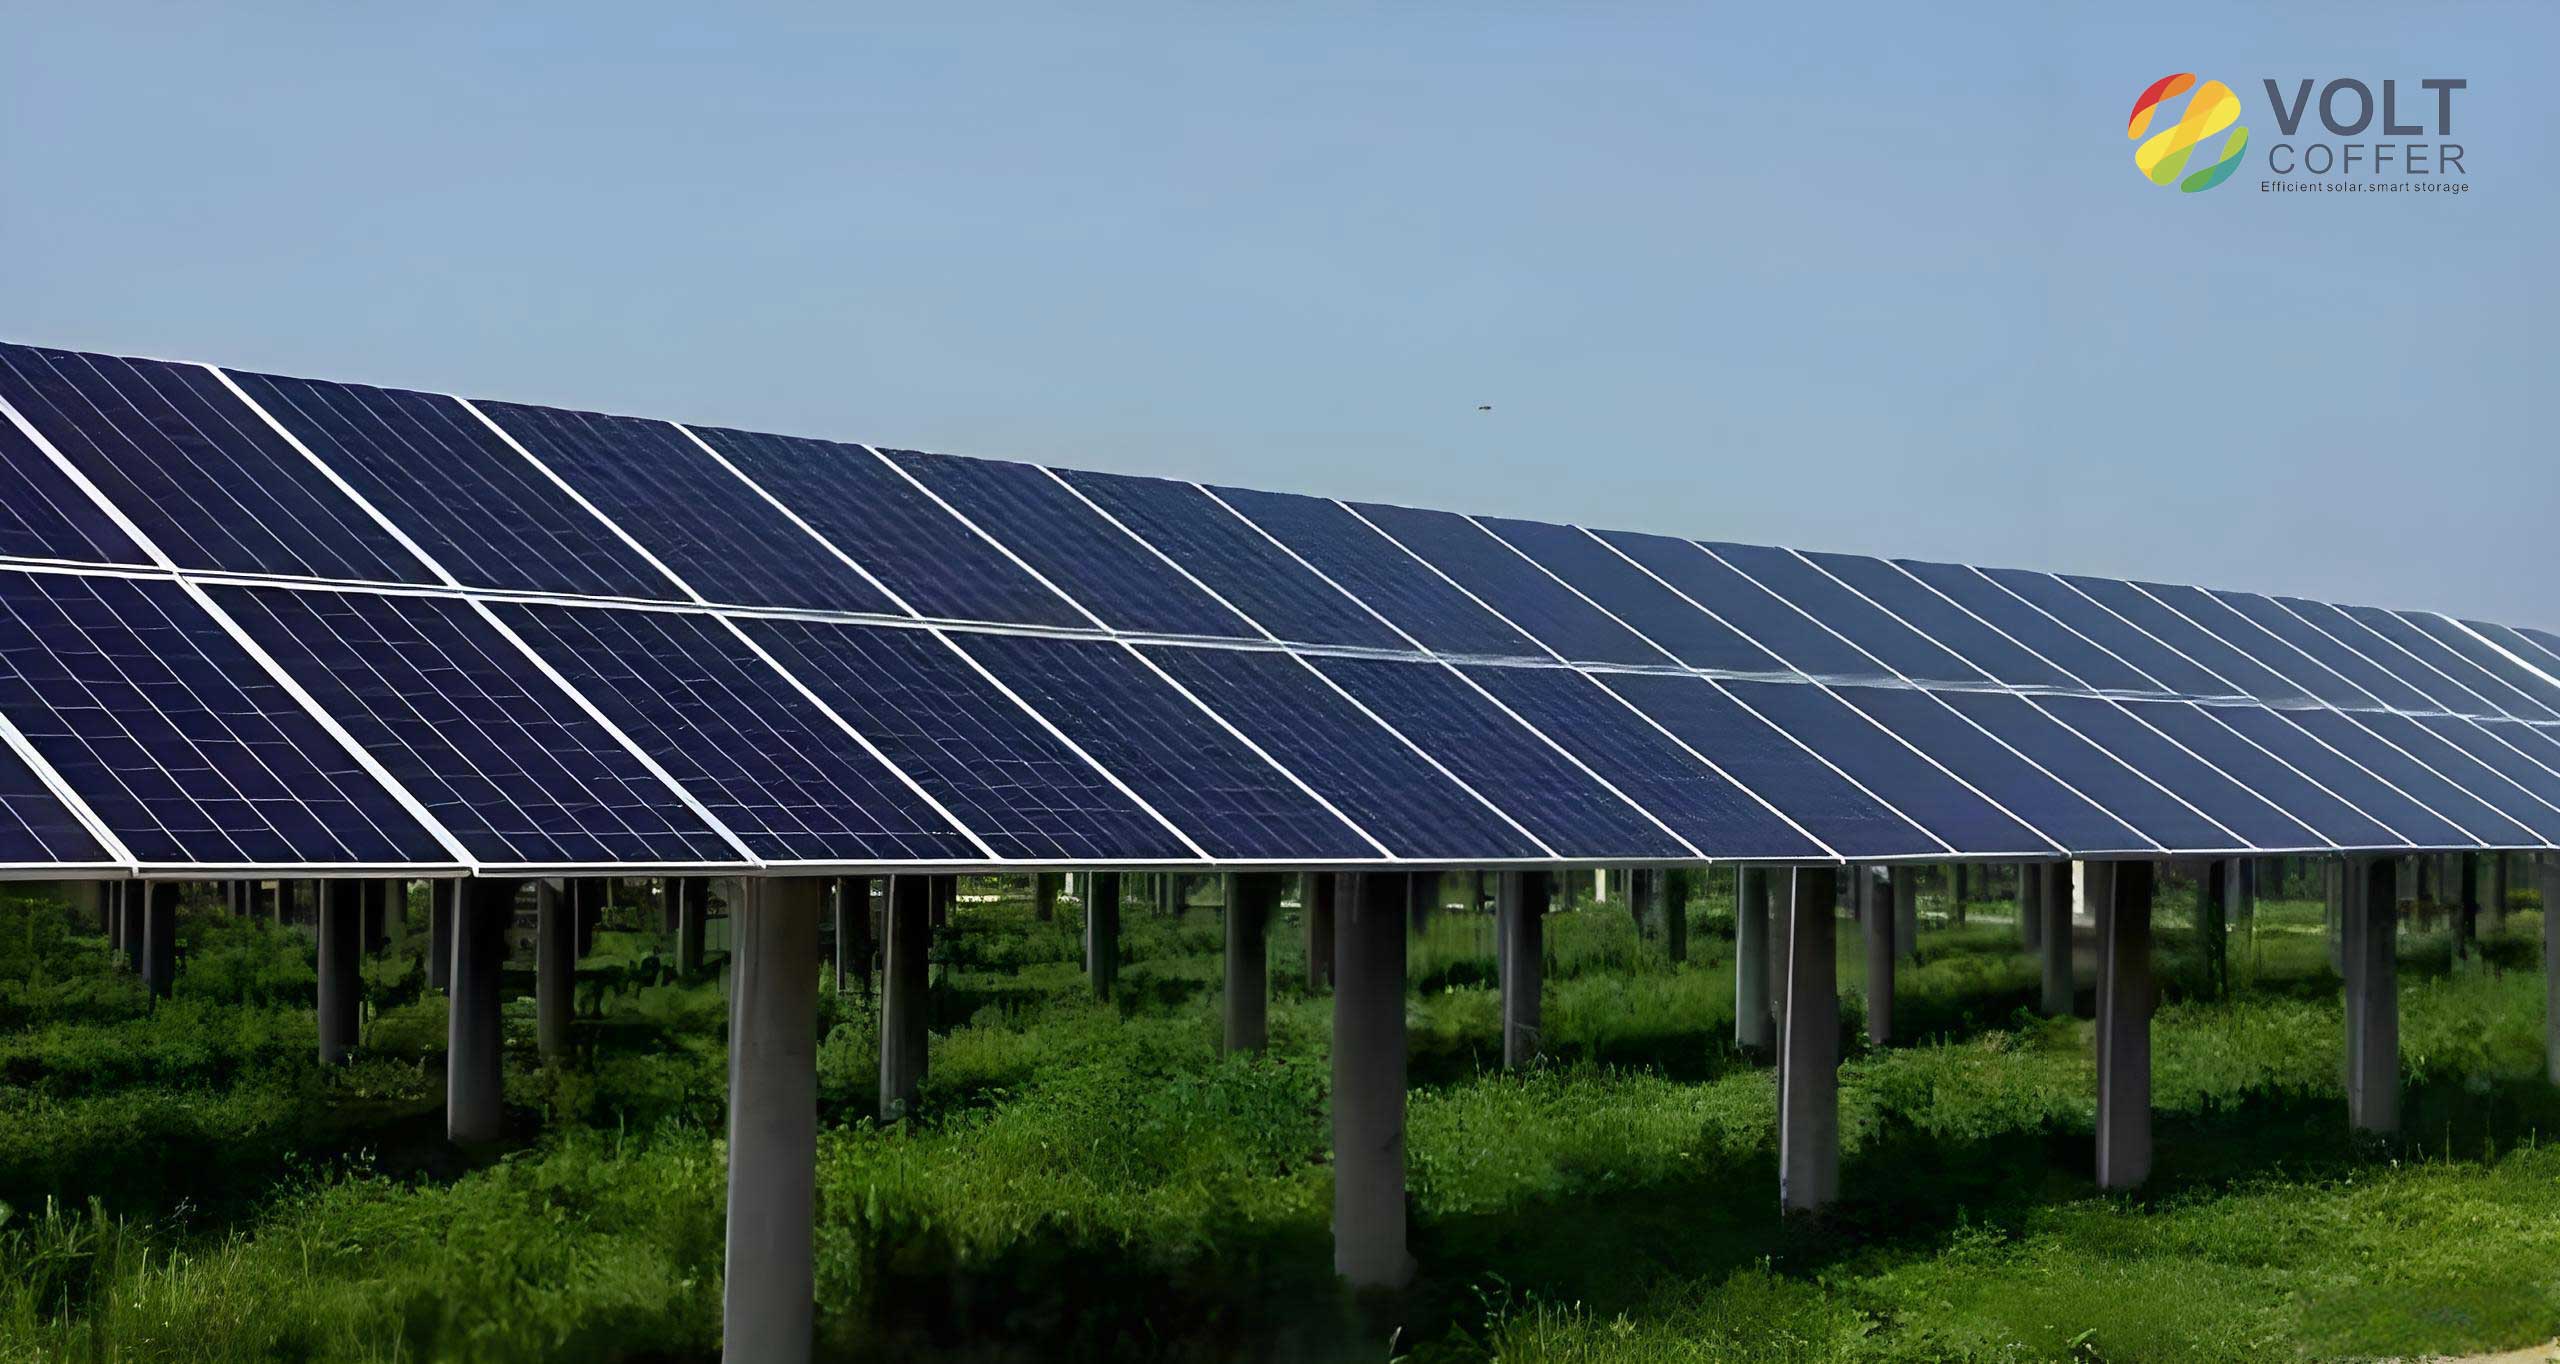
Methodology: A Hybrid Intelligent Framework for Soiling Prediction
Our predictive framework is built upon a synergy between a robust regression model and a sophisticated bio-inspired optimizer. The process involves using historical weather data (inputs) to predict the daily dust density in grams per square meter (g/m²) on the solar panels (output). The success of this approach hinges on the ability of the model to learn the non-linear relationships between weather patterns and dust deposition.
1. Foundation: Support Vector Machine for Regression (SVR)
The Support Vector Machine, when applied to regression problems (SVR), seeks to find a function \(f(x)\) that deviates from the actual observed targets \(y_i\) by a value no greater than a specified margin \(\epsilon\), while simultaneously being as “flat” as possible. For non-linear relationships, as expected between weather and soiling on solar panels, the input data \(\mathbf{x}\) is mapped into a higher-dimensional feature space using a kernel function \(\phi(\mathbf{x})\), where a linear regression is performed. The regression function is expressed as:
$$ f(\mathbf{x}) = \mathbf{\omega} \cdot \phi(\mathbf{x}) + b $$
where \(\mathbf{\omega}\) is the weight vector and \(b\) is the bias term. The core optimization problem for SVR is formulated as:
$$
\begin{aligned}
& \min_{\mathbf{\omega}, b, \xi_i, \xi_i^*} \quad \frac{1}{2} \|\mathbf{\omega}\|^2 + C \sum_{i=1}^{n} (\xi_i + \xi_i^*) \\
& \text{subject to} \quad \begin{cases}
y_i – \mathbf{\omega} \cdot \phi(\mathbf{x}_i) – b \le \epsilon + \xi_i \\
\mathbf{\omega} \cdot \phi(\mathbf{x}_i) + b – y_i \le \epsilon + \xi_i^* \\
\xi_i, \xi_i^* \ge 0
\end{cases}
\end{aligned}
$$
Here, \(C\) is the regularization parameter (penalty factor), which controls the trade-off between achieving a flat function and the amount of deviation larger than \(\epsilon\) that is tolerated. The \(\xi_i\) and \(\xi_i^*\) are slack variables that allow for some data points to lie outside the \(\epsilon\)-margin. For our model focused on solar panel soiling, we employ the Radial Basis Function (RBF) kernel, which is highly effective for capturing complex patterns:
$$ K(\mathbf{x}_i, \mathbf{x}_j) = \exp\left(-\gamma \|\mathbf{x}_i – \mathbf{x}_j\|^2\right) $$
where \(\gamma\) is the kernel parameter, inversely related to the influence radius of a single training example. The accuracy of the SVR model for predicting dust on solar panels is critically dependent on the proper tuning of the two hyperparameters: the penalty factor \(C\) and the kernel parameter \(\gamma\). Manual tuning is impractical; hence, we employ an automated optimization algorithm.
2. The Optimizer: Enhanced Sparrow Search Algorithm (ISSA)
The Sparrow Search Algorithm (SSA) is a recently proposed metaheuristic inspired by the collective foraging and anti-predation behaviors of sparrows. In SSA, individuals in the population are categorized into three roles: Producers (discoverers), Scroungers (joiners), and Scouts. Producers actively search for food sources (good solutions), Scroungers follow the producers to exploit known resources, and Scouts monitor for danger and initiate escapes from local optima. While effective, the basic SSA can suffer from uneven initial population distribution and fixed producer-scrounger ratios, which may limit its convergence speed and precision for complex problems like tuning our solar panel soiling model.
We introduce two key enhancements to create the Improved SSA (ISSA):
a) Logistic-Tent Chaotic Mapping for Population Initialization: Instead of random initialization, we use a hybrid Logistic-Tent chaotic map to generate the initial positions of the sparrows. This ensures the population is more evenly distributed across the search space (\(C\) and \(\gamma\) ranges), improving the algorithm’s global exploration capability from the outset. The chaotic sequence \(X_{n+1}\) is generated by:
$$
X_{n+1} =
\begin{cases}
\left[ r X_n (1 – X_n) + \frac{(4-r)}{2} X_n \right] \mod 1, & \text{if } X_n < 0.5 \\
\left[ r X_n (1 – X_n) + \frac{(4-r)(1 – X_n)}{2} \right] \mod 1, & \text{if } X_n \ge 0.5
\end{cases}
$$
where \(r\) is a control parameter. This sequence is then scaled to the defined parameter search bounds for the solar panel model.
b) Adaptive Producer-Scrounger Ratio: In the standard SSA, the proportion of producers and scroungers is fixed. We introduce a dynamic adjustment factor \(D\) that changes with the iteration count \(t\):
$$
s = \frac{t}{iter_{max}}, \quad D = \frac{2}{\sqrt{2\pi}} \cdot e^{-(s^2/2)} – \frac{3s}{10}
$$
The number of producers \(F_{Num}\) and scroungers \(J_{Num}\) in a population of size \(N\) are then:
$$ F_{Num} = N \cdot D, \quad J_{Num} = N \cdot (1 – D) $$
This mechanism starts with a higher proportion of producers to favor global exploration in early iterations. As the search progresses, the number of scroungers increases to focus on local exploitation around the best-found solutions for the solar panel prediction parameters, enhancing convergence accuracy.
The position update rules for producers, scroungers, and scouts follow the standard SSA equations but utilize the adaptive numbers defined above.
3. The Integrated ISSA-SVM Framework for Solar Panels
The workflow for building our soiling prediction model for solar panels is as follows:
- Data Preparation: Collect and pre-process paired datasets of daily meteorological variables (inputs) and measured dust density on solar panels (target output).
- ISSA Setup: Configure the ISSA parameters (population size, maximum iterations). Each sparrow’s position is a 2-dimensional vector \([C, \gamma]\), representing a candidate set of hyperparameters for the SVM model.
- Optimization Loop: For each sparrow (hyperparameter set):
- Train an SVM model on the training dataset using the \(C\) and \(\gamma\) values.
- Evaluate the model’s performance on a validation set. The performance metric, or fitness value, is the Root Mean Square Error (RMSE):
- The ISSA aims to minimize this RMSE, iteratively updating sparrow positions to find the hyperparameters that yield the most accurate predictions for solar panel dust accumulation.
$$ \text{RMSE} = \sqrt{\frac{1}{m} \sum_{i=1}^{m} (y_{pred_i} – y_i)^2} $$
- Model Deployment: The optimal \([C^*, \gamma^*]\) found by ISSA is used to construct the final SVM prediction model. This model can then forecast daily soiling density on solar panels based on new meteorological input data.
Data Collection and Experimental Setup for Solar Panel Soiling
To validate our model, we conducted a field study. The primary goal was to gather high-quality, daily measurements of dust accumulation under real-world conditions, synchronized with local meteorological data. The experiment was designed to isolate the soiling effect on standard solar panels.
Soiling Measurement Method: We used two glass plates with identical surface texture and properties to standard photovoltaic glass. These plates were mounted at a \(45^\circ\) tilt angle, facing due south, adjacent to operational solar panels to experience identical environmental exposure. Every day at a fixed time (9:00 PM), the plates were carefully collected and weighed using a high-precision electronic balance (accuracy 0.0001 g). The daily dust accumulation mass was calculated as the difference between consecutive day’s weights. This mass was then divided by the plate’s area to obtain the daily soiling density in \(g/m^2\). The average of the two plates’ readings was used as the final daily soiling value for that location, directly relevant to understanding losses on commercial solar panels.
Meteorological Data: Corresponding daily meteorological data was obtained from a local weather station network. The input features selected for the model were:
- Daily Average Temperature (°C)
- Daily Average Relative Humidity (%)
- Daily Average Wind Speed (m/s)
- Daily Precipitation (mm)
- Daily Sunshine Duration (hours)
Data Filtering and Partitioning: Extreme weather events can distort the soiling pattern. Days with heavy rain (>10 mm) were considered natural cleaning events, resetting soiling to near-zero. Days with very light drizzle (<0.3 mm) were found to dramatically increase dust adhesion, creating outliers. Data from such days were removed from the training set to improve model stability for typical conditions. After filtering, we had 142 days of valid data. This was split into 122 days for training the ISSA-SVM model and 20 unseen days for final testing and comparison.
The correlation between key weather parameters and observed soiling density on the test solar panels is summarized qualitatively in the table below.
| Meteorological Parameter | Observed Influence on Solar Panel Soiling Density |
|---|---|
| Precipitation | Strong negative correlation. Rain >10mm effectively cleans panels. Drizzle <0.3mm can increase adhesion. |
| Wind Speed | Moderate positive correlation. Higher winds transport more dust, but very high winds can also have a cleaning effect. |
| Relative Humidity | Complex relationship. High humidity can cause dust to stick more firmly, increasing persistent soiling. |
| Sunshine Duration | Weak indirect correlation. Longer dry, sunny periods typically coincide with higher dust accumulation on static solar panels. |
Model Performance and Comparative Analysis
We implemented our ISSA-SVM model and compared its performance against SVM models optimized by other prevalent algorithms: the standard Sparrow Search Algorithm (SSA), Particle Swarm Optimization (PSO), and Grey Wolf Optimizer (GWO). All algorithms were set with a population size of 50 and a maximum of 100 iterations, searching for the optimal \(C\) and \(\gamma\) within the range \([0.001, 1000]\).
The convergence curves, plotting the best fitness value (RMSE) against iteration number, provide the first insight. The ISSA-SVM model demonstrated markedly faster convergence, reaching a stable optimum around the 32nd iteration. In contrast, the SSA, PSO, and GWO models required approximately 70-75 iterations to converge. More importantly, the final fitness value (RMSE) achieved by ISSA was the lowest among all, indicating it found a superior set of hyperparameters for the solar panel soiling prediction task.
The true test of the models is their predictive accuracy on the unseen test dataset. We evaluated this using two metrics: the Root Mean Square Error (RMSE) and the Coefficient of Determination (\(R^2\)). \(R^2\) indicates how well the model’s predictions fit the actual data, with a value closer to 1.0 representing a perfect fit.
$$ R^2 = 1 – \frac{SS_{res}}{SS_{tot}} = 1 – \frac{\sum_{i=1}^{m} (y_i – \hat{y}_i)^2}{\sum_{i=1}^{m} (y_i – \bar{y})^2} $$
The performance comparison is quantitatively summarized in the table below.
| Prediction Model | Root Mean Square Error (RMSE) | Coefficient of Determination (R²) | Interpretation for Solar Panel Soiling Forecast |
|---|---|---|---|
| ISSA-SVM (Proposed) | 0.0081 | 0.971 | Excellent fit. Predictions closely track actual daily soiling measurements. |
| SSA-SVM | 0.0125 | 0.943 | Very good fit, but less accurate than the improved version. |
| GWO-SVM | 0.0130 | 0.938 | Good fit, comparable to standard SSA. |
| PSO-SVM | 0.0315 | 0.815 | Moderate fit. Predictions show significant deviation from actual soiling values. |
The results clearly demonstrate the superiority of the ISSA-SVM model. With an \(R^2\) of 0.971 and the lowest RMSE, it captures the relationship between meteorological conditions and dust accumulation on solar panels with high fidelity. The visual plot of predicted vs. actual soiling density for the ISSA-SVM model shows the data points clustering tightly around the ideal 45-degree line, confirming its reliability as a forecasting tool for solar farm operators.
Impact Analysis: From Soiling Density to Power Loss and Maintenance Strategy
Predicting soiling density is only the first step. The ultimate goal is to understand its economic impact—the loss in generated power—and to translate this into an actionable maintenance plan. The relationship between dust density on solar panels and their electrical output is well-established but non-linear. Based on empirical studies, the relative power loss \(P_{loss}\) (in %) can be modeled as a function of soiling density \(x\) (in \(g/m^2\)). A fitted function characterizing this impact is:
$$ P_{loss}(x) = 62.94 – 54.89 \cdot x^{-0.0591} $$
This function reveals that power loss increases rapidly with initial dust deposition and then tends to saturate at higher dust loads. For instance, a light dust layer of \(1 \, g/m^2\) might cause a ~8% drop in output, while a heavy accumulation of \(5.5 \, g/m^2\) could lead to a loss exceeding 13%. Applying this function to our measured time-series data allows us to construct a profile of daily estimated power reduction due solely to soiling on the monitored solar panels.
By integrating the predicted soiling density from our ISSA-SVM model with this power-loss function and historical rainfall data, we can derive intelligent maintenance insights. The analysis of our five-month dataset revealed clear patterns:
- Months with Scarce Rainfall (e.g., March, April, June): Soiling density increased steadily, often exceeding \(5 \, g/m^2\), correlating with sustained power losses above 12-13%. In these periods, the predictive model would consistently forecast high daily soiling rates, triggering a recommendation for proactive cleaning to recover lost yield.
- Months with Frequent/Heavy Rain (e.g., May, July): Rainfall events, particularly those over 10 mm, acted as effective natural cleansers. Soiling density rarely built up beyond \(2.5 \, g/m^2\), and power losses were contained below 11%. Here, the model would predict low accumulation after rain events, allowing the postponement of manual cleaning and saving operational costs.
Therefore, the practical application of our ISSA-SVM predictive framework for solar panels is a decision-support system. It enables a dynamic cleaning schedule:
- Forecast: Input the next day’s weather forecast into the trained model.
- Predict: Obtain a prediction for the expected soiling density.
- Calculate: Estimate the associated power loss and cumulative energy loss over time.
- Decide: Compare the cost of lost energy with the cost of cleaning. Initiate a cleaning cycle only when the economic loss from soiling is predicted to exceed the cleaning cost, or when soiling reaches a critical density threshold (e.g., corresponding to a 10% power loss).
This condition-based strategy, powered by accurate soiling prediction, maximizes the net energy yield from solar panels and optimizes operational and maintenance (O&M) budgets.
Conclusion
The accumulation of dust on solar panels represents a significant and manageable challenge to the efficiency of photovoltaic power generation. Moving beyond rigid, calendar-based cleaning schedules is essential for optimizing the performance and profitability of solar assets, especially in dust-prone regions. This study successfully developed and validated a novel hybrid prediction model, ISSA-SVM, designed to accurately forecast daily soiling density based on standard meteorological data.
The key innovations lie in the enhancement of the Sparrow Search Algorithm through chaotic initialization and an adaptive role-adjustment mechanism. These improvements allowed the ISSA to more effectively and efficiently locate the optimal hyperparameters for the Support Vector Machine regressor. The resulting model demonstrated superior performance, achieving a prediction accuracy (\(R^2 = 0.971\)) that outperformed models optimized by standard SSA, PSO, and GWO algorithms. This high level of accuracy makes the ISSA-SVM model a reliable tool for estimating soiling on solar panels.
Furthermore, by linking the predicted soiling density to a well-established power-loss function, the framework provides a direct pathway from environmental data to an estimate of economic impact. This empowers solar farm operators with a data-driven, condition-based maintenance strategy. Instead of cleaning at fixed intervals, cleaning can be scheduled precisely when the predicted energy losses from dirty solar panels justify the cost of intervention, or when natural rainfall is insufficient to maintain cleanliness. This intelligent approach minimizes unnecessary cleaning expenses while preventing prolonged periods of energy production loss, thereby enhancing the overall operational efficiency and financial return of solar power plants. Future work may involve integrating this model with real-time weather forecasting APIs and SCADA systems for fully automated, predictive maintenance scheduling for solar panel arrays.