
l. Introduction
In recent years, the research and application of battery energy storage technology have made significant progress. In the field of power grid applications, modular battery energy storage systems with high requirements for energy storage power and capacity have good application prospects. Battery management is the core of ensuring battery function and ensuring safety, among which battery SOC estimation has become a hot research topic for scholars in recent years.
At present, the main methods for estimating battery S0C include internal resistance method, open circuit voltage method, ampere-hour integration method, Kalman filtering method, extended Kalman filtering algorithm, neural network method, and machine learning method. Due to the many factors that affect internal resistance and the high difficulty of measurement, the implementation of internal resistance method is relatively difficult; The open circuit voltage method is not suitable for online estimation; The Anshi integration method cannot avoid the problem of error accumulation; The traditional Kalman filtering method is not suitable for nonlinear situations such as battery S0C; Neural network and machine learning methods require a large amount of data and computation to train learning, and are still in the theoretical research stage. At present, the application of the ampere hour integration method supplemented by feature point correction and the extended Kalman filtering algorithm is relatively widespread.
A typical modular energy storage system has two topological structures: cascaded H-bridge and modular multi-level. Unlike conventional low-voltage two-level and three-level energy storage application topologies, modular battery energy storage systems have inherent components such as power frequency, second harmonic, and harmonic in the battery current.
These frequency components will have an adverse impact on the accuracy of battery SOC estimation, and pose higher requirements for the design of BMS. Unfortunately, there are currently no research reports on SOC estimation and battery management for battery operating conditions in this modular energy storage system. A working condition model of modular battery energy storage system has been established here, and sampling optimization methods suitable for modular battery energy storage system have been analyzed and proposed,
The effectiveness of the sampling optimization method was verified based on the measured data of a modular multi-level battery energy storage system.
2. Battery operating conditions model in modular energy storage systems
For the convenience of research, a modular multi-level battery energy storage system experimental platform was constructed as shown in Figure 1. Among them, ① represents the switch commands of each submodule; ② Indicates the status signal of the submodule; ③ Is the terminal voltage of the battery cell; ④ Is the individual current of the battery; ⑤ Digital quantities of voltage and current at the battery cell end.
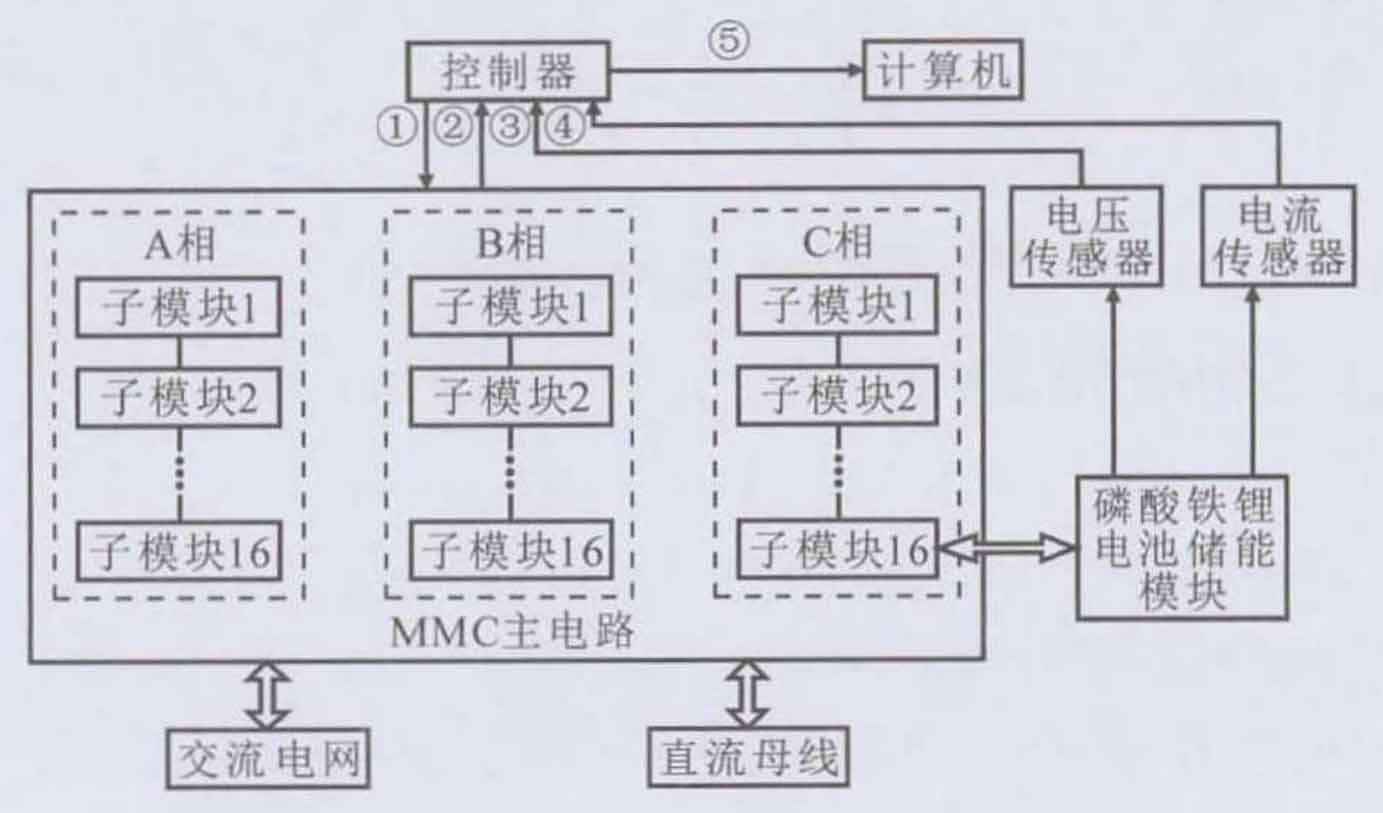
In the modular multilevel converter (MMC) battery energy storage system, each bridge arm is composed of 16 sub modules, with a switching frequency of 1kHz and a grid frequency of 50Hz. The submodule battery is a lithium iron phosphate battery, model IFR32135, with a capacity of 15A. h. When SOC=50%, the internal resistance is about 2mO. The grid connected voltage on the AC side of the MMC battery energy storage system is 35V, and the grid connected voltage on the DC side is 85.8V. The current of the iron phosphate battery and the terminal voltage of the four cells are sampled by voltage and current sensors and AD, and then uploaded by the controller to the computer for recording. The sampling frequency Fs=20kHz, and the sampling accuracy is 16bits. The voltage and current waveforms of the battery cell terminal are shown in Figure 2.
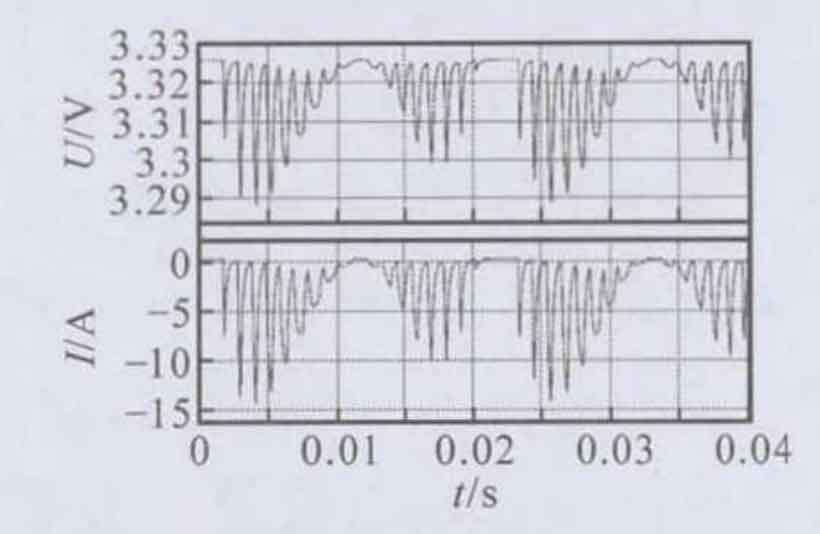
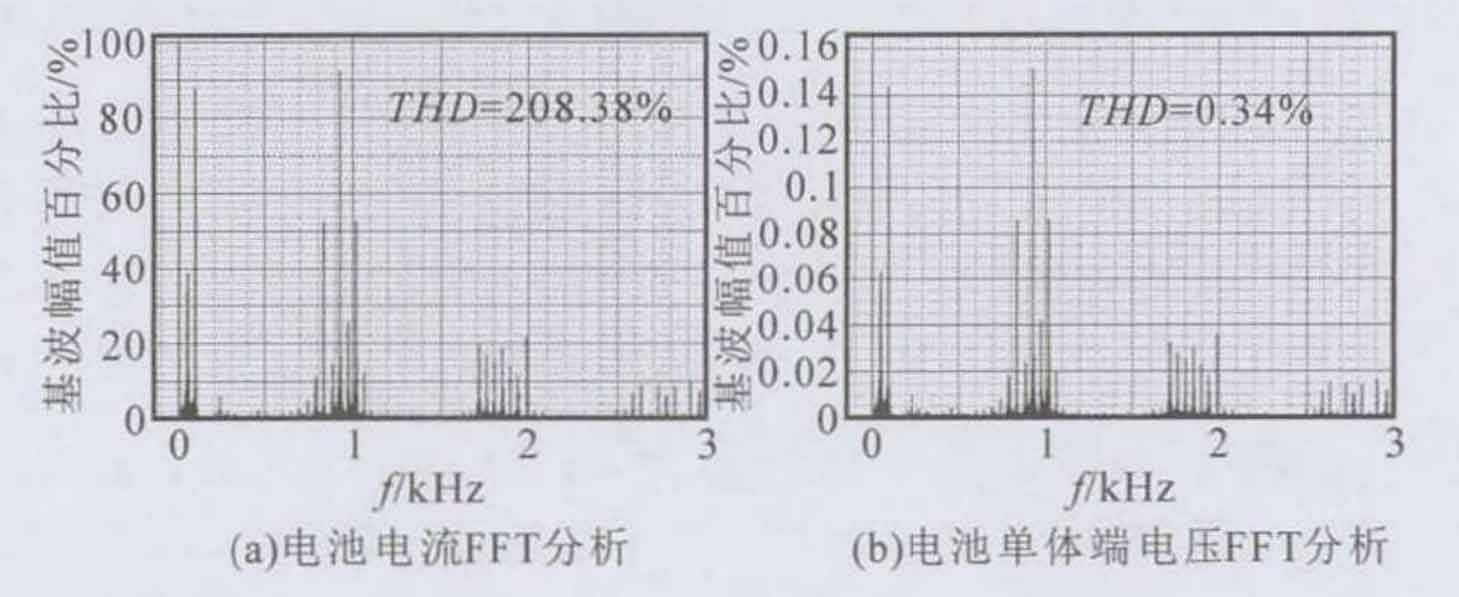
Fast Fourier transform (FFT) analysis was performed on the voltage and current of the battery cell terminals, and the results are shown in Figure 3. From the measured voltage, current waveforms, and spectrum, it can be seen that in addition to the DC component, the harmonic frequency components of the battery side voltage and current include the power frequency component of 50Hz, the second harmonic frequency component of 100Hz Switching frequency 1kHz and its harmonic components. Among them, the direct current component is -2.132A, and the main harmonic components include: the power frequency component is 50Hz, with a content of 38.56%; The second harmonic component is 100Hz, with a content of 87.72%; The switching frequency is 1kHz and the content is 25.53%. The DC component of the terminal voltage is 3.314V, and the main harmonic components include: 50Hz power frequency component, with a content of 0.05%; The second harmonic component is 100Hz, with a content of 0.14%; The switching frequency is 1kHz and the content is 0.15%.
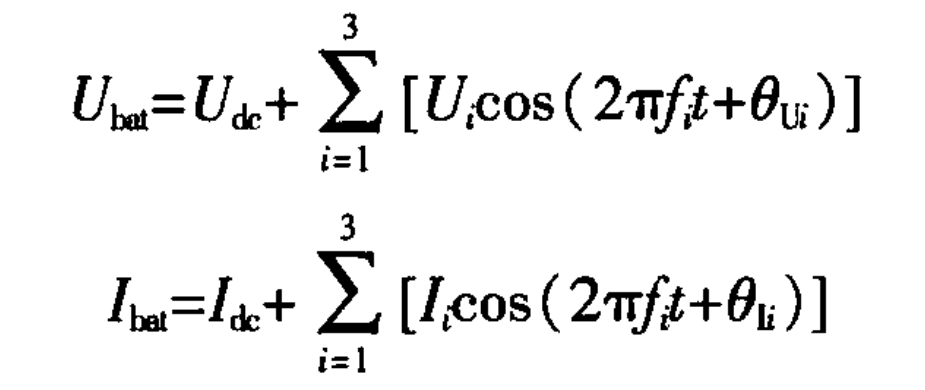
Building a battery working condition model in a modular energy storage system based on MMC devices. The battery cell current and port voltage of its submodules mainly include: DC component, where the DC component of the current is Idc and the DC component of the voltage is Udc; Power frequency component, where the frequency is f1, the power frequency current amplitude is A, and the phase is θ 11. The amplitude of the power frequency voltage is 0 m in phase; The second harmonic component, where the frequency is set to I2, and the second harmonic current amplitude is θ 12. The phase is known, the amplitude of the second harmonic voltage is U2, and the phase is θ U2; Switch frequency component, where the frequency is f3, the current amplitude is I3, and the phase is θ 13. The voltage amplitude is U3, and the phase is θ U3. The voltage Ubat and current Ibat of the battery cell port can be expressed as:
3.SOC estimation method and sampling optimization
3.1 Ampere hour integration method
The ampere hour integration method is also known as the current integration method. This method integrates the amount of electricity released by the battery and monitors it in real-time, providing the SOC of the battery at any time based on the monitoring results. The calculation formula for the Anshi integration method is as follows:
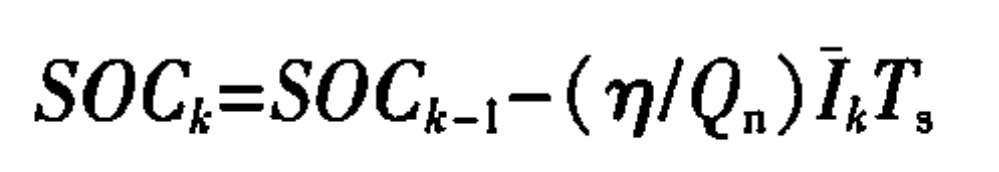
In the formula: SOCk is the SOC of the k-th sampling window, k=l, 2; η Correction factor for battery capacity; Qn is the rated capacity of the battery cell, and Ik is the average current value of the k-th sampling window as the input for SOC estimation; Ts is the sampling window width.
3.2 Extended Kalman Filter Algorithm
When using the extended Kalman filter algorithm for SOC estimation, it is necessary to set up a process model and an observation model. The extended Kalman filter method is used to modify the ampere hour integration method with the extended Kalman filter, and the nonlinear function is expanded and linearized using Taylor series. The process model can be shown as follows:
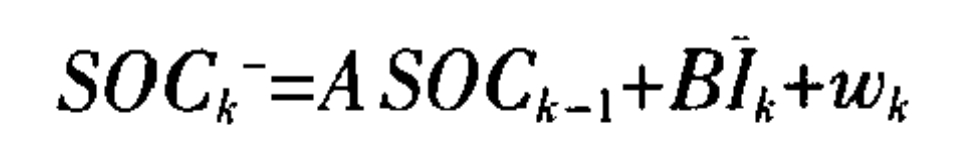
In the formula, SOCk is the estimated value of SOC before the correction of the k-th estimation period; A. B is the coefficient.
In addition, the voltage observation model can be represented as:
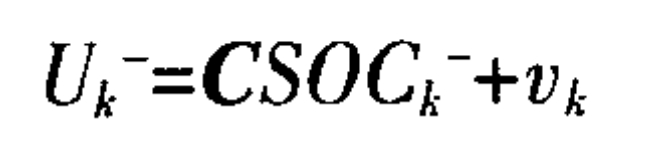
In the formula, Uk is the estimated value of the battery voltage state for the k-th estimated cycle; C is the relationship matrix between battery voltage and SOC; To observe the noise of the model.
The variance of SOC estimation for the k-th estimation period can be expressed as:
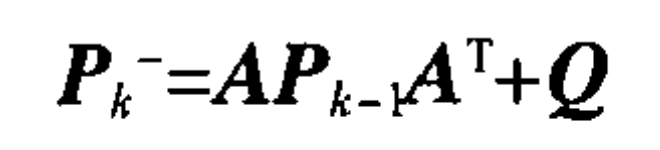
Where is the variance of noise in the process model.
Then the Kalman filter gain can be expressed as:
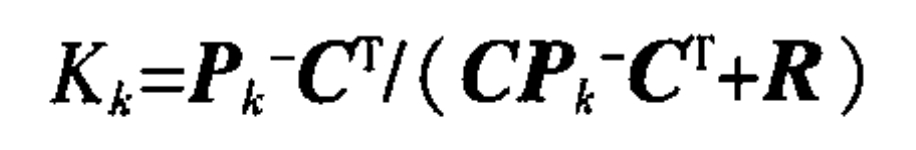
In the equation: is the variance of the noise in the observation model.
Correcting SOC can result in:
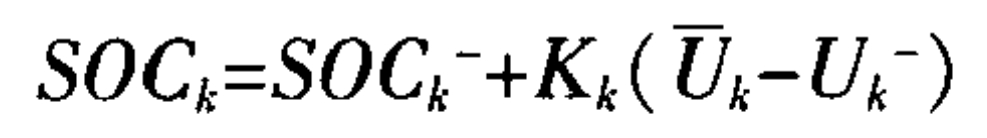
In the equation, SOCk is the estimated SOC state value for the k-th estimation period; Uk is the average voltage value of the k-th sampling window at the sampling point.
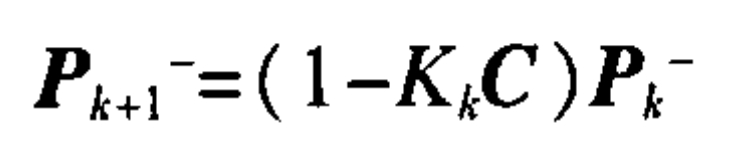
The estimated variance for updating SOC is:
3.3 Sampling analysis and optimization
Synchronize the voltage and current of the battery cell using fs to obtain the initial sequence Uk1, Uk2,… Ukn for voltage sampling in the k-th sampling window, as well as the initial sequence ik1, ik2…, ikn for current sampling. The corresponding sampling time is tk1=tk1, tk2=tk1+1/fs, tkn=tk1+1/fs, and the average voltage and current at the k-th sampling window sampling point is:
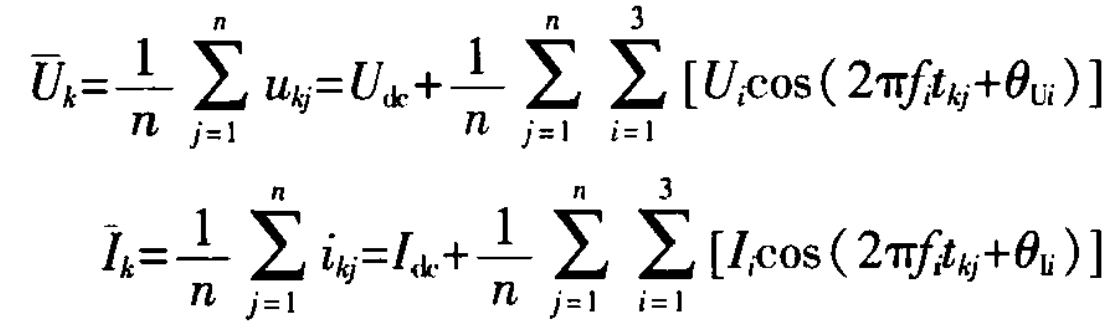
The physical meaning of Uk and Ik is that the voltage and current sampling sequences are averaged within the sampling window, and the resulting Uk and Ik are used as inputs for SOC estimation.
The selection of sampling frequency and sampling window will directly affect the measurement accuracy of the average voltage and current of battery cells, thereby affecting the estimation accuracy of SOC and affecting the subsequent protection and balance of the battery. Traditionally, increasing the sampling voltage and current frequency is believed to ensure the accuracy of SOC estimation, while hardware and software processing capabilities have limitations on the sampling frequency. How to select and optimize the sampling frequency has become a key issue. Below, we will discuss the frequency ranges of fs>2fi, fi<fs<2fi, and fs<fi. Among them, f1, f2, and f3 correspond to power frequency, double frequency, and switching frequency, respectively.
3.3.1 Frequency range l: fs > 2fi
According to the Nyquist sampling theorem, in order to prevent aliasing of the sampled signal, it is necessary to make fs greater than twice the highest frequency component of the measured signal to ensure good sampling accuracy and restore the waveform of the measured signal. When the sampling frequency meets fs>2fi, using fs to sample voltage and current signals with frequency fi can accurately restore voltage and current waveforms. But at this point, a higher sampling frequency is required, which will require higher processing power of hardware and software.
There is a high requirement for the processing ability of hardware and software.
3.3.2 Frequency range 2: fi<fs<2fi
Considering that in the estimation process of S0C, only the average value of the sampled current and voltage signals over a period of time is needed, without the need to accurately restore the voltage and current waveforms, the sampling frequency meeting the requirements of fi<fs<2fi also meets the requirements of S0C estimation. At this point, only a relatively low sampling frequency is required, and the requirement for hardware and software processing capability is lower than the frequency range 1.
3.3.3 Frequency range 3: fs < fi
Considering the periodicity of the signal, based on the basic principle of equivalent sampling, sampling can be carried out at a sampling frequency lower than the signal frequency at the cost of increasing acquisition time, and the original signal can be restored through restructuring. The commonly used equivalent sampling method at present is the random equivalent sampling method, which uses the trigger point as a time reference to sample, store, and reconstruct signals with rapidly changing periods. The key to the random equivalent sampling method is to ensure that there is no integer multiple relationship between the sampling rate and the frequency of the measured signal. The sampling points will appear on all waveforms of the measured signal with equal probability accumulated according to the time of each cycle, and the time interval between the trigger point and the next sampling clock is used, To determine the position of each sampling data in signal reconstruction. Considering that only the DC components of voltage and current are considered in SOC estimation, and there is no need to restore the waveform of the measured signal, the reconstruction process of random equivalent sampling method can be omitted. Only by selecting an appropriate sampling window and ensuring that/8 cannot be divided, all information of the measured signal can be obtained. In order to accurately control the sampling period, it is necessary to take the sampling period as an integer multiple of the controller clock period. Compared to the frequency range 1 and 2, the use of random equivalent sampling method significantly reduces the sampling frequency and requires lower hardware and software processing capabilities.
3.3.4 Selection of optimal sampling method
Based on sections 3.3.1-3.3.3, it can be concluded that when the sampling frequency and sampling window meet equation (12), Uk=Udc, Ik=Idc, i.e. the battery cell charge
The average value of voltage and current is equal to the actual DC component.
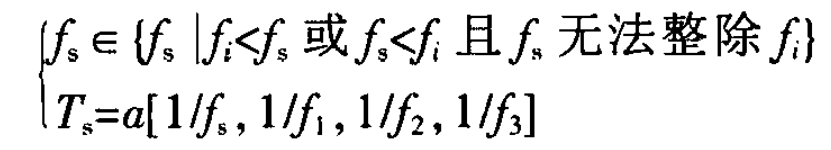
In the formula: [*] represents the operation of finding the least common multiple; α ∈ N+.
At this point, the accuracy of the SOC estimation method reaches the theoretical highest.
4. Experiments
| SOC estimation algorithm | Fs/Hz | 1500s SOC | Error/% |
| Ampere hour integral method | 1 | 0.8426 | 0.20216 |
| Ampere hour integral method | 10 | 0.8414 | 0.05946 |
| Ampere hour integral method | 16 | 0.8408 | 0.01189 |
| Ampere hour integral method | 100 | 0.8411 | 0.02378 |
| Extended Kalman Filter Algorithm | 1 | 0.8414 | 0.05946 |
| Extended Kalman Filter Algorithm | 10 | 0.8413 | 0.04757 |
| Extended Kalman Filter Algorithm | 16 | 0.8408 | 0.01189 |
| Extended Kalman Filter Algorithm | 100 | 0.8407 | 0.02378 |
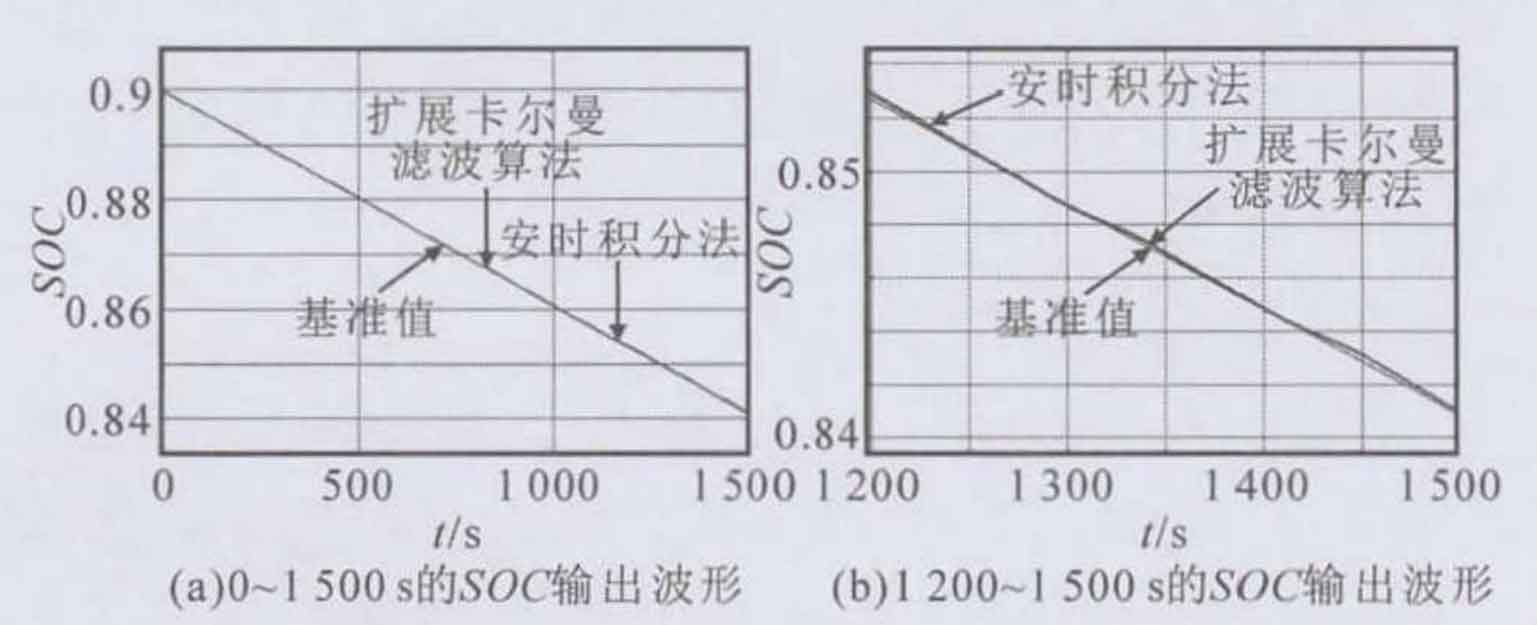
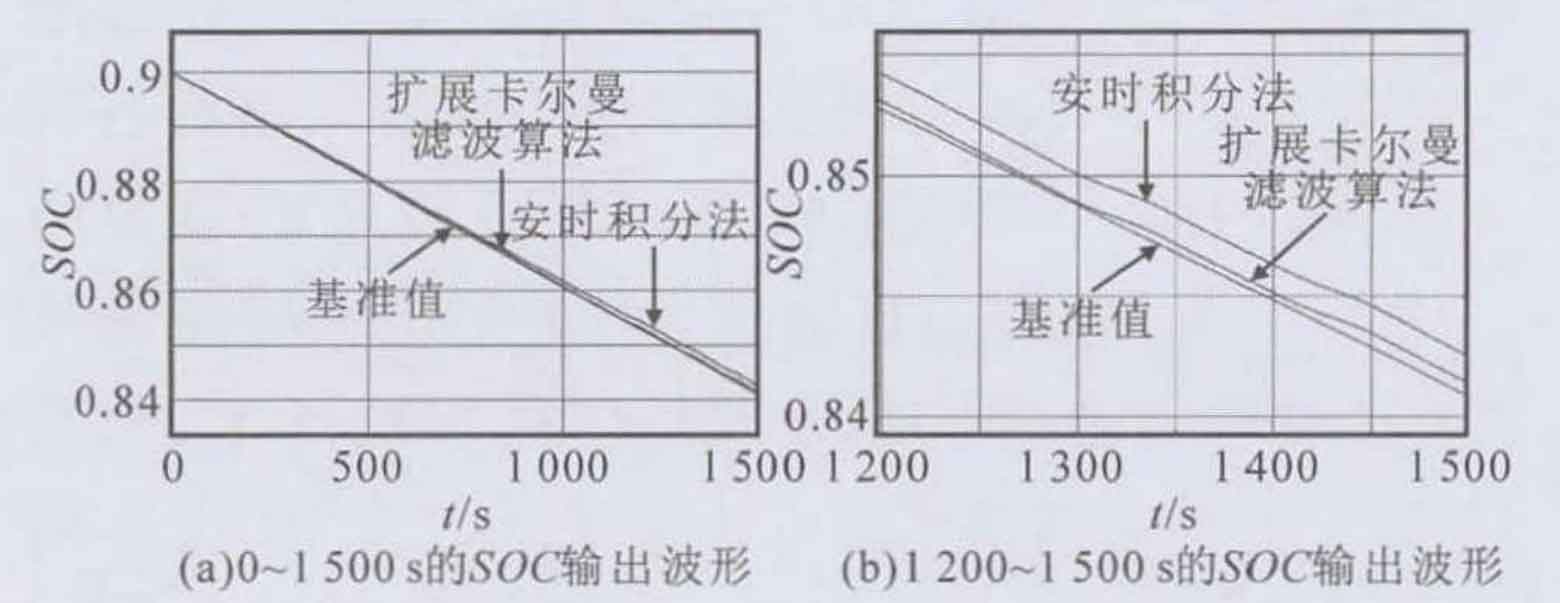
To verify the impact of different sampling rates on different SOC estimation methods, actual currents containing multiple frequency components were generated using the MMC experimental platform and tested, recorded, and analyzed. The experimental platform system architecture is shown in Figure 1. Considering the cases where/s is 1Hz, 10Hz, 16Hz, and 100Hz respectively, choose a sampling window size of ls, where only fs=16Hz satisfies equation (12). SOC estimation was performed using the ampere hour integration method and the extended Kalman filter algorithm at different sampling frequencies. The results were compared with the SOC reference value, and the error results are shown in Table 1. Among them, the initial value of SOC is 0.9, and the SOC reference value at t=1500s is 0.8409, measured using the ampere hour integration method at a sampling frequency of 20kHz. Figures 4 and 5 show the SOC output results of 0-1500s and l200-1500s at sampling frequencies of 1Hz and 16Hz, respectively.
5. Conclusion
By modeling the battery operating conditions of modular battery energy storage systems and analyzing SOC estimation methods, a sampling frequency optimization design method is proposed. The analysis and combined with measured data prove that different SOC estimation methods have different sensitivity to sampling frequency; The extended Kalman filtering algorithm is less sensitive to changes in sampling frequency, and its SOC estimation accuracy is higher than the ampere hour integration method at the same sampling frequency. In addition, the selection of sampling frequency has a certain impact on the accuracy of battery SOC estimation. Increasing the sampling frequency is beneficial for reducing SOC estimation errors, but increasing the sampling frequency will increase the hardware costs of BMS signal conditioning and sampling circuits, as well as the demand for processor computing power. In the measurement of voltage and current, the optimized sampling frequency design can ensure the accuracy of SOC estimation at low sampling rates, effectively reducing the requirements for BMS conditioning collection hardware circuits and processor computing power. The optimization design of sampling can provide certain guidance for the design and application of battery management.