
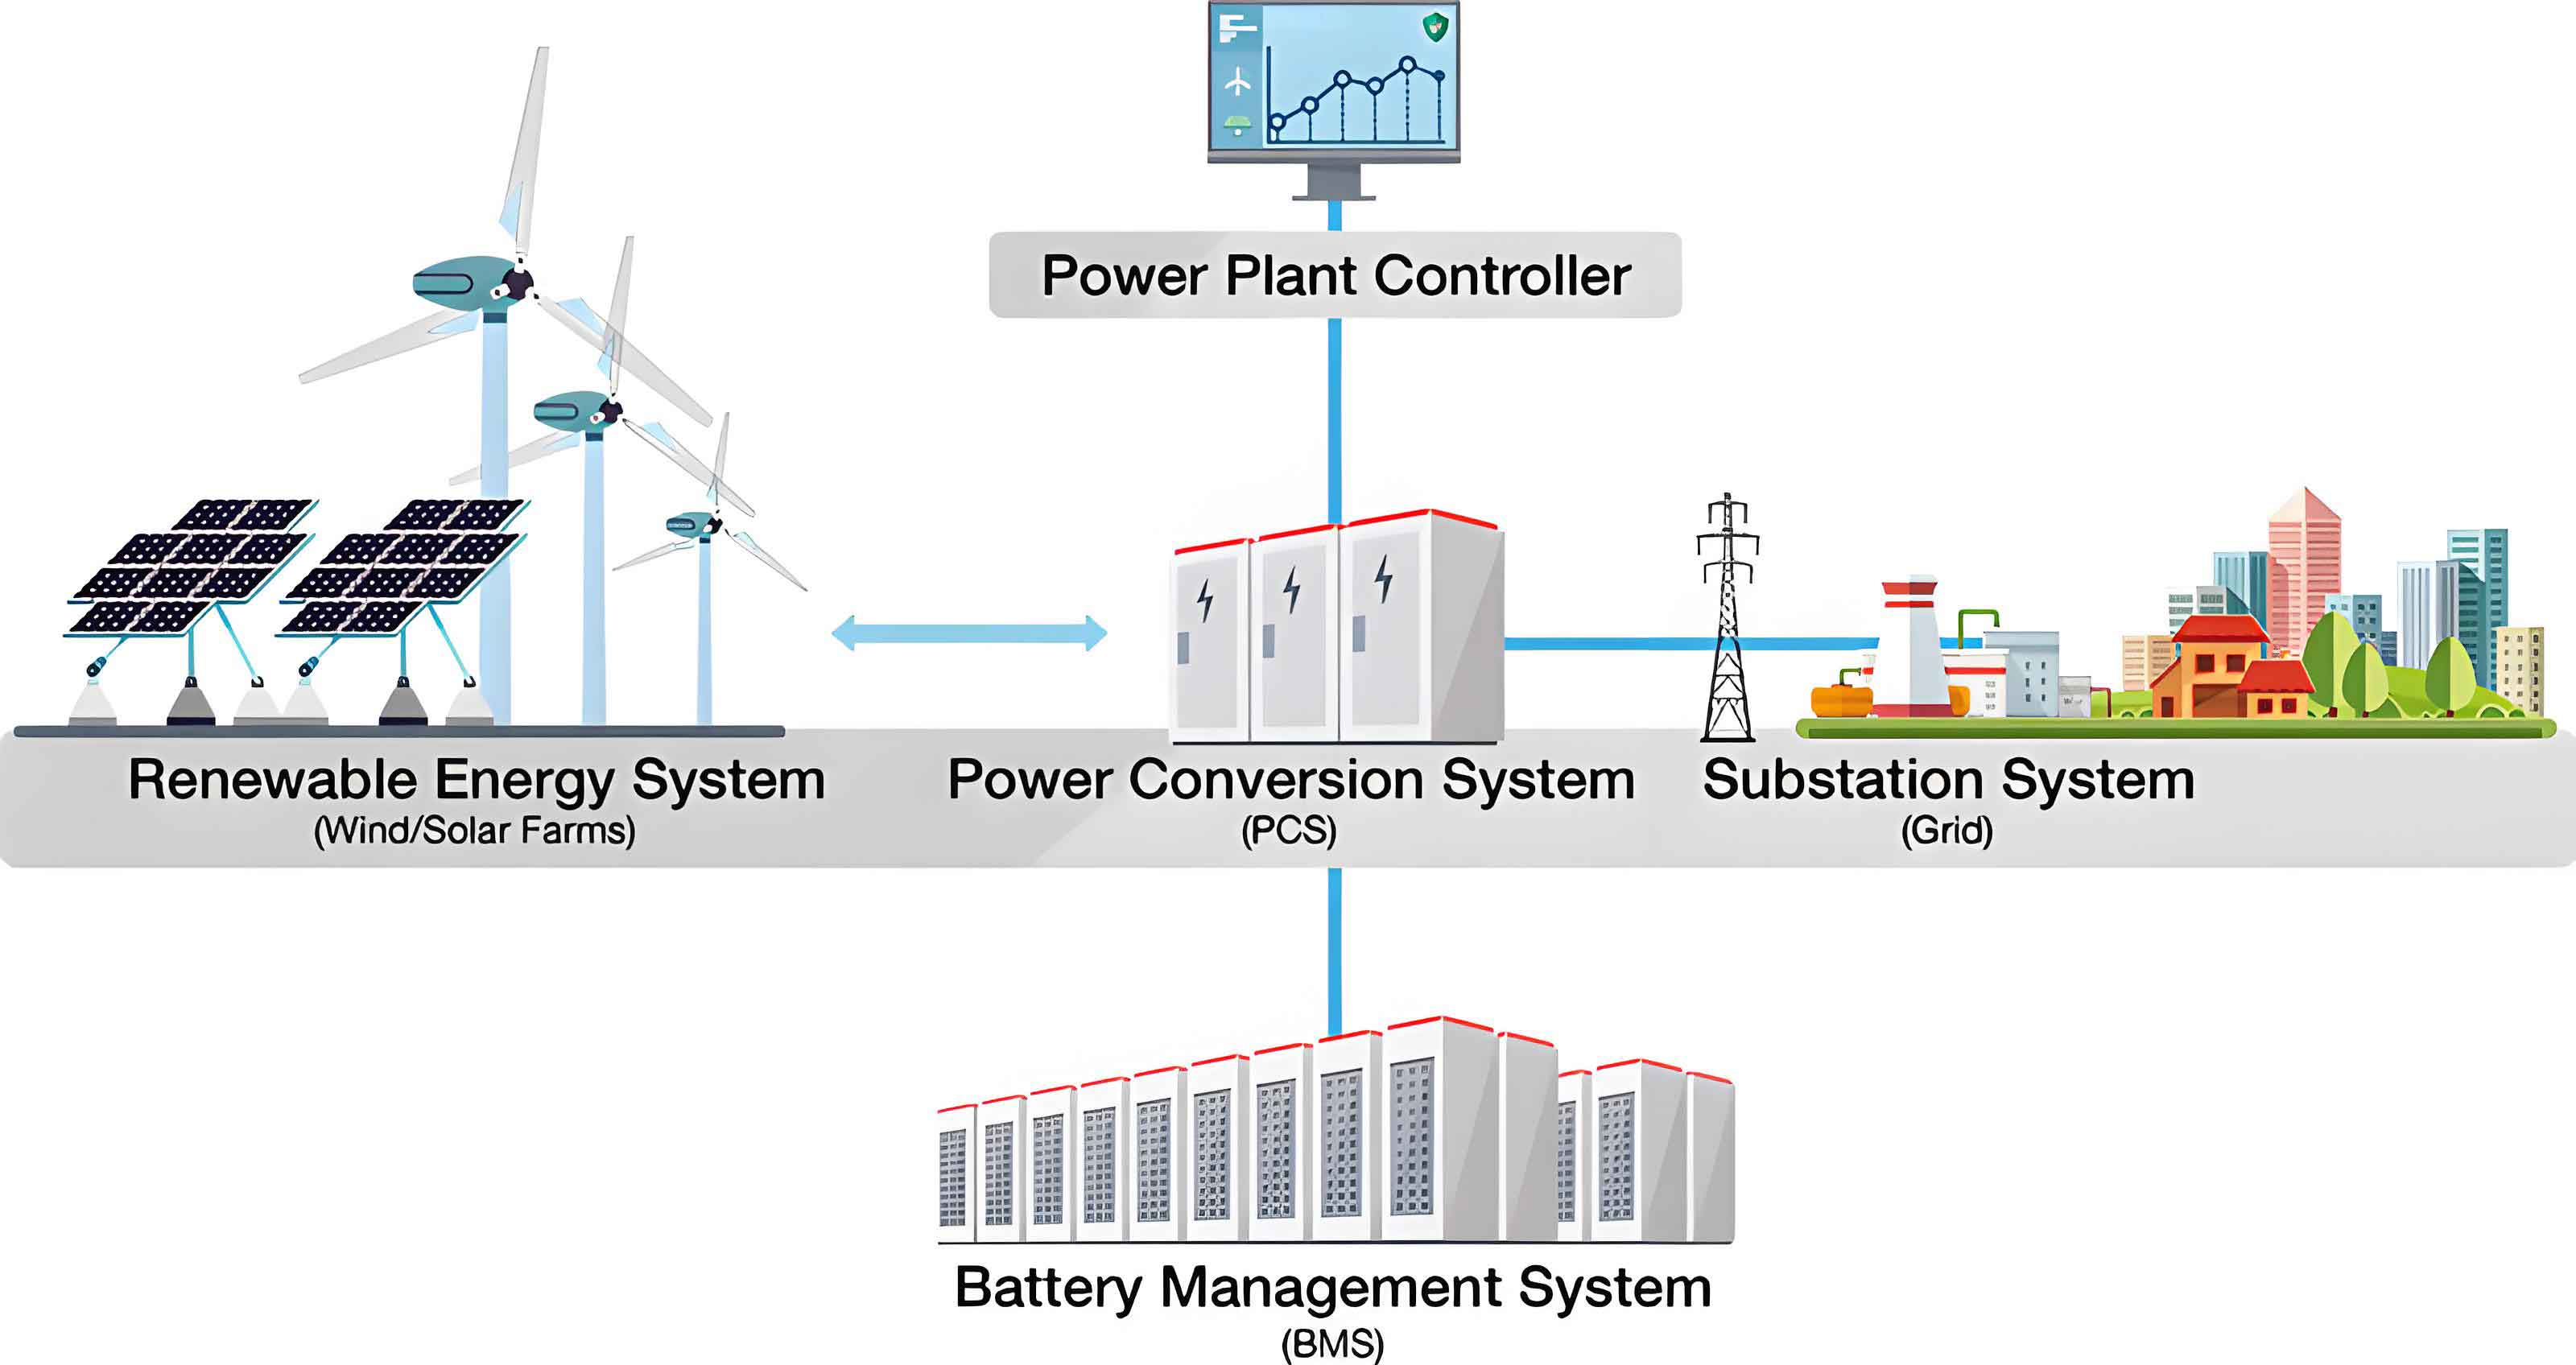
The transition towards a low-carbon energy system has propelled the widespread integration of renewable energy sources, particularly photovoltaic (PV) generation, at the user side. However, the inherent intermittency and uncertainty of PV output pose significant challenges to grid stability and power quality. The configuration of a Battery Energy Storage System (BESS) alongside PV generation presents a viable solution, enabling the temporal shift of energy, reduction of PV curtailment, and peak load shaving. For residential communities, where load patterns exhibit distinct peaks and troughs, the optimal sizing of a combined PV-BESS system is crucial to maximize economic benefits while enhancing grid friendliness. This study addresses this need by developing a comprehensive optimization framework that meticulously accounts for the dynamic degradation of the BESS, a factor often oversimplified in existing planning models.
The economic viability and effective service life of a BESS are intrinsically linked to its operational patterns, primarily influenced by the depth of discharge (DOD) and the number of charge-discharge cycles. Ignoring these factors can lead to significant overestimation of the system’s lifespan and net revenue. Therefore, we propose a refined dynamic battery life decay model. The relationship between the battery’s State of Health (SOH) and its cumulative life loss is first established using an improved curve-fitting technique, yielding a more accurate representation than common linear approximations. To enhance computational efficiency without sacrificing model fidelity, we apply a Self-Optimal Piecewise Linearization (SO-PWL) method. This method segments the non-linear degradation curve into linear sections while ensuring the segmented function closely adheres to the original curve, providing a balanced approach between accuracy and solving speed.
The dynamic loss of the BESS is characterized by two interconnected models: the SOH model and the life decay model. The SOH is defined as the ratio of current usable capacity to initial rated capacity. A battery is typically considered to have reached its end of service when its SOH degrades to 80%. The capacity fade over time can be expressed as a function of the life loss degree, $\Gamma_{loss}$:
$$SOH(t) = f(\Gamma_{loss}) = k_1 + k_3 \cdot e^{k_2 \Gamma_{loss}} + e^{k_4 \Gamma_{loss}}$$
where $k_1$, $k_2$, $k_3$, $k_4$ are fitting coefficients. The SO-PWL process discretizes this into linear segments for each operating interval $j$:
$$SOH(t) = a_j \Gamma_{loss}(t) + b_j$$
The life decay model quantifies $\Gamma_{loss}(t)$ based on operational stress. The cycle life of the battery, $N_{life}$, is highly dependent on the DOD:
$$
N_{life}(DOD) =
\begin{cases}
\alpha_0 \cdot e^{\alpha_1 DOD(t)} + \alpha_2 \cdot e^{\alpha_3 DOD(t)}, & DOD(t) > 0\\
+\infty, & DOD(t) = 0
\end{cases}
$$
Here, $\alpha_0$ to $\alpha_3$ are battery-specific fitting parameters. The incremental life loss in a time step is inversely proportional to the cycle life at the corresponding DOD. The SO-PWL model is applied to the function relating $\Gamma_{loss}$ to the State of Charge (SOC), which is linked to DOD ($DOD = 1 – SOC$), to efficiently determine the degradation incurred during each charge or discharge event. This integrated model allows for a precise, operation-dependent estimation of the BESS’s remaining useful life.
The optimal sizing model for the residential community PV-BESS system is formulated as a multi-objective optimization problem. The decision variables include the rated power and capacity of the BESS and the installation capacity of the PV system. The primary objective is to maximize the average annual net profit over the BESS’s lifetime, $f_1(x)$. This profit encompasses revenue from selling electricity (both from PV surplus and BESS arbitrage), minus the total costs, which include initial investment, operation and maintenance, and plus the residual value from battery recycling.
$$f_1(x) = \frac{C_E + C_{re} – f_{in} – f_{mt}}{N}$$
where $C_E$ is the total revenue from electricity sales, $C_{re}$ is the recycling revenue, $f_{in}$ is the initial investment cost, $f_{mt}$ is the maintenance cost, and $N$ is the service life in years. The secondary objective is to minimize the load peak-valley difference, $f_2(x)$, to promote grid stability:
$$f_2(x) = \max(P_{load}(t) – P_{dis}(t)) – \min(P_{load}(t) + P_{ch}^{grid}(t))$$
The optimization is subject to a set of practical constraints, including power balance, BESS charge/discharge power limits, SOC operating boundaries, and installation capacity limits based on available space.
To ensure the input data reflects realistic annual operation, typical daily profiles for PV generation and community load are constructed using weighting methods. PV output profiles for different seasons and weather conditions (sunny/cloudy) are aggregated using the Analytic Hierarchy Process (AHP). Similarly, load profiles for summer/winter and weekday/weekend are combined using the Entropy Weight Method. This results in comprehensive, weighted typical daily profiles that form the basis for the annual simulation. Key system parameters and time-of-use electricity tariffs are summarized in the following tables.
| Parameter | Value | Description |
|---|---|---|
| $k_p$ | 1351 | Unit power cost of BESS ($/kW) |
| $k_s$ | 1500 | Unit capacity cost of BESS ($/kWh) |
| $k_{PV}$ | 4000 | Unit installation cost of PV ($/kW) |
| $\mu_{ch}$, $\mu_{dis}$ | 0.9 | Charge/Discharge efficiency |
| $SOC_{min}$, $SOC_{max}$ | 0.3, 0.9 | Minimum and maximum SOC limits |
| $\gamma$ | 0.09 | Battery recycling coefficient |
| Period | Time | Grid Sale Price ($/kWh) | Grid Purchase Price ($/kWh) |
|---|---|---|---|
| Peak | 11:00-13:00, 17:00-22:00 | 0.80 | 0.60 |
| Flat | 07:00-11:00, 13:00-17:00 | 0.50 | 0.40 |
| Valley | 22:00-07:00 | 0.30 | 0.25 |
The multi-objective particle swarm optimization (MOPSO) algorithm is employed to solve the problem, yielding a Pareto front of optimal solutions. We analyze three distinct operational scenarios to validate the proposed model:
- Scenario 1: BESS is configured without considering dynamic life decay. It only charges from PV and discharges to meet peak loads.
- Scenario 2: BESS is configured WITH the dynamic life decay model. Operation is the same as Scenario 1 (off-grid arbitrage).
- Scenario 3: BESS is configured WITH the dynamic life decay model and operates in a grid-connected mode, performing “low-charge, high-discharge” arbitrage using grid electricity during valley periods.
The optimization results for these scenarios are presented below:
| Configuration Result | Scenario 1 | Scenario 2 | Scenario 3 |
|---|---|---|---|
| Annual Net Profit ($10k) | 82.58 | 118.20 | 126.31 |
| BESS Capacity (kWh) | 1443.00 | 1209.00 | 1118.16 |
| BESS Power (kW) | 129.27 | 178.48 | 165.17 |
| PV Capacity (kW) | 212.40 | 246.32 | 260.27 |
| System Config. Cost ($10k) | 318.9 | 304.0 | 295.2 |
| PV Annual Revenue ($10k) | 1.83 | 1.80 | 9.80 |
| Max Service Life (years) | 24.60 | 14.40 | 13.92 |
| Peak-Valley Difference (kW) | 285.88 | 263.44 | 177.02 |
The results lead to several key conclusions. First, comparing Scenario 1 and Scenario 2 demonstrates the critical importance of the dynamic battery life decay model. Although the model predicts a shorter, more realistic service life (14.4 vs. 24.6 years), it guides the optimization towards a more cost-effective system configuration with a lower initial investment and a significantly higher annual net profit. This underscores that ignoring battery degradation leads to economically suboptimal and technically overestimated designs.
Second, the comparison between Scenario 2 and Scenario 3 highlights the advantage of grid-connected operation for the BESS. While the service life slightly decreases due to more intensive cycling, Scenario 3 achieves the highest economic return. This is primarily due to two factors: 1) the BESS can perform more profitable energy arbitrage by buying cheap grid power at night and selling it during peak hours, and 2) a larger PV system can be installed because the BESS does not solely rely on PV for charging, leading to substantially higher revenue from PV surplus fed into the grid.
Third, from the perspective of grid support, the grid-connected Battery Energy Storage System in Scenario 3 delivers the best peak-shaving performance, reducing the original load peak-valley difference by 58.64%. The BESS effectively charges during late-night valley periods, “filling the valley,” and discharges during evening peaks, “shaving the peak,” resulting in a much flatter net load profile for the grid.
In summary, this study presents a holistic framework for the optimal sizing of a residential community PV-BESS system. The proposed dynamic battery life decay model, incorporating SO-PWL for efficient computation, provides a realistic assessment of the BESS’s economic lifespan. The multi-objective optimization reveals a clear trade-off: if the primary goal is maximum PV consumption within the community, an off-grid configured BESS (Scenario 2) is preferable. However, if the goals are to maximize overall economic benefit and to provide the greatest grid support through peak shaving, a grid-connected Battery Energy Storage System (Scenario 3) is the optimal choice. This model offers valuable insights and a practical tool for planners and investors in the distributed energy resource sector.