
The accelerating pace of urbanization and industrialization has intensified global challenges related to energy scarcity and environmental pollution. In this context, the focus has decisively shifted towards renewable energy sources. Solar energy, as a prominent and inexhaustible resource, has witnessed extensive development, with photovoltaic (PV) power generation experiencing rapid growth worldwide. Among the various system configurations, the string solar inverter topology has gained significant traction due to its modular design, ease of installation and maintenance, and its ability to allow individual PV strings to operate at their Maximum Power Point (MPP). As the cost of components for string solar inverters continues to decline, their application in PV power plants is poised for substantial expansion. Therefore, in-depth research into string solar inverters holds considerable importance for the further advancement and dissemination of PV technology. In this article, I will present my detailed modeling and analysis of a string solar inverter system, focusing on the front-end power conversion and control strategies.
Architectural and Topological Considerations for Solar Inverters
The fundamental role of a solar inverter is to convert the direct current (DC) electricity generated by PV modules into grid-compliant alternating current (AC). The stability, efficiency, and safety of the entire grid-connected system are heavily dependent on the performance of the solar inverter. Based on the presence of galvanic isolation, grid-tied solar inverters can be categorized into isolated and non-isolated types. For my model, I selected a two-stage, non-isolated topology. This structure features a front-end DC/DC conversion stage followed by a rear-end DC/AC inversion stage. Compared to single-stage structures, the two-stage configuration offers a simpler control system. Crucially, the control for the front-end stage (MPPT) and the rear-end stage (grid current synchronization) are decoupled, minimizing mutual interference and enhancing overall system performance and efficiency.
The front-end stage, responsible for boosting the variable DC voltage from the PV array and performing MPPT, commonly utilizes a Boost converter. I chose the Boost topology for its advantages of continuous input current, simple drive circuitry, high conversion efficiency, and straightforward structure which facilitates overall system design. The basic operation of the Boost converter is governed by the duty cycle (D) of its switch. The relationship between the input voltage (Vpv) and output voltage (Vdc) is given by:
$$V_{dc} = \frac{V_{pv}}{1 – D}$$
This equation is central to the MPPT control, as adjusting D effectively changes the operating point of the PV array seen by the converter. For the rear-end stage, given the targeted power rating of 1.2 kW for my model, I employed a simple L-type filter for the output, which provides a good balance between filtering performance and cost for this power level. The overall control block diagram for the string solar inverter system I implemented is illustrated below. The MPPT controller acts on the front-end Boost converter, while a separate current controller manages the grid synchronization and power injection via the full-bridge inverter.
Mathematical Modeling of the Photovoltaic Array
The output characteristics of a PV array are nonlinear and significantly influenced by environmental factors such as irradiance (S) and cell temperature (T). Accurately modeling this behavior is the foundation for any effective simulation. Rather than using complex physical models involving many difficult-to-measure parameters, I adopted an engineering mathematical model based on key datasheet parameters under Standard Test Conditions (STC: Sref = 1000 W/m², Tref = 25°C). These parameters are: open-circuit voltage (UOC), short-circuit current (ISC), voltage at maximum power (Um), and current at maximum power (Im).
The output current Ipv of the PV array as a function of its output voltage Upv is modeled by:
$$
I_{pv} = I_{SC} \left[1 – C_1 \left( \exp\left(\frac{U_{pv}}{C_2 U_{OC}}\right) – 1 \right) \right]
$$
where the coefficients C1 and C2 are calculated from the MPP data:
$$
C_1 = \left(1 – \frac{I_m}{I_{SC}}\right) \exp\left(-\frac{U_m}{C_2 U_{OC}}\right)
$$
$$
C_2 = \left(\frac{U_m}{U_{OC}} – 1\right) \left[ \ln\left(1 – \frac{I_m}{I_{SC}}\right) \right]^{-1}
$$
To account for varying environmental conditions, the key parameters are adjusted from their STC values. Defining $\Delta S = S/S_{ref} – 1$ and $\Delta T = T – T_{ref}$, the corrected parameters become:
| Parameter | Correction Formula | Notes |
|---|---|---|
| Open-Circuit Voltage | $U_{OC}’ = U_{OC} (1 – c \Delta T) (1 + b \ln(1+\Delta S))$ | c=0.0028/°C, b=0.5 |
| Short-Circuit Current | $I_{SC}’ = I_{SC} \frac{S}{S_{ref}} (1 + a \Delta T)$ | a=0.0025/°C |
| MPP Voltage | $U_{m}’ = U_{m} (1 – c \Delta T) (1 + b \ln(1+\Delta S))$ | |
| MPP Current | $I_{m}’ = I_{m} \frac{S}{S_{ref}} (1 + a \Delta T)$ |
For my simulation, I configured a string of four 315W modules, leading to approximate STC parameters of UOC = 320 V, ISC = 5.2 A, Um = 254.84 V, and Im = 4.95 A, yielding a nominal power of about 1261.5 W. Implementing this model allowed me to generate the characteristic I-U and P-U curves. Analysis shows that increasing temperature primarily reduces the open-circuit voltage and slightly lowers peak power, while increasing irradiance significantly raises the short-circuit current and the maximum available power. This validated model serves as a reliable source for the subsequent power electronics simulation.
Implementing Maximum Power Point Tracking Control
Given the nonlinear P-U characteristic of the PV array, a dedicated control algorithm is essential to continuously locate and operate at the MPP, maximizing the energy yield from the solar inverters. Among various MPPT methods, such as Constant Voltage Tracking (CVT) and Incremental Conductance (InC), I implemented an improved Perturb and Observe (P&O) algorithm due to its effectiveness and relative simplicity in digital implementation.
The core principle of the classic P&O method is to perturb the operating voltage of the array and observe the change in output power. Let P(k) and U(k) be the power and voltage at sample instant k. The algorithm introduces a perturbation $\Delta U$:
1. Measure P(k) and U(k).
2. Apply a voltage perturbation: U(k+1) = U(k) $\pm$ $\Delta U$.
3. Measure the new power P(k+1).
4. Calculate $\Delta P = P(k+1) – P(k)$.
5. If $\Delta P > 0$, the perturbation moved the operating point towards the MPP. Keep the same perturbation direction for the next step.
6. If $\Delta P < 0$, the perturbation moved the operating point away from the MPP. Reverse the perturbation direction for the next step.
The improved version I used directly manipulates the voltage reference for the Boost converter’s control loop, making it more integrated with the power stage control. The decision logic is summarized in the following table, where Uref is the voltage reference sent to the controller.
| Condition ($\Delta P$) | Previous Perturbation | Implied Position Relative to MPP | Action on Uref |
|---|---|---|---|
| > 0 | Increase | Was left of MPP, now closer | Continue to Increase |
| > 0 | Decrease | Was right of MPP, now closer | Continue to Decrease |
| < 0 | Increase | Was left of MPP, now past it (right) | Change to Decrease |
| < 0 | Decrease | Was right of MPP, now past it (left) | Change to Increase |
This algorithm was encapsulated into a functional block that processes the measured PV voltage and current to produce a dynamic voltage reference, ensuring the Boost converter adjusts its duty cycle to draw maximum power from the array. The critical trade-off in tuning this algorithm lies in the step size $\Delta U$: a larger step enables faster tracking but causes greater steady-state oscillation around the MPP, while a smaller step reduces oscillation but slows down the tracking response to changing irradiance.
Simulation Model Development and Integration
I constructed the complete simulation model based on the MATLAB/Simulink environment. The model integrates the PV array model, the Boost converter with its associated inductor and capacitors, the MPPT controller block, the full-bridge inverter, and the grid interface with an L-filter. The parameters for the power stage were carefully selected. For the Boost converter: Inductor L = 2 mH, Input capacitor C1 = 1000 µF, Output capacitor C2 = 300 µF. The load (representing the DC link for the inverter) was set to 200 Ω. The inverter switching frequency and the MPPT sampling rate were chosen to ensure both dynamic performance and simulation efficiency.
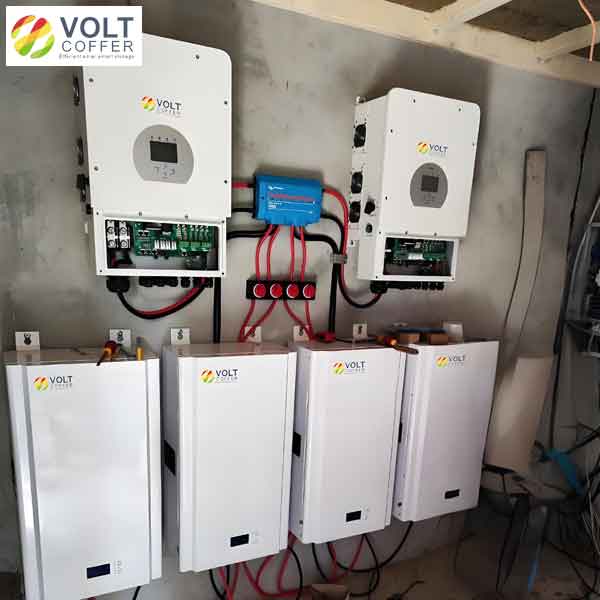
This image illustrates a modern hybrid solar inverter system, showcasing the type of power electronics equipment that forms the practical basis for the simulation models discussed. The development and testing of control algorithms for such solar inverters heavily rely on accurate simulation models before hardware implementation. The integration of the MPPT algorithm with the Boost converter is a critical aspect of the front-end design for efficient solar inverters. In my Simulink model, the MPPT block outputs a reference voltage which is compared to the actual PV voltage. The error is fed into a PI controller, which generates the duty cycle for the Pulse-Width Modulation (PWM) of the Boost converter’s switch. This closed-loop operation forces the PV array to operate at the voltage corresponding to the maximum power point as determined by the algorithm.
Simulation Results and Performance Analysis
To validate the performance of the MPPT-controlled front-end of my solar inverter model, I conducted several simulation tests. First, under constant STC conditions (S=1000 W/m², T=25°C), the system was simulated for 1 second. The PV output power stabilized rapidly at approximately 1200 W. The discrepancy from the calculated nominal 1261.5 W is attributable to minor losses in the converter and the very small steady-state oscillation inherent to the P&O method. The tracking was stable with negligible power fluctuation, confirming the effectiveness of the improved algorithm in steady state.
A more rigorous dynamic test was performed to evaluate the tracker’s response to environmental changes. The simulation was run for 6 seconds with the following profile:
– t=0-2s: S=1000 W/m², T=25°C
– t=2-4s: S=600 W/m², T=15°C
– t=4-6s: S=1200 W/m², T=35°C
The results were insightful. Upon the step decrease in irradiance at t=2s, the tracker successfully relocated the new, lower MPP. The convergence time was observable but within an acceptable range. The concurrent temperature drop had a minor compensating effect on voltage, but the dominant factor was the irradiance change. More notably, at t=4s, when irradiance increased significantly, the tracker converged to the new, higher MPP more quickly. This asymmetric performance—faster tracking for increasing irradiance—is a known characteristic of the P&O method and is generally acceptable as cloud-uncovering events (irradiance increase) are more common and beneficial to track rapidly. The final stage also demonstrated the expected slight reduction in peak power due to the higher cell temperature, even under higher irradiance.
The overall output of the solar inverter model, including the rear-end stage using a bipolar SPWM technique, was also verified. The A-phase voltage and current waveforms were sinusoidal, in phase with each other (for unity power factor operation), and of the grid frequency, confirming that the front-end DC/DC stage provided a stable DC link voltage, enabling proper inversion and synchronization by the rear-end controller.
Conclusion and Perspectives
In this work, I have presented a detailed modeling and analysis framework for a two-stage string solar inverter. The process began with the development of an engineering-based PV array model that accurately reflects the influence of irradiance and temperature on output characteristics. The core of the front-end control was the implementation of an improved Perturb and Observe MPPT algorithm, integrated with a Boost converter topology. Simulation results demonstrated that this configuration provides stable, precise, and acceptably fast maximum power point tracking under both steady-state and dynamically changing environmental conditions, which is essential for the high efficiency of modern solar inverters. The complete system simulation validated that the front-end design provides a suitable stable DC source for the grid-connected inverter stage.
The model confirms the viability and performance of the chosen topology and control strategy for string solar inverters in the kilowatt range. However, the simulation also highlights an area for potential improvement: the tracking speed, particularly following a sudden drop in irradiance, could be enhanced. Future research could focus on adaptive step-size P&O algorithms or hybrid methods combining the simplicity of P&O with the faster convergence of methods like Incremental Conductance under specific conditions. Furthermore, integrating more advanced grid-support functions and fault ride-through capabilities into the model would be a valuable extension for studying the broader grid integration challenges of distributed solar inverters.