
With the large-scale development of wind power and the continuous improvement of users’ living standards, the consumption problems caused by the randomness, volatility, and anti peak characteristics of wind power have constrained the development of wind power. At the same time, users have put forward higher demands for comfort and economy in electricity consumption. The hybrid energy storage system utilizes the complementarity and rapid adjustment performance between different energy storage devices to effectively address the aforementioned issues and challenges. Therefore, how to optimize the capacity configuration of hybrid energy storage systems while meeting the needs of wind power consumption and user electricity consumption has become a hot topic of scholars’ attention and research.
In terms of capacity allocation for energy storage systems considering wind power demand, a hybrid energy storage system capacity optimization configuration model is established to address the serious problem of wind abandonment caused by the fluctuation of renewable energy output; Based on the distributed robust optimization method, the capacity allocation problem of wind farm energy storage systems considering wind power uncertainty and wind abandonment rate constraints was studied. In addition, some scholars have established economic optimization models for hybrid energy storage systems based on the consideration of suppressing fluctuations. A hybrid energy storage configuration method considering confidence level is proposed to address the issue of high cost of energy storage to mitigate wind power fluctuations, effectively reducing capacity and power; Based on the characteristics of energy storage batteries, establish a capacity configuration model for double-layer energy storage systems, while taking into account the economy and reliability of the energy storage system; Establish a multi-objective optimization model for energy storage with the optimization objectives of total system cost, net energy storage revenue, etc. to reduce wind power fluctuations.
In terms of capacity configuration of energy storage systems considering user needs, a flexible load response model is constructed to propose a contract strategy of prioritizing the transfer of flexible loads from peak hours to peak photovoltaic output periods, thereby effectively reducing energy storage capacity configuration and user electricity purchase costs; Based on the user side two-part electricity pricing system, a multi scenario energy storage configuration decision-making method is proposed to meet the personalized needs of users; On the basis of considering the economic needs of multiple types of users, calculate the capacity of the energy storage system and use the Analytic Hierarchy Process to evaluate the configuration results; Establish a household energy management system model with the goal of minimizing daily electricity bills for users, and use improved artificial bee colony algorithm and particle swarm algorithm to solve the optimal energy storage capacity configuration.
The above research indicates that energy storage is an important solution to reduce wind abandonment and promote consumption, as well as a feasible option to improve the reliability of user electricity consumption and ensure low-cost electricity consumption. However, currently there are few studies on optimizing the capacity configuration of hybrid energy storage systems that consider both consumption and user needs, with most of them considering unilateral demand. Propose a hybrid energy storage capacity configuration method that includes gravity potential energy storage, batteries, and supercapacitors based on user electricity demand and wind and solar power generation situation, but does not consider the consumption of clean energy; A method for energy storage configuration under time-of-use electricity prices is proposed to address the issue of new energy consumption, but only battery energy storage is considered.
Therefore, this article proposes a hybrid energy storage system capacity configuration method that considers the bidirectional needs of wind power merchants and users. Firstly, starting from the user side demand response characteristics, a flexible load model is constructed; Secondly, establish a hybrid energy storage system composed of batteries and supercapacitors, and propose a hybrid energy storage charging and discharging strategy; Once again, a capacity optimization model is constructed with the objective functions of the lowest cost, lowest wind abandonment rate, and highest electricity satisfaction of the hybrid energy storage system, and solved using the multi-objective particle swarm optimization (MOPSO) algorithm; Finally, in order to verify the effectiveness of the model in this paper, case analysis, result analysis, sensitivity analysis, and method comparison analysis were conducted. The simulation results show that, after meeting the needs of wind power companies, energy storage companies, and users, the hybrid energy storage system can achieve optimal economic performance with a smaller capacity of the energy storage system. It plays an important role in reducing wind power abandonment, promoting consumption, improving user comfort and economy, and reducing the cost of the hybrid energy storage system.
1.Hybrid energy storage system structure
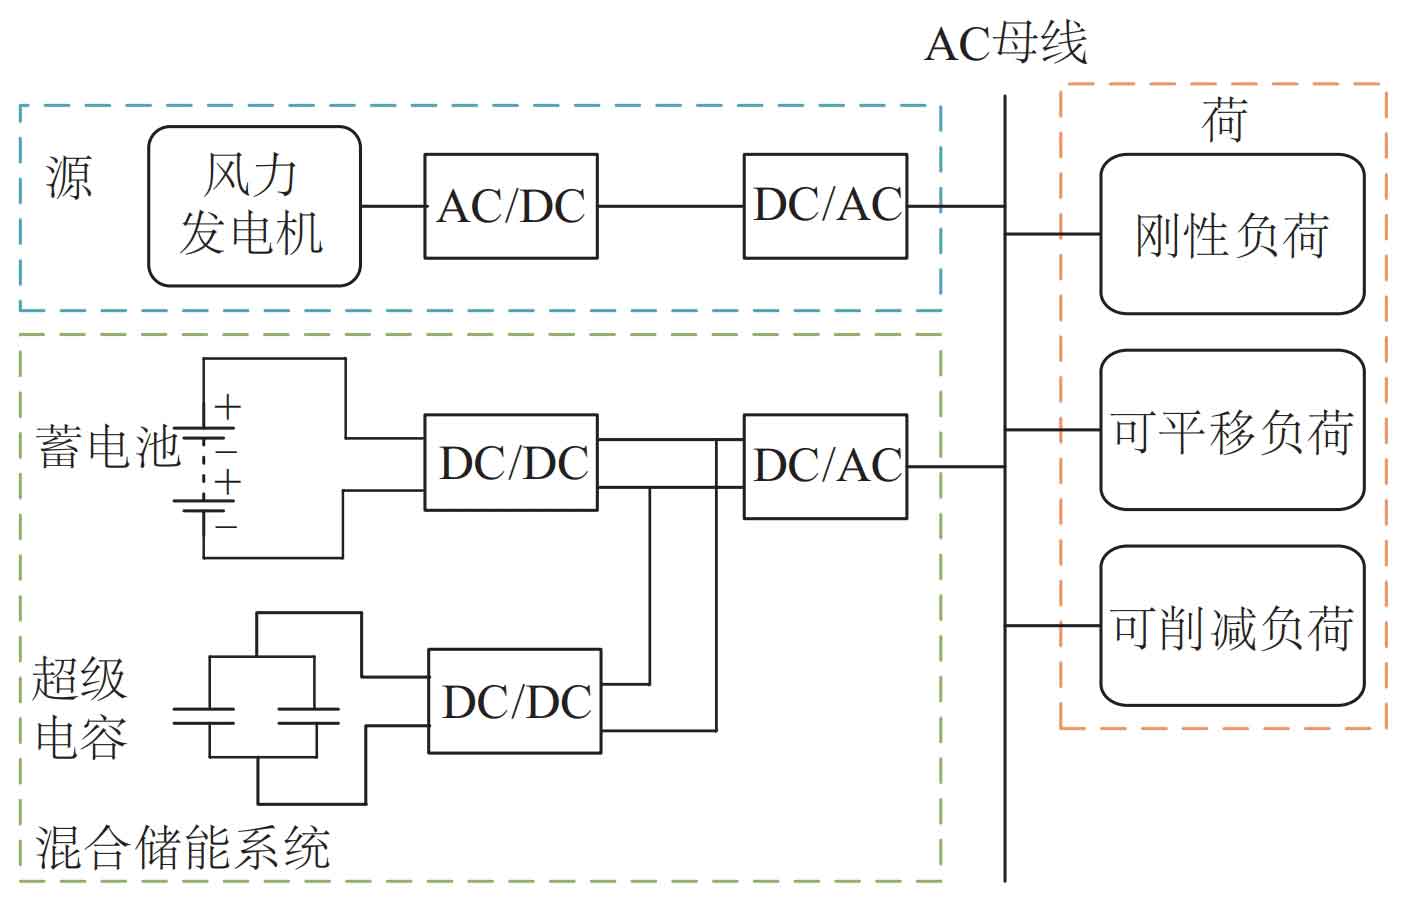
The hybrid energy storage system is mainly composed of batteries and supercapacitors with complementary characteristics. By considering the needs of the generation side and the user side, the energy storage capacity is optimized to achieve the goal of minimizing system costs. Figure 1 shows the topological structure of a source charge hybrid energy storage system. In the system, wind power is the main power source, and wind power merchants hope to improve wind power utilization rate, promote wind power consumption, and promote positive energy flow through good energy storage characteristics and capacity configuration; Users are the main consumers who hope to fully utilize the response characteristics of transferable and interruptible loads based on their own characteristics. While meeting electricity demand, they can achieve peak shaving and valley filling to reduce electricity purchase costs and quickly reflect the value of reverse feedback; Under the support of advanced technology, hybrid energy storage entities can maintain bidirectional flow of information, thereby more agile response to the needs of wind power merchants and users.
2.Basic model construction
2.1 User demand response model
To fully tap into the potential of user demand response, first establish mathematical models for various flexible loads, including translatable loads and reducible loads. By shifting and reducing the load, the user load curve is closer to the wind power output curve, thereby improving the power supply reliability of wind power generation and reducing the capacity and charging and discharging times of hybrid energy storage system configuration.
2.1.1 Translatable load
Translatable load refers to flexible loads with variable operating time and constant total electricity consumption, such as hanging ironing machines, drying machines, etc. In the demand response process, to ensure the comfort of users’ electricity consumption, the translatable load translation time period needs to be set within an acceptable range, namely [tsh -, tsh+]. When the load shifts to τ To ensure the continuity of translatable loads within the translation interval of the starting time, the condition of equation (1) needs to be met.
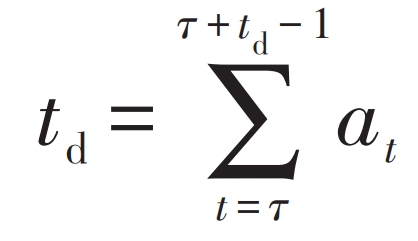
In the formula: td – duration of translatable load, h; At -0-1 state variable, at=1 indicates that the load has been shifted at time t, otherwise it indicates that it has not been shifted.
2.1.2 Can reduce load
Reduced load refers to flexible loads with interruptible operating time and adjustable electricity consumption, such as the number of lights used and the operating intensity of air conditioning loads. The load power PL cut after time t reduction is:
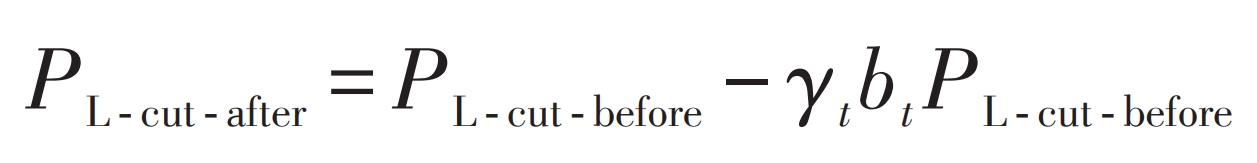
In the formula: PL cut before – load power before time t reduction, kW; γ T – Load reduction coefficient, taken as 0.7; Bt – The 0-1 state variable that determines whether the load has been reduced at time t, where bt=1 indicates that the load has been reduced at time t.
2.2 Hybrid Energy Storage Basic Model
2.2.1 Basic model of battery
The rated capacity Eb of the battery pack can be calculated according to equation (3), and the minimum capacity Ebmin can be calculated according to equation (4). The battery is usually discharged at a rate of 10C, and the rated output power Pb of the battery pack is shown in equation (5).
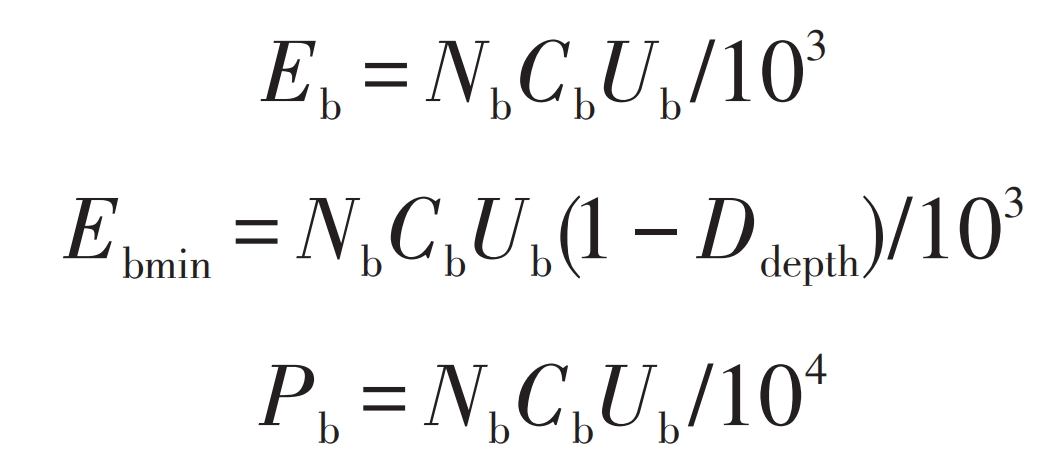
In the formula: Nb – Number of batteries; Cb, Ub – rated capacity and rated voltage of each battery, Ah, V; Ddepth – maximum discharge depth.
2.2.2 Basic model of supercapacitors
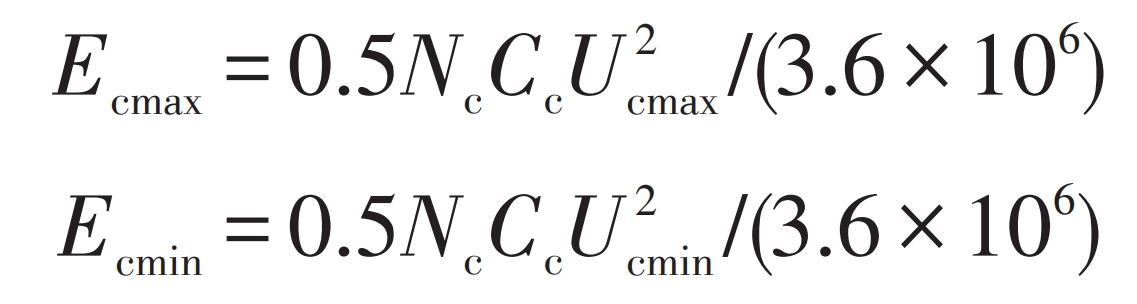
Assuming that the capacitance of each supercapacitor is Cc (F), and the voltage Uc (V) fluctuates between Ucmax and Ucmin, according to the energy formula E=0.5CU2/3.6 × 106, then the maximum capacity Ecmax (kWh) and minimum capacity Ecmin (kWh) of the supercapacitor are:
The maximum working current of a single supercapacitor is Icmax, then the maximum output power Pcmax of the supercapacitor is:
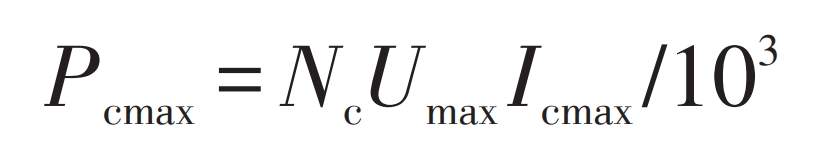
In the formula: Nc – Number of supercapacitors.
2.3 Calculation Model for Load Shortage Rate
The load power shortage rate flpsp is the ratio of load power shortage Ploss to load demand PL, and is also an important indicator of power supply reliability. Its calculation formula is:
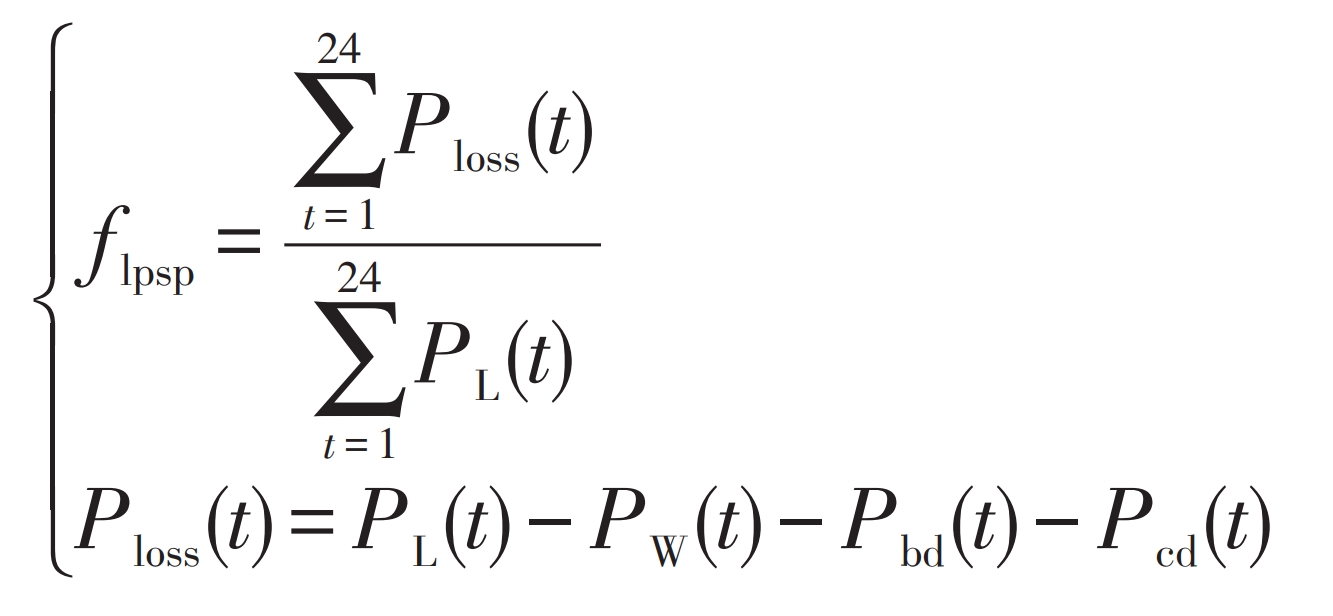
In the formula: PW (t) – Wind power generation power at time t, kW; PL (t) – Load power at time t, kW; Pbd (t), Pcd (t) – The discharge power of the battery and supercapacitor at time t, in kW.
3.Charging and discharging strategies for hybrid energy storage systems
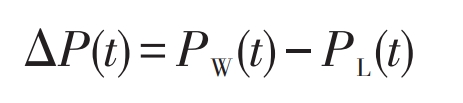
To ensure the normal use of electricity by users, hybrid energy storage systems can propose charging and discharging strategies based on the unbalanced power caused by the difference between output wind power and load demand. Unbalanced power Δ The calculation formula for P is:
Batteries and supercapacitors have different characteristics. Supercapacitors have high power density and transient energy release, but they do not have sustainability; The battery has a low power density, but a high energy density and durability. Generally speaking, the maximum power Pcmax of a supercapacitor is greater than the rated power Pb of a battery. Therefore, the battery only charges and discharges at its rated power when the unbalanced power is greater than or equal to its rated power, thereby optimizing the working state of the energy storage system and extending its service life.
1) When Δ When P>0, the wind power generation meets the load demand and the hybrid energy storage system is charged.
When Δ When P>Pb+Pcmax, the battery is charged at rated power, and the supercapacitor is charged at maximum power. After charging to the maximum capacity, the remaining wind power is used as waste energy; When Pb< Δ When P<Pcmax, the battery is charged at rated power, and the supercapacitor is charged on demand; When Δ When P<Pb, the battery does not charge, only the supercapacitor charges. During the charging process, both the battery and supercapacitor must meet capacity and power limitations. Therefore, the capacity and total wind power consumption of the battery and supercapacitor at time t are shown in equations (11) and (12), respectively.
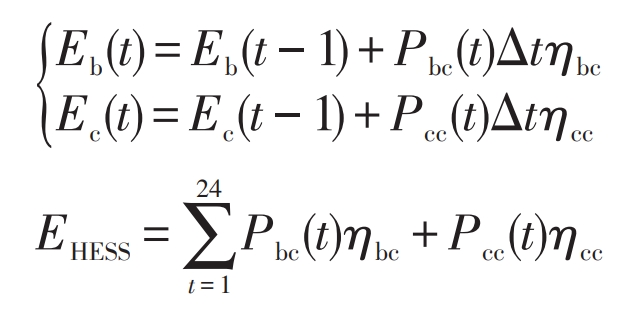
In the formula: Eb (t-1), Ec (t-1) – the capacity of the battery and supercapacitor at t-1 time, kWh; EHESS – Total amount of wind power consumption, kWh; Pbc (t), Pcc (t) – Charging power of battery and supercapacitor, kW; η BC η Cc – Charging efficiency of batteries and supercapacitors; Δ T – Time interval, h.
2) When Δ When P<0, the wind power cannot meet the load demand, and the hybrid energy storage system discharges.
When Δ When P>Pb+Pcmax, the battery is discharged at rated power, and the supercapacitor is charged at maximum power until it reaches the minimum capacity. The user load that has not been met is considered as the power shortage; When Pb< Δ When P<Pcmax, the battery is discharged at rated power, and after reaching its maximum limit, the remaining power shortage is compensated by the discharge of the supercapacitor; When Δ When P<Pb, the supercapacitor discharges and the battery does not discharge. Therefore, the discharge capacities of the battery and supercapacitor at time t are:
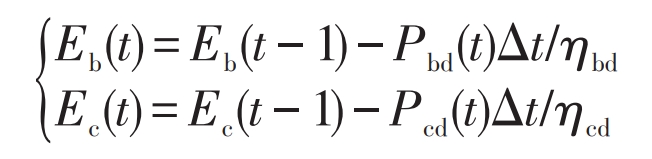
In the formula: Pbd (t), Pcd (t) – discharge power of the battery and supercapacitor, kW; η Bd η CD – Discharge efficiency of batteries and supercapacitors.
4.Multi-objective optimization configuration model and its solution
4.1 Objective function
4.1.1 Lowest cost of hybrid energy storage system
For energy storage companies, the goal is to achieve the lowest hybrid energy storage cost by configuring the optimal energy storage capacity. The cost of hybrid energy storage consists of the full life cycle cost of hybrid energy storage and the user subsidy cost, as shown in equation (14). The full life cycle cost of hybrid energy storage includes the equipment acquisition cost CI (yuan), operating cost CO (yuan), maintenance cost CM (yuan), and processing cost CD (yuan), as shown in equation (15); The user compensation cost includes the translatable load compensation cost Cmove (yuan) and the reducible load compensation cost Ccut (yuan), as shown in equation (16).
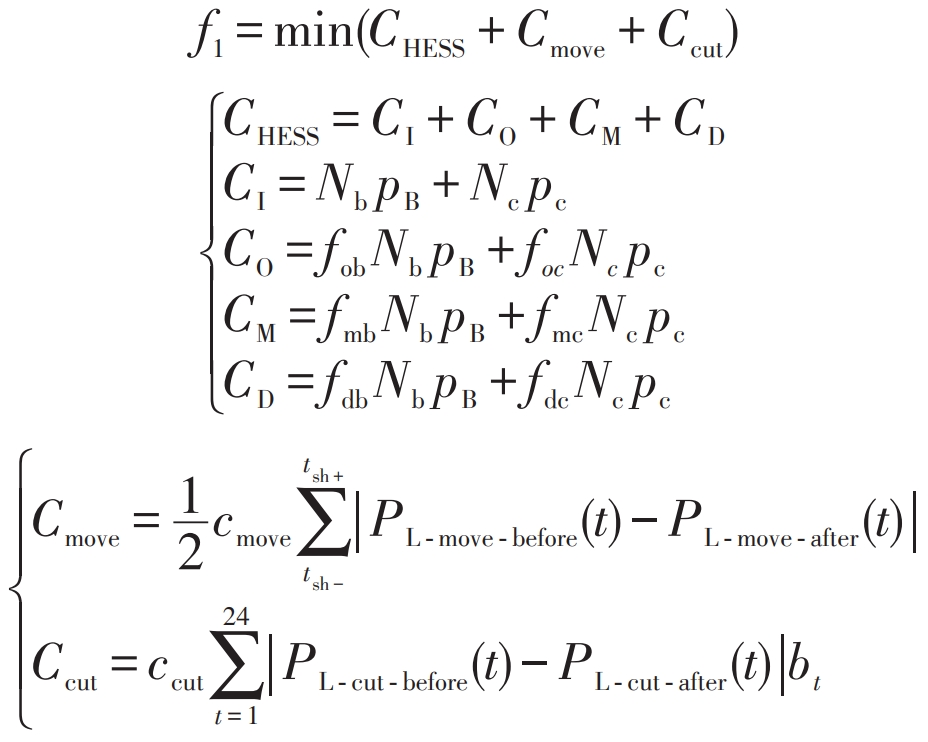
In the formula: CHESS – Total life cycle cost of energy storage, yuan; PB, pc – purchase unit price of batteries and supercapacitors, yuan; Fob, foc – operating cost coefficient; Fmb, fmc – maintenance cost coefficient; Fdb, fdc – processing cost coefficient; Cmove, ccut – unit compensation cost for translatable and reducible loads, yuan; PL – move – before, PL – move – after – load power before and after translation, kW.
4.1.2 Minimum Wind Power Abandonment Rate
For wind power companies, there is a certain degree of energy abandonment due to the inability of wind power to be fully absorbed by user loads and energy storage. Wind power companies hope to improve the on-site wind power consumption capacity through energy storage systems, in order to achieve the minimum wind abandonment rate.
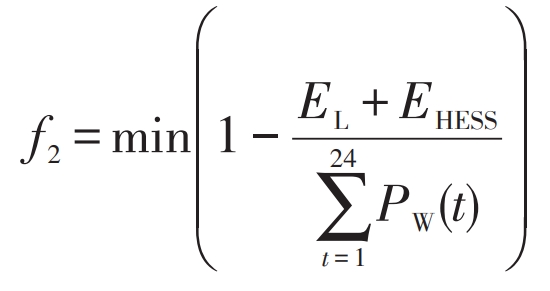
In the formula: EL, EHESS – wind power consumption of user load and mixed energy storage, kWh.
4.1.3 User satisfaction
For users, participating in demand response can reduce electricity purchase costs, but they still hope to meet electricity demand, reduce load curve fluctuations, and ensure electricity comfort. User satisfaction is defined as:
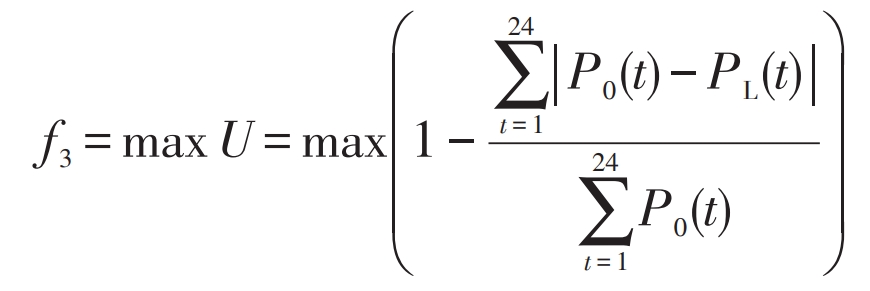
In the formula: P0 (t), PL (t) – User’s electricity consumption at time t before and after demand response, in kW. The larger the value of U, the more comfortable the user’s electricity consumption, the higher their satisfaction, and the corresponding objective function value.
4.1.4 Determination of sub objective function weights
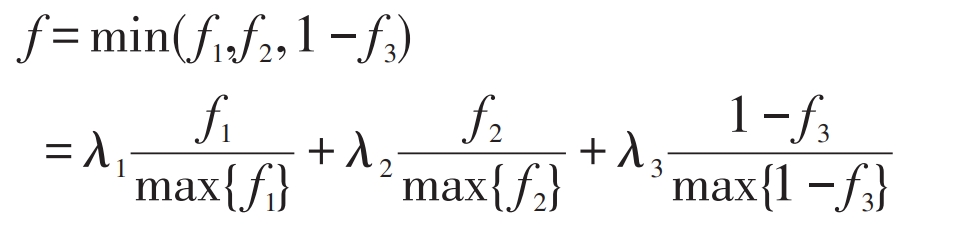
In the hybrid energy storage capacity optimization configuration model, there are multiple sub objectives. This article takes into account the needs of wind power companies, energy storage companies, and users, and considers the three objectives as equally important. Therefore, when dealing with multi-objective functions, normalization is adopted and the same objective weights are set λ 1= λ 2= λ 3=0.33, as shown in equation (19). In practical situations, the importance of goals needs to be measured based on the subjective opinions of decision-makers, in order to determine the weight. Further analysis of the weight of goals will be conducted in Section 5.3.
4.2 Constraints
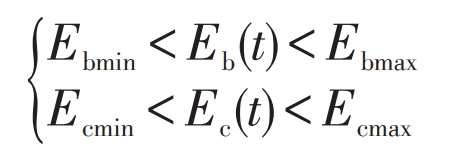
1) Capacity constraints. The electrical energy stored in batteries and supercapacitors should be between their maximum and minimum capacities, with capacity constraints as follows:
2) Power constraints. According to the operation strategy of hybrid energy storage systems, the charging and discharging power of batteries and supercapacitors is limited by the following constraints.
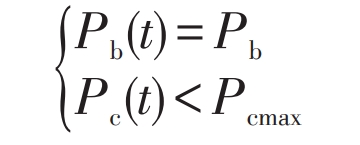
3) Important load constraints. The hybrid energy storage system should ensure that the power supply can meet the needs of important loads within a certain period of time.
In the equation: β —— The proportion of important loads is taken as 0.65 in this article; Tmin – The guaranteed power supply time for hybrid energy storage, taken as 1 hour in this article.
4) Load shortage rate constraint. To ensure the normal use of electricity by users, the load shortage rate shall not exceed the maximum value allowed by users.
In the formula: flpspmax – maximum load power outage rate, taken as 0.05 in this article.
5) Flexible load constraints. The total amount of translatable load remains unchanged before and after demand response, namely:
6) Power purchase cost constraints. The electricity purchase cost after user participation in demand response cannot exceed the previous electricity purchase cost.
In the formula: c (t) – Time of use electricity price.
5.Example analysis
5.1 Simulation Environment and Solution Parameters
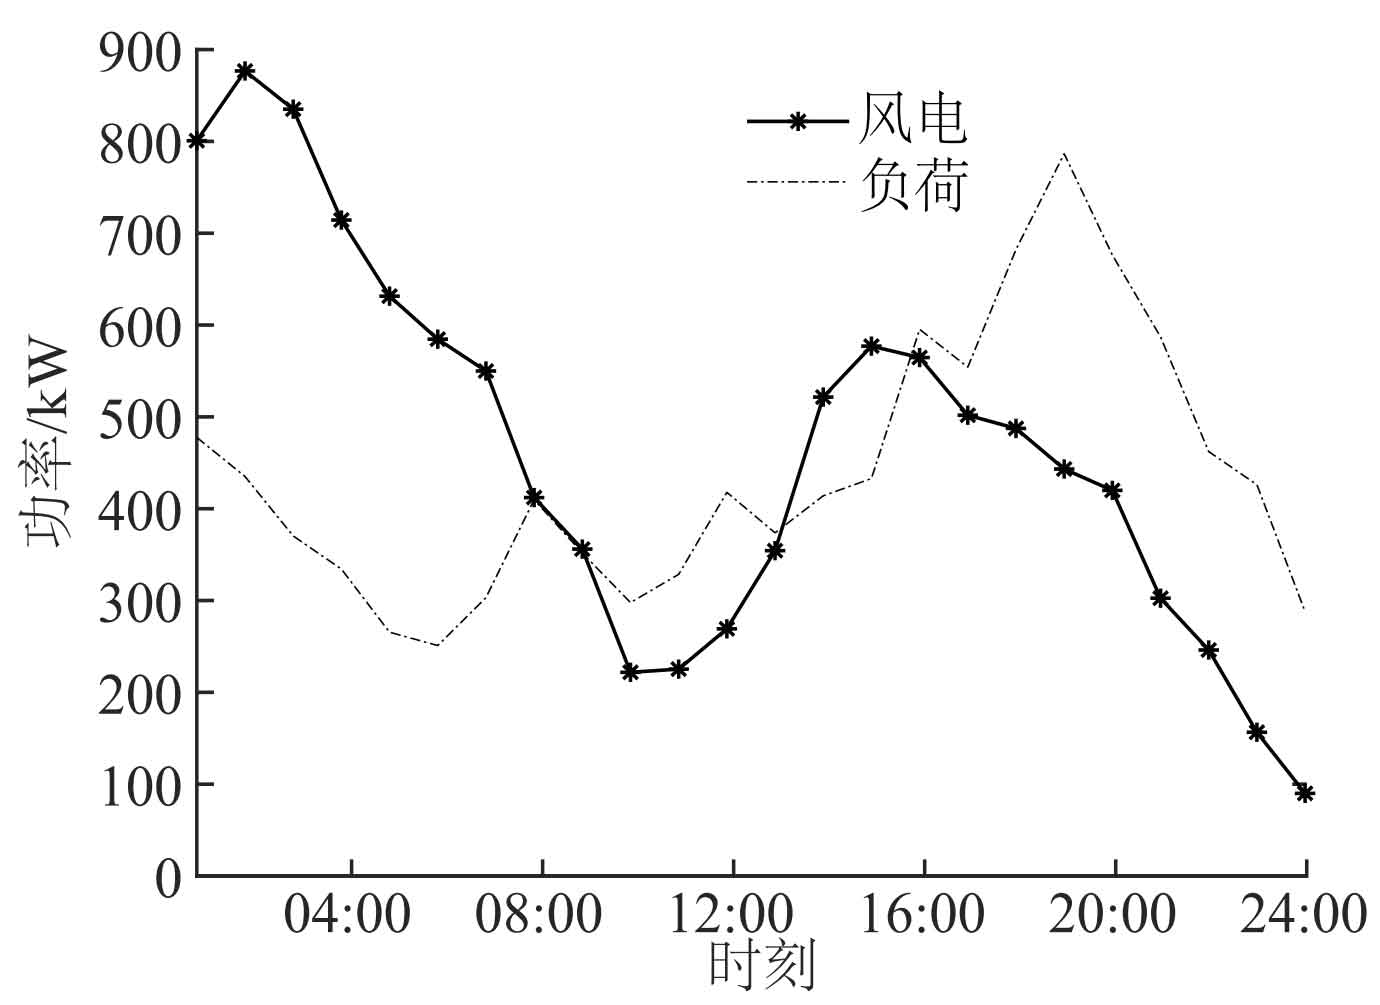
Based on the constructed optimization decision model, verify the effectiveness and applicability of the proposed method. The installed capacity of the wind turbine in this article is 1000 kW, the simulation environment is Matlab 2017b, and the operating system is Win10. The optimal solution is selected by running it 100 times. Figure 3 shows the wind power output and user load curve. User electricity is mainly concentrated between 15:00 and 23:00, while wind power is mainly concentrated between 00:00 and 06:00, which cannot be fully utilized by users.
| Battery parameters | Value | Supercapacitor parameters | Value |
| Unit capacity/Ah | 100 | Capacitance/F | 3500 |
| Unit voltage/V | 12 | Voltage/V | [0.8,2.7] |
| Ddepth | 0.4 | Maximum charging current/A | 1500 |
| Number of cycles/time | 1500 | Number of cycles/time | 150000 |
| Charging efficiency | 0.80 | Charging efficiency | 0.98 |
| Discharge efficiency | 0.40 | Discharge efficiency | 0.98 |
| Operating cost coefficient | 0.10 | Operating cost coefficient | 0.01 |
| Maintenance cost coefficient | 0.02 | Maintenance cost coefficient | 0.00 |
| Processing cost coefficient | 0.08 | Processing cost coefficient | 0.08 |
| Unit price/yuan | 400 | Unit price/yuan | 300 |
The relevant parameters of the battery and supercapacitor are shown in Table 1, the parameters of the MOPSO algorithm are shown in Table 2, and the time of use electricity price is referenced in the literature.
| Parameter | Value |
| Population size | 100 |
| Iterations/time | 100 |
| Individual learning factors | 0.5 |
| Social learning factors | 0.5 |
| Initial value of inertia weight | 0.5 |
| Inertia weight end value | 0.1 |
| Pareto solution size | 100 |
5.2 Analysis of optimization results
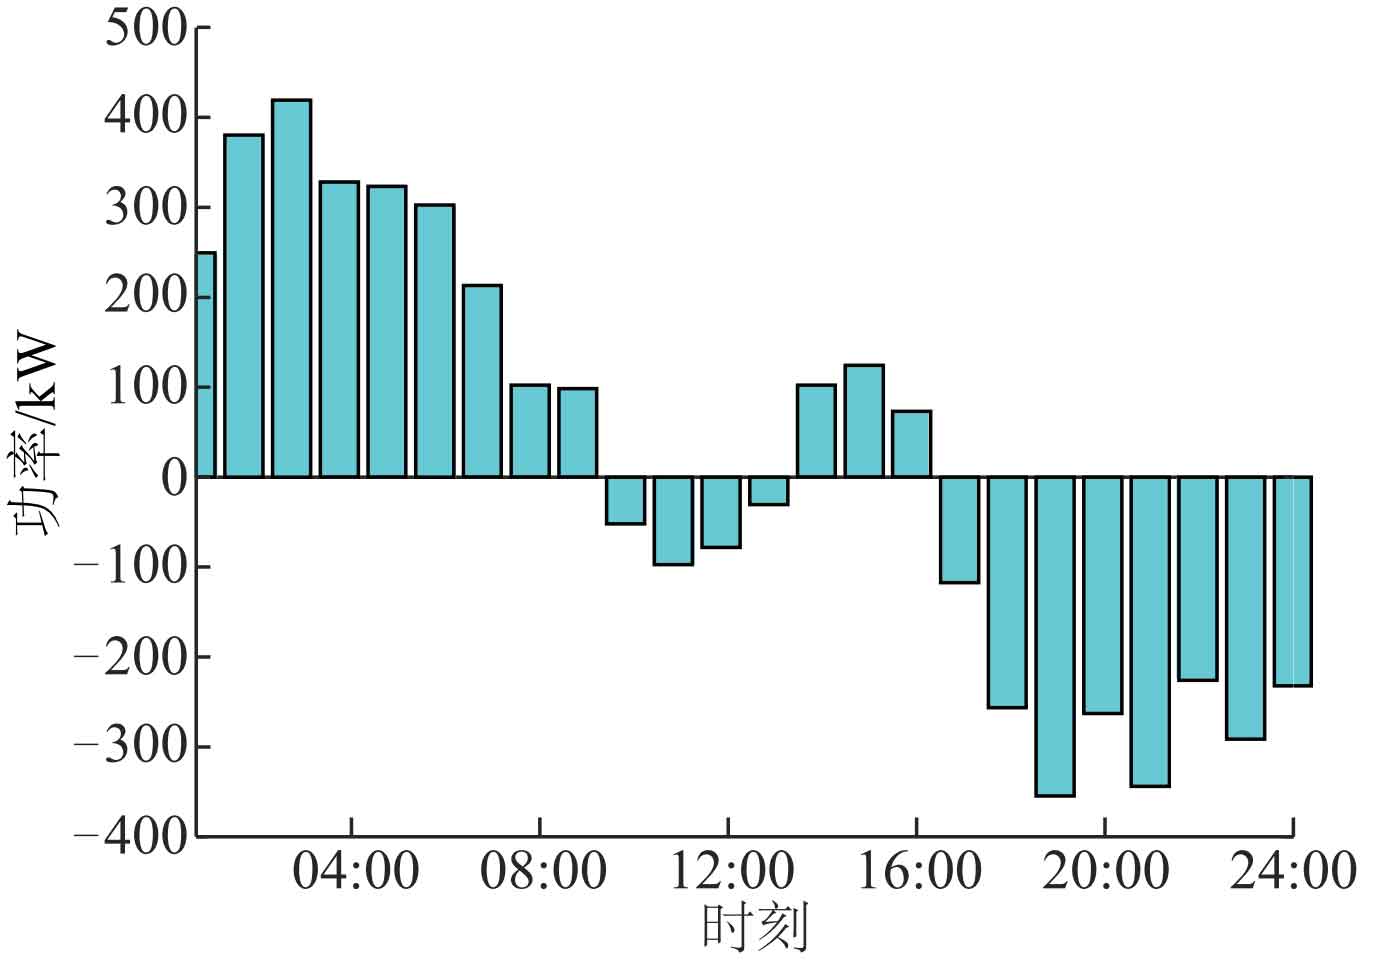
Before solving the capacity of the hybrid energy storage system through the optimization algorithm in this article, the unbalanced power between wind power output and user demand is first calculated, as shown in Figure 4. Between 10:00-13:00 and 17:00-24:00, wind power generation fails to meet user needs and needs to be mixed with energy storage discharge to make up for the difference; Between 01:00-09:00 and 14:00-16:00, wind power generation can meet user needs and has surplus, requiring mixed energy storage and charging to absorb surplus.
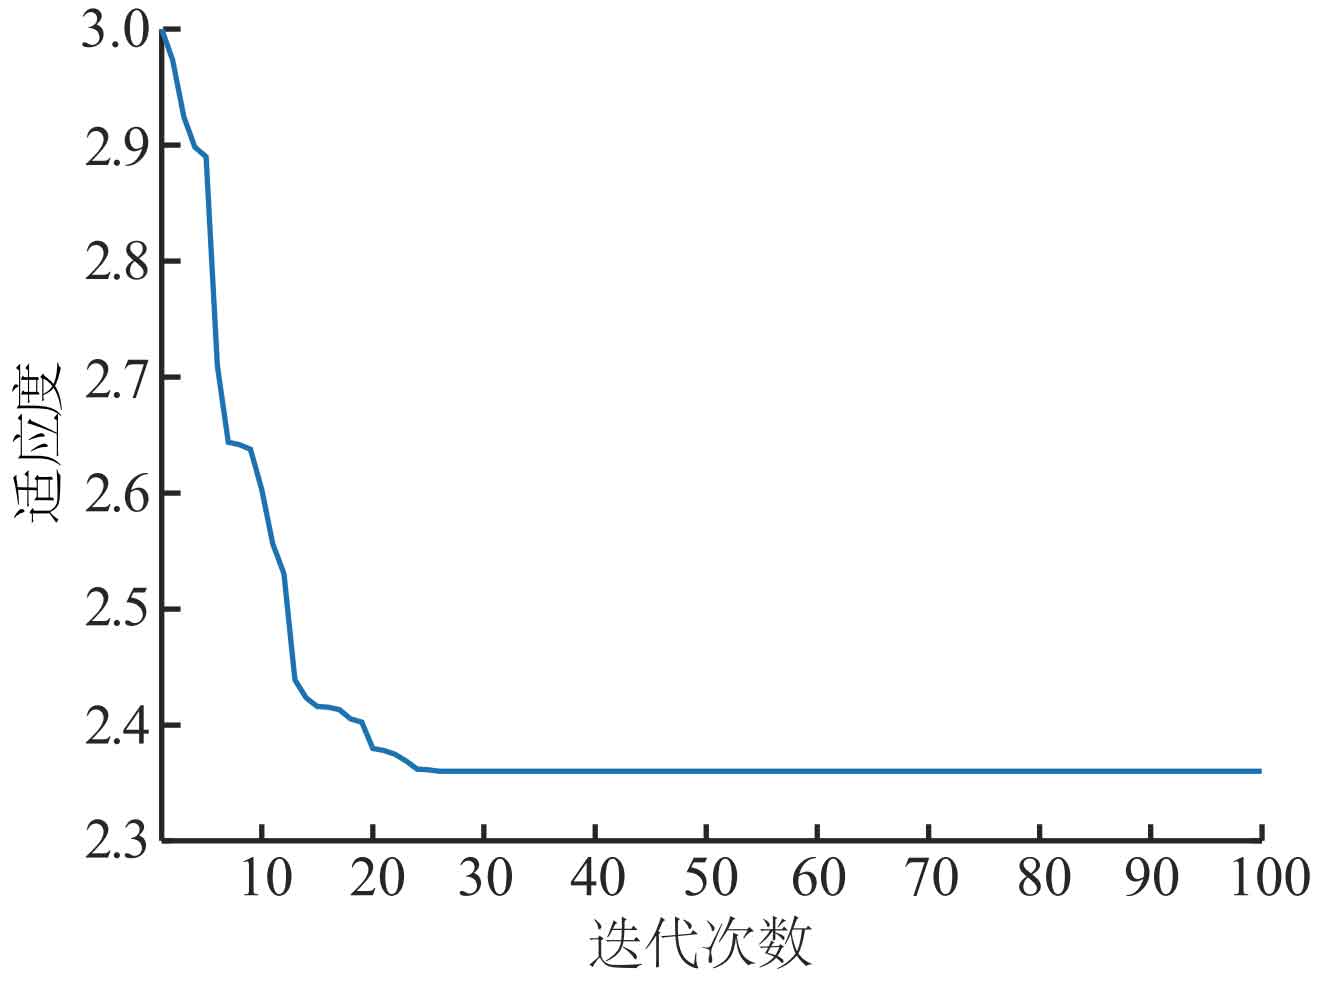
Based on the charging and discharging strategy and model of the hybrid energy storage system, the data was processed, and the convergence curve of the MOPSO algorithm is shown in Figure 5.
To demonstrate the effectiveness of the method proposed in this article, three scenarios were established and analyzed. Scenario 1: Without considering demand response and hybrid energy storage; Scenario 2: Do not consider demand response; Scenario 3: Comprehensively considering demand response and hybrid energy storage, which is the scenario in this article. The capacity configuration results of the hybrid energy storage system in three scenarios are shown in Table 3.
| Variable | Scenario 1 | Scenario 2 | Scenario 3 |
| Battery capacity/kWh | — | 1533 | 1372 |
| Supercapacitor capacity/kWh | — | 835 | 805 |
| System cost/yuan | — | 447008 | 330595 |
| Abandonment rate/% | 24.37 | 0.41 | 0.38 |
| User satisfaction | 1 | 1 | 0.8985 |
| Flpsp/% | 21.76 | 9.71 | 2.78 |
| Peak valley difference/kW | 540.16 | 483.98 | 483.98 |
5.2.1 Analysis of demand response results
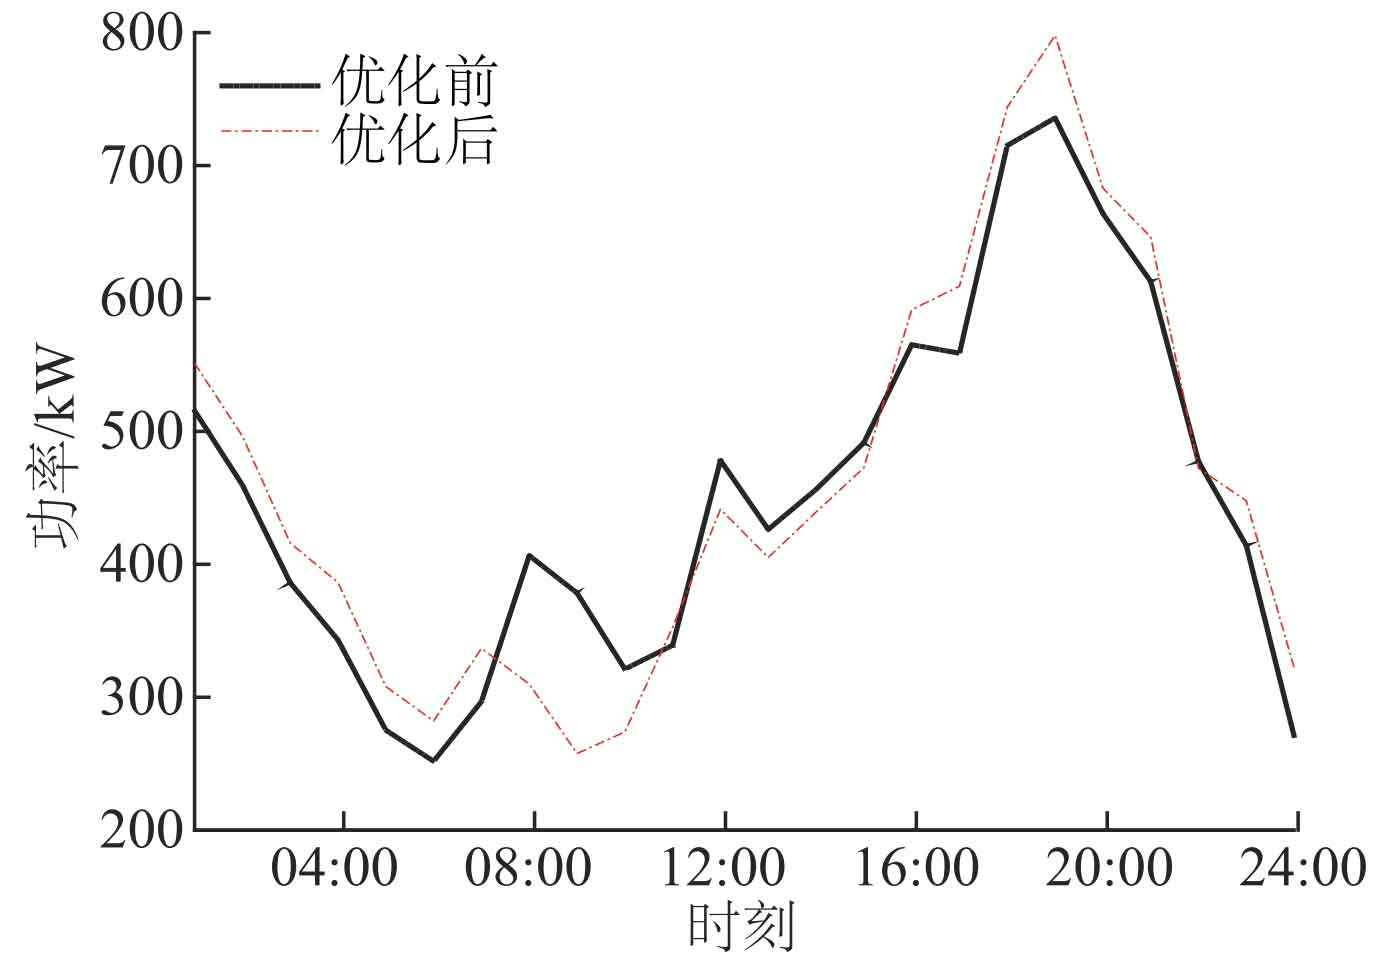
Comparing Scenario 2 and Scenario 3 with the user load curve before and after demand response (Figure 6), it can be seen that the difference between the maximum and minimum values of user electricity consumption is significantly reduced, with the peak valley difference decreasing from 540.16 kW to 483.98 kW, and the load shortage rate decreasing from 9.71% to 2.78%. Analyze the reasons for this, on the one hand, it is because users have reduced the use of translatable and reducible loads during peak electricity prices, thereby smoothing out the fluctuations in the load curve; On the other hand, based on a hybrid energy storage charging and discharging strategy, it compensates for the load shortage and thus improves the electricity consumption level of users. However, due to participating in demand response, users changed their original electricity consumption plan, and their satisfaction decreased from 1 to 0.8985, a decrease of 10.15%.
5.2.2 Analysis of Hybrid Energy Storage Capacity Configuration
The battery capacity in this scenario is 1372 kWh, and the supercapacitor capacity is 805 kWh, both of which are smaller than the energy storage capacity configured in scenario 2. Due to the high unit price of energy storage components and the high cost of hybrid energy storage systems, the cost has decreased by 26% compared to Scenario 2. In addition, without considering energy storage and user demand, the wind power curtailment rate is as high as 24.37%, and the load curtailment rate is as high as 21.76%. When only considering mixed energy storage, the wind power curtailment rate decreases to 0.41%, and the load curtailment rate decreases to 9.71%. After considering demand response, the curtailment rate and load curtailment rate are only 0.38% and 2.78%. The results show that wind power companies reduce wind abandonment and promote the consumption of new energy under the flexible load and mixed energy storage of users; By participating in demand response, users have improved their electricity consumption levels and smoothed load curve fluctuations while minimizing the impact on comfort; And energy storage companies not only meet the needs of both parties, but also reduce their own costs, achieving the economy and stability of hybrid energy storage systems.
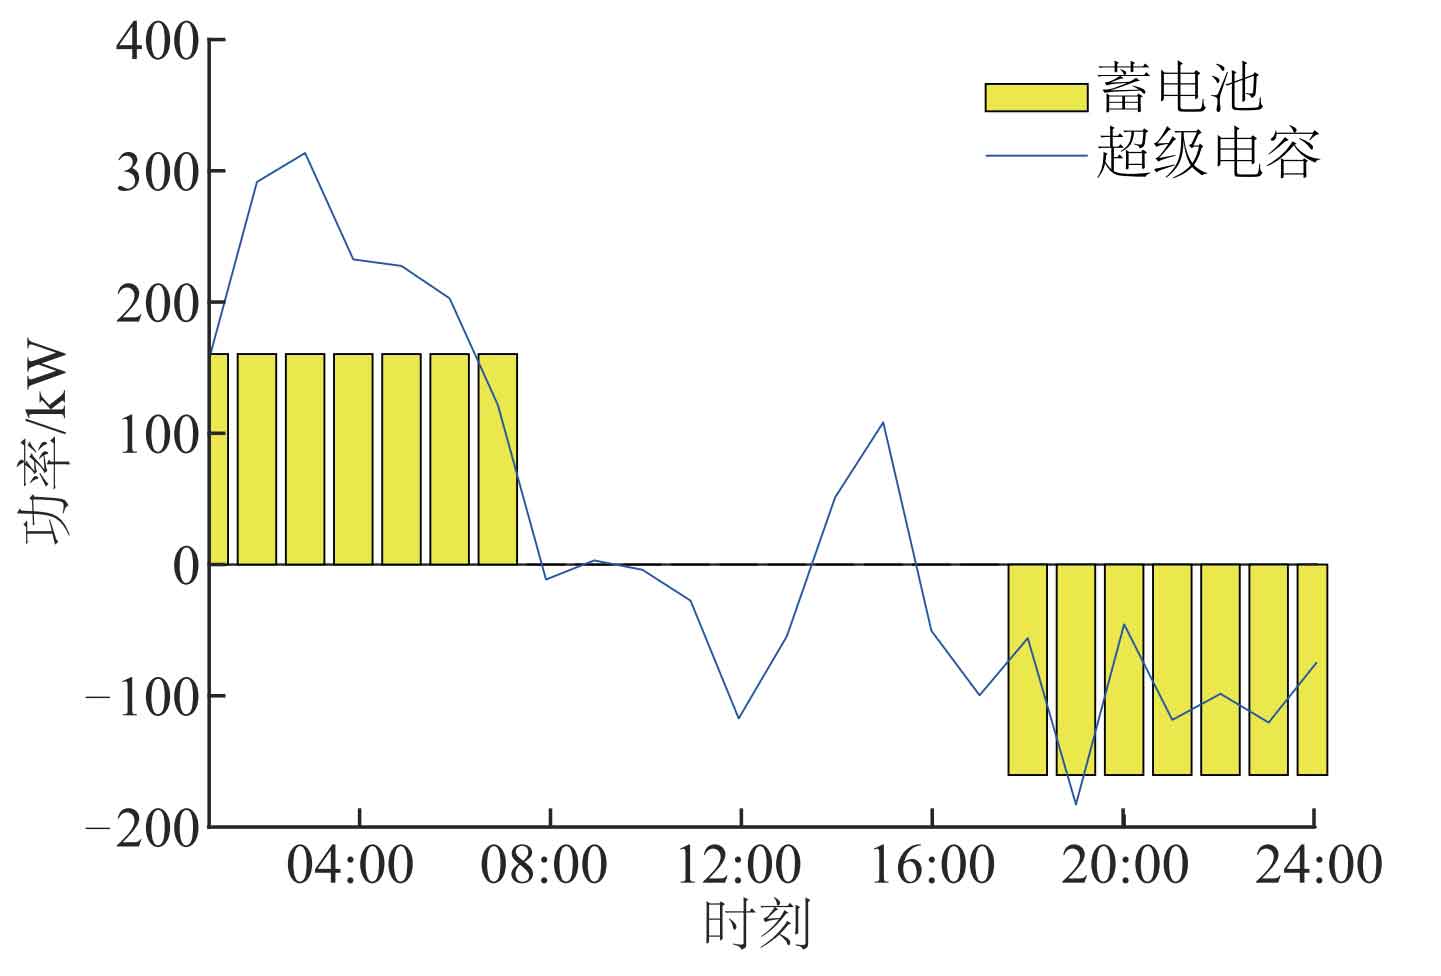
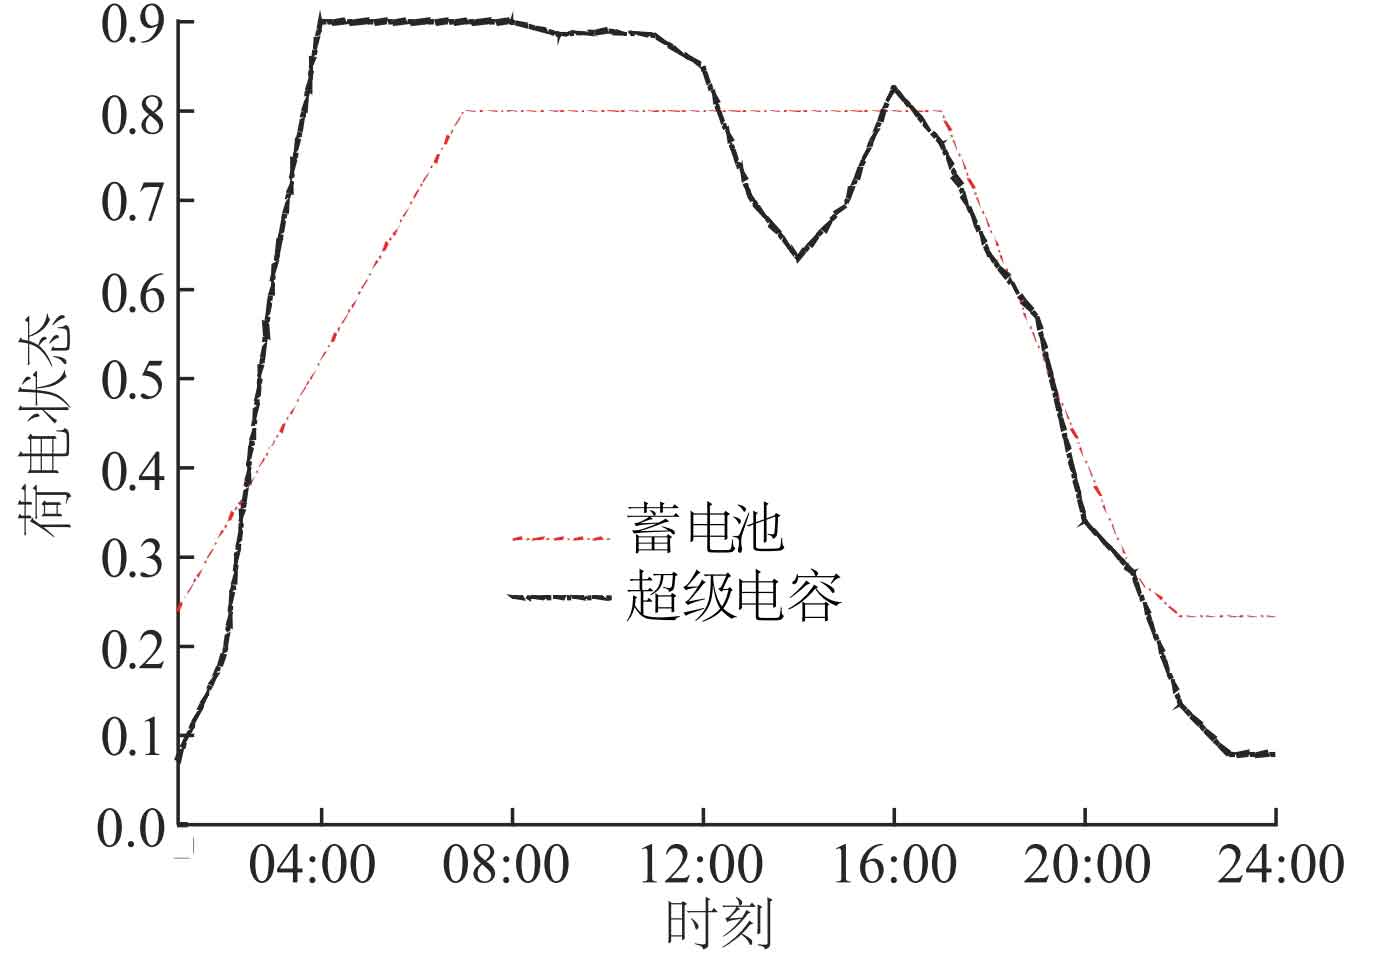
Under the optimal configuration, the 24-hour charging and discharging process of the hybrid energy storage system can be simulated, as shown in Figure 7. The battery is mainly used to respond to the basic part of unbalanced power, charging at rated power from 01:00 to 07:00 and discharging at rated power from 18:00 to 24:00, completing a complete charging and discharging process; To fully leverage the complementary advantages of hybrid energy storage, supercapacitors are mainly used to respond to the severe fluctuations in unbalanced power. They charge at 01:00-08:00 and 14:00-16:00, and discharge at 09:00-13:00 and 17:00-24:00, completing two charging and discharging processes. The changes in the state of charge of the hybrid energy storage system are shown in Figure 8. The charging state of the battery is concentrated between 0.2 and 0.8, and the charging state of the supercapacitor fluctuates between 0.1 and 0.9, both within the safe fluctuation range. There is no overcharging or discharging phenomenon, and the charging state of both is greater than or equal to the initial state at the last moment, meeting the demand for sustainable and stable operation of the energy storage system. In addition, the charging and discharging states of supercapacitors change frequently, and the number of changes in the state of charge is more frequent than that of batteries, which is more conducive to extending the service life of batteries.
5.3 Sensitivity analysis
5.3.1 Objective weight
Wind power merchants hope to achieve greater profits by consuming more wind power, with the goal of minimizing wind abandonment rates; The goal of energy storage companies is to minimize energy storage costs under optimal configuration; And users hope to reduce the impact on comfort while reducing the cost of purchasing electricity. The weight reflects the importance of the goal, and different decision-makers attach different importance to the goal. The impact of different weights on the optimization results is discussed here, as shown in Table 4.
| Number of groups | Weight coefficient( λ 1, λ 2, λ 3) | F1/yuan | F2/% | F3 | Battery capacity/kWh | Supercapacitor capacity/kWh |
| A1 | 0.33,0.33,0.33 | 330595 | 0.38 | 0.8985 | 1372 | 805 |
| A2 | 0.1,0.8,0.1 | 346203 | 0.36 | 0.8692 | 2234 | 842 |
| A3 | 0.1,0.1,0.8 | 363577 | 0.42 | 0.9159 | 2039 | 882 |
| A4 | 0.8,0.1,0.1 | 321723 | 0.41 | 0.8890 | 1153 | 750 |
The wind abandonment rate is set with weights of 0.1, 0.8, and 0.1. Compared with group A1, the wind abandonment rate shows a decreasing trend, and the wind abandonment phenomenon is effectively alleviated. However, the required mixed energy storage capacity increases, which does not have economic benefits. In the A3 group, decision-makers placed more emphasis on user needs, with weights set to 0.1, 0.1, and 0.8, indicating a significant increase in user satisfaction. In the A4 group, decision-makers tend to be more inclined towards low cost, with weights set to 0.8, 0.1, and 0.1. At this time, the cost of hybrid energy storage decreases, and the capacity of configured batteries and supercapacitors decreases, but the abandonment rate increases, which is not conducive to clean energy consumption; The results indicate that the determination of target weights is subjective and flexible, representing the preferences of decision-makers to a certain extent. Based on different decision-making preferences, the results of mixed energy storage capacity allocation are also different.
5.3.2 Energy storage rate
Due to the fact that the calculation of wind abandonment rate is related to the charging and discharging power of energy storage, and the charging and discharging power is directly related to the rate, the relationship between the quantity of mixed energy storage, energy storage cost, and wind abandonment rate is calculated separately under the conditions of 20C, 10C, 5C, and C.
| Ratio/C | Sustainable time/h | F1/yuan | F2/% | Nb | Nc |
| 20 | 20 | 337923 | 0.50 | 924 | 105868 |
| 10 | 10 | 330595 | 0.38 | 812 | 103713 |
| 5 | 5 | 337860 | 0.39 | 496 | 106501 |
| 1 | 1 | 390773 | 0.36 | 130 | 123856 |
According to Table 5, when the battery is charged and discharged at a rate of 10C, the sustainable time is 10 hours, and the cost of the energy storage system is the lowest; When charging and discharging at a rate of C, the sustainable time is 1 hour, the number of configured batteries is small, and the abandonment rate is the smallest, but the cost of the energy storage system is the highest. Comparing the optimization results at 10C and 5C, as well as 10C and 20C, although the abandonment rate of the battery decreased by 0.02% when charged and discharged at 5C rate, the cost increased by 2.2% compared to 10C. However, at 20C, the cost and abandonment rate of the energy storage system both increased. Therefore, a hybrid energy storage system with a continuous discharge time of approximately 10 hours will be the most valuable.
5.3.3 Population size
The simulation results under different population sizes are shown in Table 6. Among them, the changes in abandoned air volume and user satisfaction are not significant, but when the population size is 100, the energy storage system has the lowest cost and can achieve economic benefits while basically meeting the needs of wind power consumption and users. From this, it can be seen that if the population size is too small, sufficient sampling points cannot be provided. If it is too large, it will increase the computational workload. For different solving problems, the optimal population size also varies. In this article, the optimal population size is 100.
| Population size | F1/yuan | F2/% | F3 |
| 50 | 357989 | 0.43 | 0.9008 |
| 100 | 330595 | 0.38 | 0.8985 |
| 200 | 344034 | 0.40 | 0.9001 |
5.4 Comparative analysis of methods
The non dominated sorting genetic algorithm (NSGA-II algorithm), multi-objective differential evolution algorithm MOEA, and our algorithm are now used for optimization comparison. The parameter settings are as follows: the population size is 100, the number of iterations is 100, the crossover and mutation rates of NSGA – II algorithm are 0.7 and 0.5, respectively, the crossover rate of MOEA algorithm is 0.8, and the scaling factor is 0.5. The optimal solutions obtained by independently running the three algorithms 100 times are shown in Table 7.
| Algorithm | F1/yuan | F2/% | F3 |
| MOPSO | 330595 | 0.38 | 0.8985 |
| NSGA-Ⅱ | 344974 | 0.39 | 0.8930 |
| MOEA | 350694 | 0.40 | 0.8928 |
Compared with the other two algorithms, the hybrid energy storage cost solved by this algorithm is lower, user satisfaction is higher, and the wind abandonment rate is minimized. To further compare the three algorithms, a box chart was drawn in Figure 9 to compare the distribution of results after 100 runs of the three algorithms. Due to the small difference in wind abandonment rate and user satisfaction solution results under different algorithms, we will only discuss the benchmark function f1, which is the mixed energy storage cost operation result.
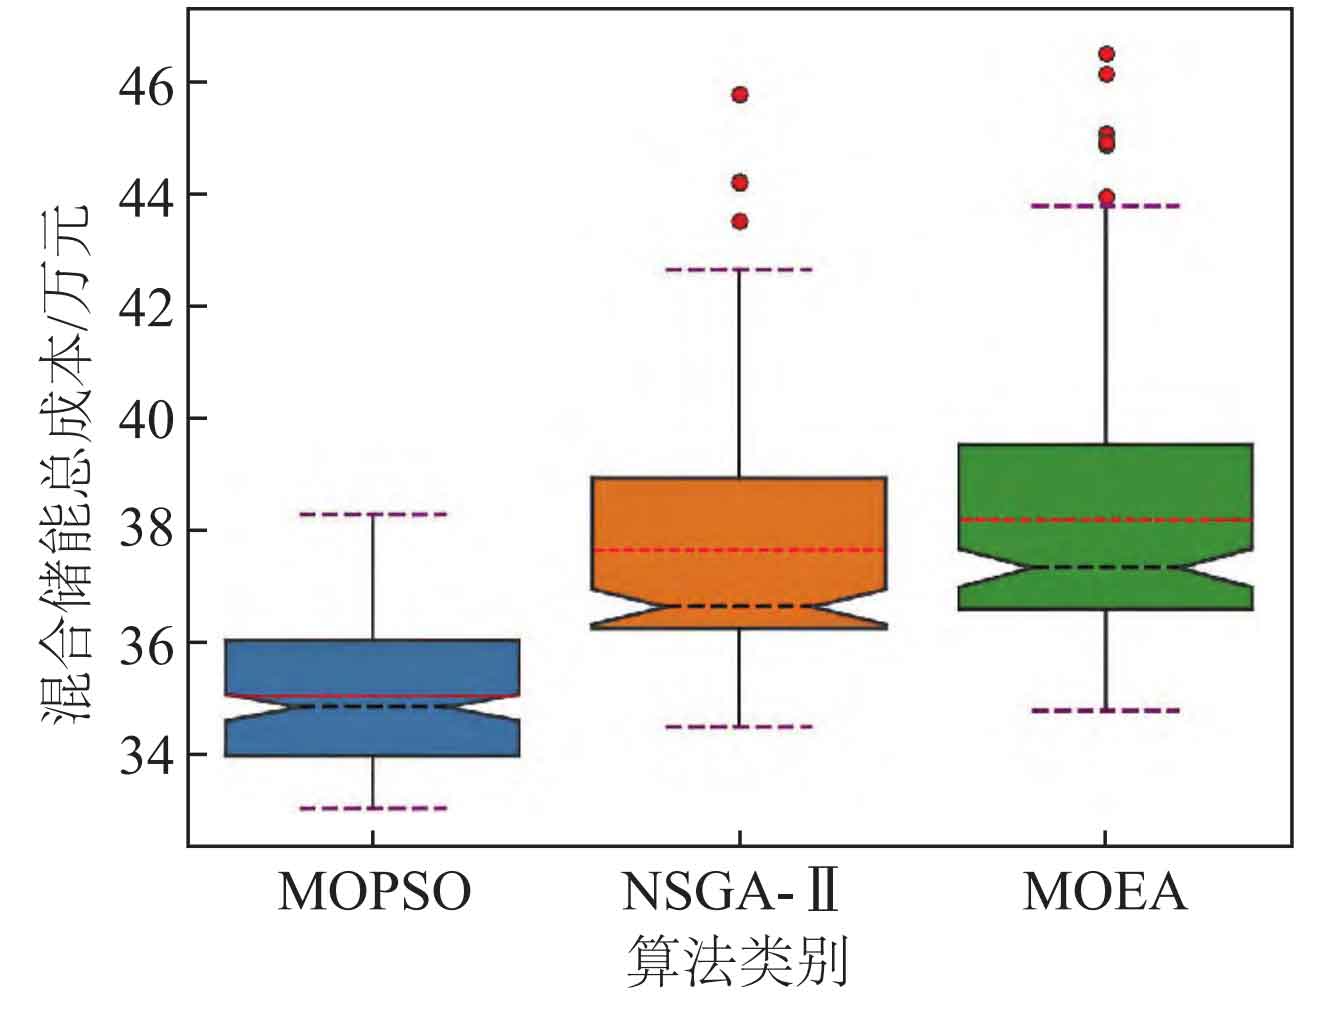
From Figure 9, it is evident that the standard deviation of MOPSO is smaller than that of the other two algorithms. Further observation shows that in the 100 run results, the difference between the upper and lower limits of the solution obtained by the algorithm in this paper is smaller, reflecting the stability of the algorithm and there are no outliers; For the NSGA – II algorithm, the maximum value deviates from the optimal solution and there are three abnormal solutions; For the MOEA algorithm, the lower bound of the solution result is greater than the other two algorithms, and there are 6 abnormal solutions. In summary, the algorithm proposed in this paper is more stable and has high solving accuracy.
6.Conclusion
This article takes hybrid energy storage as the central node and proposes a capacity allocation method that considers the bidirectional demand of wind power consumption and user electricity consumption. The method is solved through multi-objective particle swarm optimization algorithm, and the results show that:
1) Building a multi-objective optimization model for hybrid energy storage capacity with the objective functions of minimizing the cost of energy storage systems, minimizing wind power abandonment rates, and maximizing user satisfaction can not only improve wind power utilization and on-site consumption capacity, but also reduce electricity purchase costs while ensuring user comfort and satisfaction, achieving value co creation among wind power, energy storage, and users.
2) Developing a hybrid energy storage charging and discharging strategy based on different energy storage characteristics can fully leverage the advantages of batteries and supercapacitors, achieve complementary performance, reduce system costs, and ensure the healthy operation of the energy storage system.
3) The reliability of the proposed model was verified through sensitivity analysis of model parameters, indicating that the charging and discharging strategy and capacity configuration method of the hybrid energy storage system considering bidirectional demand are reasonable and applicable. In addition, the optimization comparison between the MOPSO algorithm, NSGA – II algorithm, and MOEA algorithm has confirmed the effectiveness and stability of the algorithm, providing reference for the application of the MOPSO algorithm in the solving process of such problems.
There are still shortcomings in this study, such as the failure of the hybrid energy storage system model to consider the operating life. In the future, this will be the focus of further research work.