
We conducted a comprehensive study on the multi-field coupling characteristics of heat transfer and stress in solar panels, aiming to better understand the thermal management issues that affect their performance and durability. Solar panels are critical components in photovoltaic power generation, and their efficiency and lifespan are significantly influenced by temperature distribution and thermal stress. Using multiple temperature sensors and a thermal infrared imager, we measured the surface temperature distribution of a solar panel. Based on these experimental data, we developed a thermal-fluid-stress coupling model to simulate the multi-physics behavior. Our findings highlight the importance of ambient temperature, flow conditions, and partial shading in creating non-uniform temperature fields and stress concentrations.
The solar panel we studied consists of a glass cover, a photovoltaic (PV) module, a backsheet, and a cooling system that includes heat pipes and forced air convection. We measured temperatures at four points on the glass cover and six points on the backsheet under real outdoor conditions. The experimental setup allowed us to capture transient temperature variations from early morning to late afternoon. We then constructed a three-dimensional geometric model using ICEM software and performed mesh independence verification with four mesh densities: 700,000, 800,000, 900,000, and 1,000,000 cells. The temperature deviation between 700,000 and 1,000,000 cells was only about 1%, so we selected the 700,000-cell mesh for all subsequent simulations to balance accuracy and computational efficiency.
Our numerical model incorporates the total solar radiation received by an inclined solar panel, which consists of direct beam radiation, diffuse sky radiation, and ground-reflected radiation. The total radiation on the tilted surface \( H_{Tt} \) is given by:
$$
H_{Tt} = H_{Td} + H_{Ts} + H_{Tr}
$$
where \( H_{Td} \) is the direct radiation on the tilted surface, \( H_{Ts} \) is the sky diffuse radiation, and \( H_{Tr} \) is the ground-reflected radiation. The direct component is expressed as:
$$
H_{Td} = H_{Hd} R
$$
with \( H_{Hd} \) the direct radiation on a horizontal surface and \( R \) the tilt factor. The sky diffuse component is:
$$
H_{Ts} = H_{Hs} \left\{ \frac{H_{Ht} – H_{Hs}}{H_o} R + \frac{1 + \cos\beta}{2} \left[1 – \frac{H_{Ht} – H_{Hs}}{H_o}\right] \right\}
$$
where \( H_{Hs} \) is the horizontal sky diffuse radiation, \( H_{Ht} \) is the total horizontal radiation, \( H_o \) is the extraterrestrial radiation, and \( \beta \) is the tilt angle of the solar panel. The ground-reflected term is:
$$
H_{Tr} = \rho H_{Ht} \frac{1 – \cos\beta}{2}
$$
with ground reflectance \( \rho = 0.26 \).
We performed an energy balance on the solar panel considering heat transfer with the environment. The output power \( E \) of the panel is:
$$
E = Q A_{pv} (\tau\beta)_{pv} + h_{pva} (T_a – T_{pv}) A_{pva} + h_{sky,pv} (T_{sky} – T_{pv}) A_{sky,pv}
$$
where \( Q \) is the solar irradiance, \( A_{pv} \) is the panel area, \( (\tau\beta)_{pv} \) is the effective absorptivity (taken as 10%), \( h_{pva} \) is the convective heat transfer coefficient between the panel and ambient air, \( T_a \) is the ambient temperature, \( T_{pv} \) is the panel temperature, \( h_{sky,pv} \) is the radiative heat transfer coefficient to the sky, and \( T_{sky} \) is the sky temperature. The convective coefficient is:
$$
h_{pva} = 5.7 + 3.8 u_a
$$
with \( u_a \) the outdoor wind speed. The radiative coefficient is:
$$
h_{sky,pv} = \frac{\varepsilon \delta (T_{sky}^4 – T_{pv}^4)}{T_{sky} – T_{pv}}
$$
where \( \varepsilon = 0.9 \) is the emissivity and \( \delta = 5.67 \times 10^{-8} \, \text{W/(m}^2\cdot\text{K}^4) \) is the Stefan–Boltzmann constant. The sky temperature is estimated as:
$$
T_{sky} = 0.0552 \, T_a^{1.5}
$$
The electrical output power \( E \) is also expressed as a function of panel temperature:
$$
E = Q \tau_g \eta_{ref} \left[1 + \kappa (T_{pv} – 298.15)\right]
$$
where \( \tau_g = 1 \) is the glass transmissivity, \( \eta_{ref} \) is the reference efficiency at 25°C and 1000 W/m², and \( \kappa = -0.0034 \, \text{°C}^{-1} \) is the temperature coefficient. Table 1 summarizes the key parameters used in our model.
| Parameter | Symbol | Value |
|---|---|---|
| Panel area | \( A_{pv} \) | 1.6 m² (typical) |
| Tilt angle | \( \beta \) | 30° |
| Ground reflectance | \( \rho \) | 0.26 |
| Effective absorptivity | \( (\tau\beta)_{pv} \) | 0.10 |
| Emissivity | \( \varepsilon \) | 0.9 |
| Temperature coefficient | \( \kappa \) | -0.0034 °C⁻¹ |
We now present the experimental and simulation results. Figure 1 shows a typical bifacial solar panel used in our study.
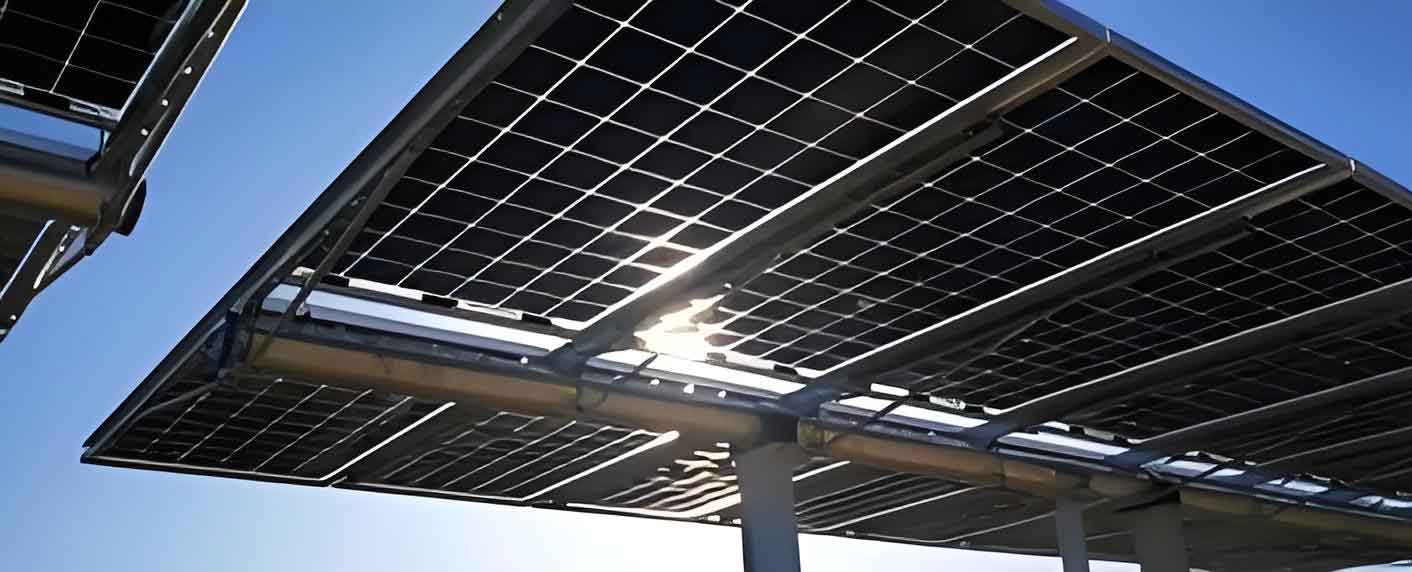
Temperature measurements on the glass cover revealed that the four test points exhibited a maximum temperature difference of about 5°C at the same time. The difference increased with increasing solar radiation and decreased as radiation declined. For the PV module backsheet, the maximum temperature difference among six test points reached about 8°C. The temperature difference between the glass cover and the backsheet was as large as 15°C, with the peak temperature occurring around 13:00. The left-side test points were consistently hotter than the right-side ones due to asymmetric airflow and shading effects.
Ambient temperature strongly influences the solar panel’s thermal behavior. We observed a positive correlation between ambient temperature and panel surface temperature. Furthermore, the temperature gradient between the cover and backsheet increased with ambient temperature, leading to larger thermal deformation. This relationship is summarized in Table 2, which lists the maximum deformation and surface temperature difference under various conditions.
| Ambient Temperature (K) | Flow Velocity (m/s) | Max Deformation (m) | Surface Temp. Difference (°C) |
|---|---|---|---|
| 310 | 1 | 6.5×10⁻⁵ | 28 |
| 310 | 3 | 5.0×10⁻⁵ | 22 |
| 310 | 5 | 4.8×10⁻⁵ | 20 |
| 340 | 1 | 9.9×10⁻⁵ | 48 |
| 340 | 3 | 7.2×10⁻⁵ | 35 |
| 340 | 5 | 6.9×10⁻⁵ | 33 |
As seen in Table 2, the maximum deformation reached \( 9.9 \times 10^{-5} \) m at an ambient temperature of 340 K and low flow velocity (1 m/s). The surface temperature difference also increased significantly, approaching 48°C. At higher flow velocities (≥3 m/s), the deformation and temperature difference decreased and became less sensitive to ambient temperature changes. This indicates that flow velocity plays a role but is not the dominant factor; ambient temperature has a greater impact on the thermal-mechanical behavior of the solar panel.
We also used a thermal infrared camera to capture surface temperature distributions on the solar panel under normal and high-temperature conditions. The infrared images revealed severe non-uniformity. Under normal operation without cooling fans, local hot spots appeared with temperatures up to 70°C, while shaded areas remained cooler, creating a maximum temperature difference of over 30°C. Partial shading caused one region to be significantly cooler, which further intensified the temperature gradient across the panel.
Our CFD simulations reproduced these non-uniformities. Figure 2 (conceptual) shows the velocity field on the panel surface. We observed that the transverse flow in the cooling channel became highly non-uniform, leading to concentrated flow in some areas and stagnation in others. This non-uniformity generated local hot spots. Even when the panel was uniformly heated by the environment, the channel flow distribution caused uneven cooling.
Further analysis of the velocity field near stress concentration points revealed the formation of vortices. These vortices altered the direction of fluid motion, creating recirculation zones that enhanced local heat transfer but also caused energy losses. The recirculation led to temperature fluctuations, which in turn induced stress fluctuations. Thermal stress increased with temperature, creating stress concentration points around the hot spots. These stress concentrations are detrimental to the solar panel’s encapsulation layers (EVA, backsheet) and can cause delamination over time, reducing the module’s service life.
The thermal-fluid-stress coupling can be summarized by the following relationship: higher ambient temperature → higher panel temperature and larger temperature gradients → greater thermal deformation and stress. The presence of vortices in the flow field amplifies local temperature non-uniformities, leading to extreme hot spots. The stress field then becomes non-uniform, with peak stresses occurring near the hot spots. Table 3 presents simulation results for selected cases, showing the maximum von Mises stress in the glass cover.
| Ambient Temperature (K) | Flow Velocity (m/s) | Max Stress (MPa) |
|---|---|---|
| 310 | 1 | 2.3 |
| 310 | 3 | 1.8 |
| 340 | 1 | 4.7 |
| 340 | 3 | 3.5 |
From Table 3, the maximum stress increased from 2.3 MPa at 310 K to 4.7 MPa at 340 K when the flow velocity was 1 m/s. Higher flow velocity reduced the stress levels slightly, but ambient temperature remained the primary driver.
We also investigated the effect of fluid velocity on the maximum deformation and surface temperature difference. At low ambient temperature (310 K), increasing velocity from 1 to 5 m/s reduced the deformation by about 26% and the temperature difference by 29%. At high ambient temperature (340 K), the reductions were about 30% and 31%, respectively. This demonstrates that forced convection is beneficial but cannot fully compensate for the thermal load imposed by high ambient temperatures.
In conclusion, our study reveals the strong coupling between heat transfer and stress in solar panels. Ambient temperature is the most influential factor, directly increasing panel temperature gradients and thermal deformation. Partial shading exacerbates the problem by creating extreme hot spots with temperature differences exceeding 30°C. Vortices in the cooling channel flow can cause localized temperature fluctuations, leading to stress concentrations that may initiate structural failure. These findings provide important guidance for the design and thermal management of solar panels, especially in hot climates. Optimizing the cooling channel geometry and flow distribution can help mitigate non-uniformities and extend the operational life of photovoltaic modules.