
With the proposal of the national “dual carbon” goal, the construction of a new type of power system with new energy as the main body has become the overall direction of the transformation of the energy and power industry. At the same time, due to the randomness and instability of the power generation output of clean energy sources such as wind and solar energy, building large capacity energy storage stations to achieve dynamic balance of “source grid load storage” is of great significance for new power systems.
In the field of energy storage, the total installed capacity of electrochemical energy storage is second only to pumped storage, and lithium battery energy storage accounts for up to 80% of electrochemical energy storage, which is widely used in new power system energy storage stations [1]. Due to the limitation of the output power of individual batteries, the current electrochemical energy storage power station mainly uses modules composed of single lithium batteries in series and parallel to output power externally. Based on grid scheduling, the charging and discharging of the energy storage power station modules are controlled in a timely manner to achieve peak shaving function. Therefore, in order to achieve status monitoring and operation management of electrochemical energy storage power plants, it is necessary to analyze the working status of individual lithium batteries, which are important components of energy storage power plants, in order to provide a data foundation and management suggestions for the safe operation of energy storage power plants.
The Battery Management System (BMS) is one of the core components of energy storage power plants, which can monitor and control the working status of each energy storage battery in real-time, prevent overcharging and discharging, avoid sudden temperature rise during battery operation, and ensure that the energy storage battery always operates under safe conditions. State of Charge (SOC), as a key state parameter in battery management systems, not only reflects the current load situation of energy storage batteries, but also provides data support for other state parameters of battery components. However, due to the strong nonlinear characteristics of the SOC of lithium batteries, which are greatly affected by the polarization process and operating temperature of the battery, real-time and accurate estimation of SOC has become a challenge.
The traditional SOC estimation methods mainly include open-circuit voltage method, ampere-hour integration method, electrochemical model based method, and lithium-ion battery operation data-driven method. The open circuit voltage method is simple and feasible, but it requires long-term standing of lithium batteries and is not suitable for online estimation of lithium batteries. The Anshi integration method is simple to calculate, but it is sensitive to initial values and has a significant error. A data-driven method is proposed to estimate the SOC of lithium batteries by training and learning data such as voltage and current during operation, based on the data-driven extended Kalman filtering algorithm. Effectively combining data-based SOC estimation methods with model-based SOC estimation algorithms has achieved SOC estimation under complex operating conditions. However, this method only considers the factors of battery aging and does not explore the impact of battery temperature. Propose the use of genetic algorithm optimized neural networks to predict the nonlinear error of Kalman filtering, and then use adaptive least squares method to identify the model parameters. Similarly, this method did not take into account the influence of temperature. The model-based methods can be divided into two types: electrochemical models and equivalent circuit models. The electrochemical reaction model starts from the internal reaction mechanism of the battery and identifies the model parameter values corresponding to different electrochemical models through differential equations. The equivalent circuit model utilizes ideal circuit components to simulate the complex electrochemical reaction process of lithium batteries. Due to its simplicity, researchers have also conducted research on this topic. Select a second-order RC equivalent circuit model and use the deviation compensation least squares method for parameter identification. Afterwards, the adaptive Kalman filtering algorithm was used to estimate the battery SOC, avoiding the impact of system noise.
However, it is not possible to accurately characterize the phase transition of the internal structure of the battery solely through voltage and current data. However, the broadband AC internal resistance, known as Electrochemical Impedance Spectroscopy (EIS), can obtain information on battery dynamics and electrode interface structure, and characterize different electrochemical reaction processes. Electrochemical impedance spectroscopy provides a new approach for model based SOC estimation, and researchers at home and abroad have also conducted many studies.
Analyzing the electrochemical impedance spectrum characteristics under different SOC conditions and using EIS curves to solve the fractional order model parameters, the estimation and solution of battery SOC were achieved, but the offset of electrochemical impedance spectrum under complex operating conditions was not considered. Similarly, the electrochemical impedance spectroscopy was used to identify the model parameters and compared with the particle swarm optimization algorithm to verify the accuracy of the electrochemical impedance spectroscopy method. However, it was believed that the influence of temperature on the EIS curve was taken into account. And temperature will affect the insertion and detachment process of lithium ions at the battery electrode, as well as the diffusion rate of ions, and seriously affect the maximum capacity of the battery. At the same time, the low-frequency measurement time of electrochemical impedance spectroscopy is too long to meet the short-term delay requirements of online measurement.
From this, it can be seen that there is still a lack of research on the impact of battery temperature changes on the internal electrochemical reactions of batteries in the current field. Therefore, it is of great significance to explore the impact of temperature on the impedance of lithium batteries, screen out characteristic frequencies that can effectively characterize battery SOC, reduce measurement time, and explore lithium battery SOC estimation technology solutions that can meet the demand for online estimation of short-term delay.
Based on this, this article proposes a battery SOC estimation method that considers the influence of temperature. This method explores the influence of temperature on the numerical information of battery electrochemical impedance spectrum through EIS testing at different temperatures, and selects the characteristic frequency that can characterize the battery SOC. Finally, with the help of characteristic frequency impedance numerical information and measurement of battery operating temperature, accurate estimation of lithium battery SOC over a wide temperature range is achieved.
1.Test Plan
This article selects the energy storage lithium battery from Ningde Times Company. The rated capacity of the battery is 20 Ah, the rated voltage is 3.2 V, the upper limit cutoff voltage is 3.65 V, and the lower limit cutoff voltage is 2.5 V. The basic parameters of the battery are shown in Table 1. Before the experiment, the lithium battery was pretreated with the aim of activating the positive and negative electrode active materials. The specific operation steps are as follows: Charge the new battery at 25 ℃ with a constant current of 0.5C to the cut-off voltage of 3.65 V, then charge at a constant voltage of 3.65 V until the current drops to 0.05C, let it stand for 1 hour, and discharge at a constant current of 0.5C to the lower cut-off voltage of 2.5 V. Then repeat the constant current charging constant voltage charging constant current discharging operation.
| Parameter Type | Parameter indicators |
| Rated voltage | 3.2 V |
| Charging voltage | 3.65 V |
| Discharge cut-off voltage | 2.5 V |
| Rated voltage | 3.2 V |
| Standard capacity | 20 Ah |
| Internal resistance (AC 1 k Ω) | Less than 30 m Ω |
| Storage temperature | -20 ℃~50 ℃ |
| Standard capacity | 20 Ah |
After pre-treatment, test the EIS of batteries at different temperatures and SOC. The steps are as follows: Firstly, perform a standard cycle (1C constant current constant voltage charging -1C constant current discharge) on the battery at room temperature (25 ℃), and record the current maximum battery capacity Qnow. Afterwards, an electrochemical workstation was used to conduct electrochemical impedance spectroscopy tests on a new battery with SOC=100% at temperatures of 15 ℃, 25 ℃, 35 ℃, and 45 ℃. Then, a 0.5C battery was used to release 0.05Qnow capacity, and EIS tests at different temperatures were repeated. During the experiment, the working temperature of the battery can be controlled by an explosion-proof constant temperature box with an accuracy of ± 1 ℃; The SOC of lithium batteries is controlled using the PARSTAT MS electrochemical workstation, which can also perform EIS testing. The excitation frequency range selected for EIS testing is 0.01 Hz to 1000 Hz, and the excitation voltage amplitude is 10 mV. In this article, EIS tests were conducted on batteries with SOC ranges of 100%~0, intervals of 5% SOC, and operating temperatures of 15 ℃, 25 ℃, 35 ℃, and 45 ℃.
2.Test results and analysis
2.1 Characteristics of EIS changes with SOC
To analyze the variation of EIS curve with changes in battery SOC state, the EIS curve of 100%~10% SOC at 25 ℃ is depicted, as shown in Figure 1. From the figure, it can be seen that as the SOC decreases, the EIS curve in the high-frequency region of the lithium battery gradually shifts to the right. This indicates that as the SOC decreases, the Ohmic internal resistance of the battery gradually increases. Ohmic internal resistance mainly reflects the diffusion of lithium ions in the electrolyte and the diffusion and migration of electrons in the electrode conductive agent and adhesive [18]. The increase in Ohmic internal resistance may be due to the diffusion and migration of lithium ions in the battery towards the positive electrode as the SOC decreases, resulting in a large amount of lithium ions embedded in the positive electrode active material. The increase in lithium ion concentration at the positive electrode makes it difficult for lithium ions to migrate from the electrolyte to the positive electrode, resulting in an increase in the ohmic internal resistance of the battery.
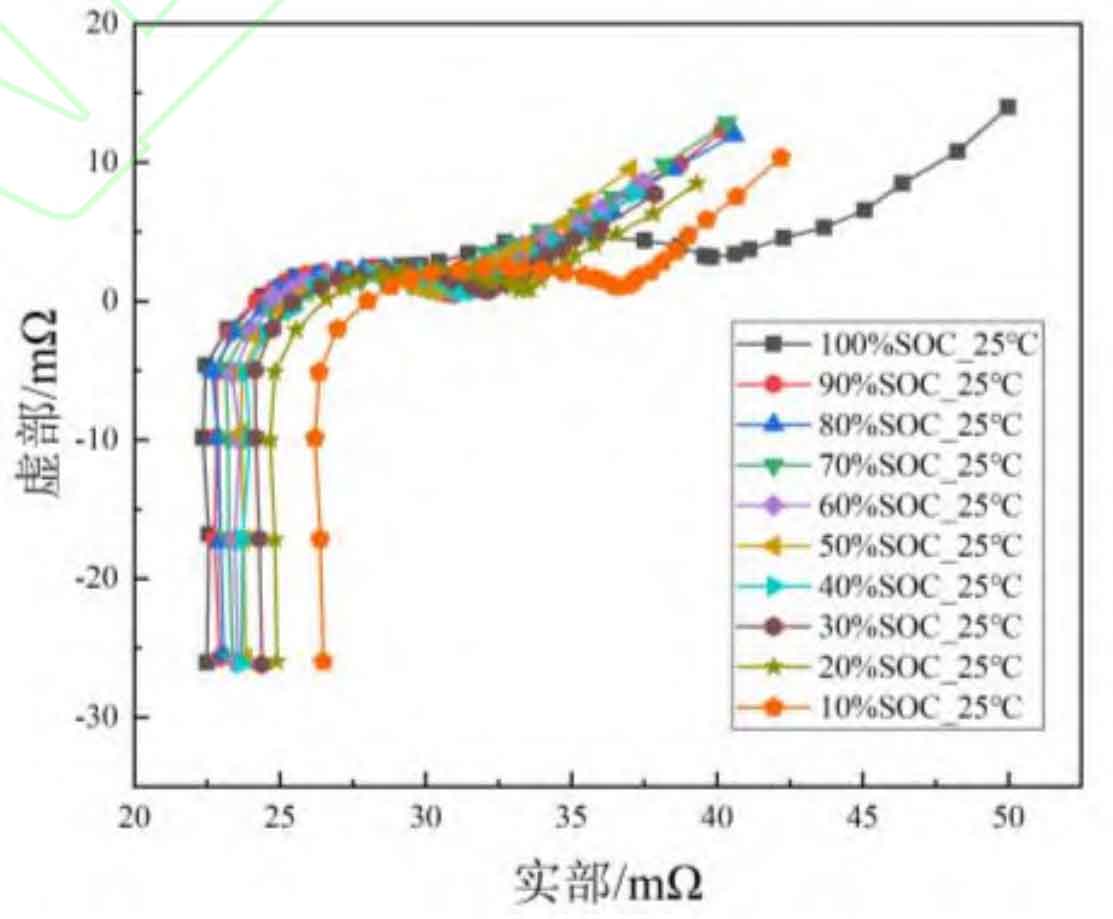
In addition, as shown in Figure 1, the oblique line in the low-frequency region shows a phenomenon of first decreasing and then increasing, while the low-frequency region (f<1 Hz) characterizes the solid-state diffusion process of lithium ions in the electrode material. This may be due to the large amount of lithium ions embedded in the battery electrode at high and low SOC, which has a significant polarization effect and hinders the diffusion process of lithium ions inside the electrode. Therefore, the low-frequency impedance shows a phenomenon of first decreasing and then increasing.
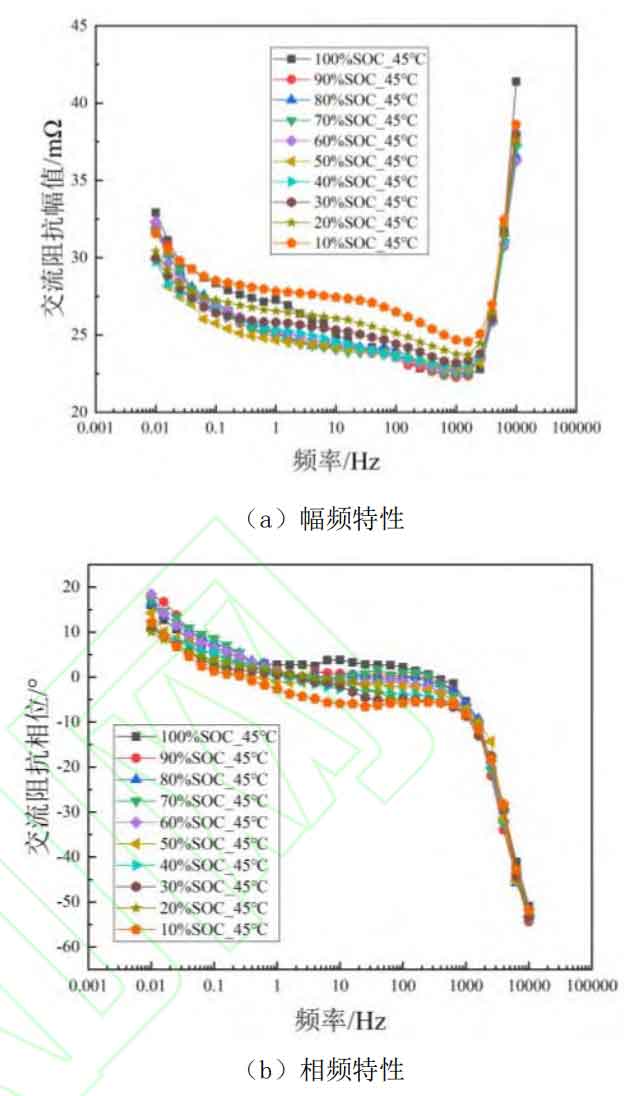
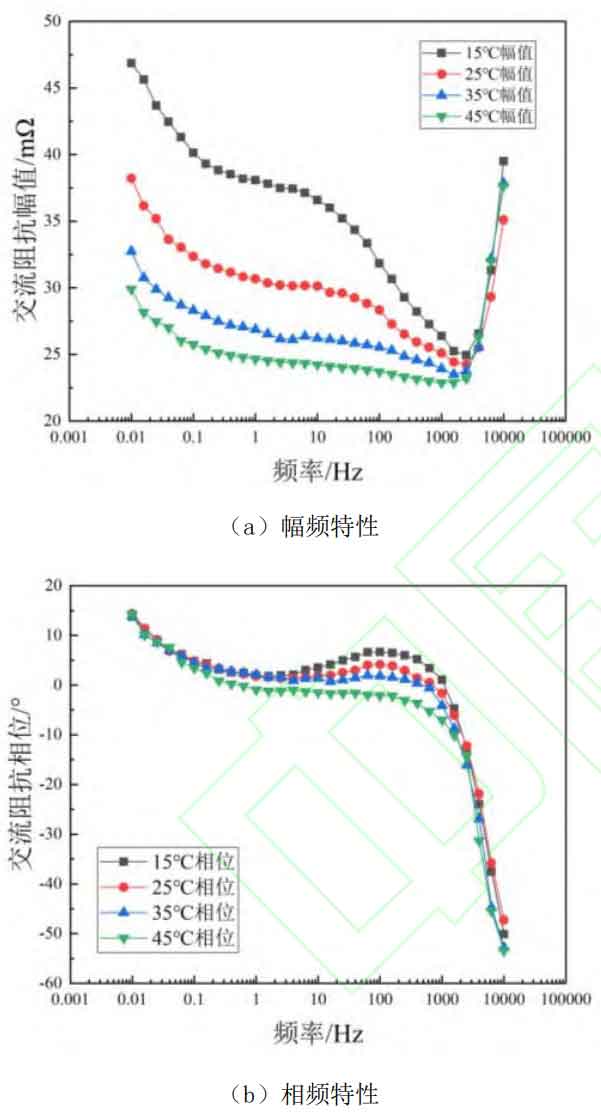
Although electrochemical impedance spectroscopy can achieve simultaneous characterization of different electrochemical processes, due to the close time constants of different polarization processes, the influence of battery SOC state on specific processes and frequency ranges of impedance spectroscopy cannot be analyzed through the Nyquist plot. In addition, to investigate the influence of SOC on EIS at different temperatures, this article tested the AC impedance spectra of lithium batteries at 15 ℃, 25 ℃, 35 ℃, and 45 ℃ environments. To screen the characteristic frequencies that can effectively characterize the SOC of lithium batteries at different temperatures, the amplitude frequency and phase frequency plots of AC internal resistance at low temperature (15 ℃), room temperature (25 ℃), and high temperature (45 ℃) were plotted as a function of SOC, as shown in Figures 2-4. Among them, subgraphs (a) in Figures 2-4 are amplitude frequency plots, representing the variation of AC impedance amplitude with SOC at different temperatures, while subgraphs (b) are phase frequency plots, representing the variation of impedance phase shift angle with SOC at different temperatures, i.e. the battery response signal leading/lagging excitation signal.
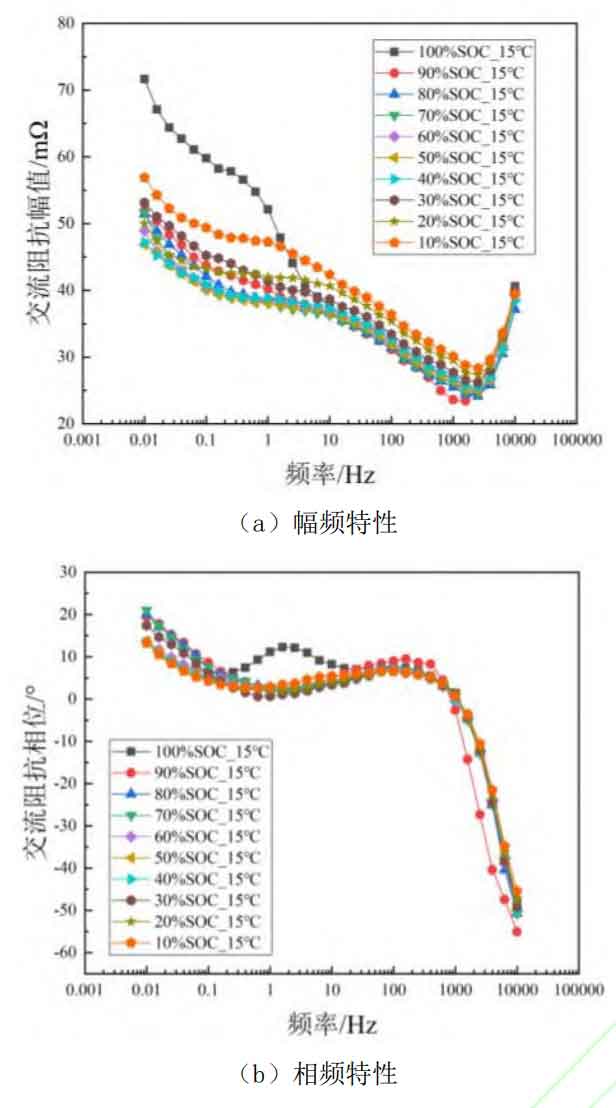
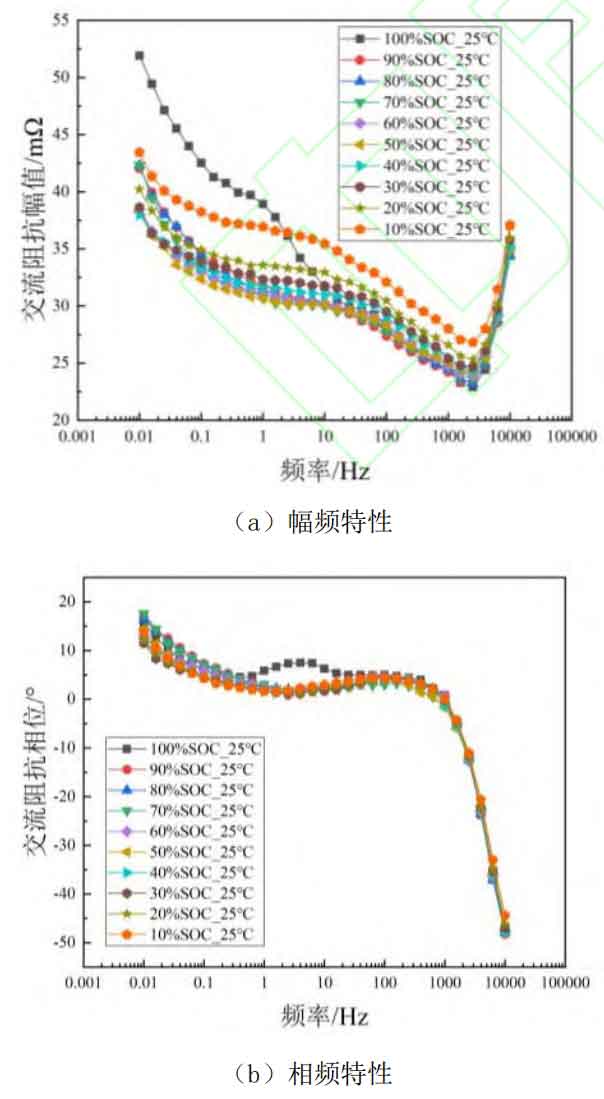
From Figures 2 to 4, it can be seen that at different temperatures, SOC has little effect on the impedance amplitude and phase of the high-frequency range (>1 kHz), because the impedance in the high-frequency region mainly represents the contact inductance between the battery fixture and the battery electrode. The inductance is mainly related to the contact area and contact position between the fixture and the metal electrode current collector, and is not related to the level of battery SOC or operating temperature. Therefore, the high-frequency region cannot effectively characterize the SOC state of the battery. And as shown in Figures 2 (b) and 3 (b), SOC has almost no effect on the phase shift angle of AC impedance in other frequency ranges at low and room temperatures. This indicates that in the lower temperature range, the SOC value of the battery does not affect the leading or lagging degree of the battery response signal to the excitation signal.
At high temperatures (45 ℃), the impedance phase shift angle changes with the change of SOC and shows a phenomenon of decreasing with the decrease of SOC. This proves that at high temperatures, the AC impedance phase angle of the battery can be used for estimating and characterizing the SOC value of the battery. However, in combination with the aforementioned low-temperature and room temperature environments, the phase shift angle of AC impedance is not suitable as a characteristic quantity for characterizing battery SOC over a wide temperature range. For the impedance amplitude, it can be seen from Figures 2 (a), 3 (a), and 4 (a) that the influence of battery SOC cannot be ignored, and at f<10 Hz, it shows a phenomenon of first decreasing and then increasing as SOC decreases. Similarly, at low and room temperatures, 100% SOC shows a sudden increase trend at low frequencies, which may be caused by concentration polarization inside the battery. However, over a wide temperature range, in the range of 10 Hz to 1000 Hz, the impedance amplitude shows a regular change with the variation of SOC. This indicates that impedance amplitude can be used to characterize the SOC value of the battery over a wide temperature range.
2.2 Effect of temperature on EIS curve
Temperature changes can affect a series of electrochemical reaction processes such as oxidation and reduction inside the battery, and EIS can simultaneously characterize many electrochemical reactions inside the battery. Therefore, the influence of temperature on EIS cannot be ignored. The impedance amplitude and phase shift angle at different temperatures (15 ℃~45 ℃) at 50% SOC are compared as shown in Figure 5. Figure 5 (a) shows the amplitude frequency plot, and Figure 5 (b) shows the phase frequency plot.
From Figure 5, it can be seen that when the frequency is below 1 Hz, the battery temperature has almost no effect on the impedance phase shift angle. However, when the frequency is higher than 10Hz, the influence of battery temperature on the impedance phase shift angle cannot be ignored. Meanwhile, as shown in Figure 5 (a), the influence of temperature on impedance amplitude is relatively regular. As the temperature increases, the impedance amplitude of the battery gradually decreases, which may be due to the acceleration of ion movement and the acceleration of reversible electrochemical reactions inside the battery, resulting in a decrease in the AC impedance of the battery. Therefore, in order to effectively consider the impact of temperature and combine the EIS amplitude and phase comparison under different SOC in 3.1, impedance amplitudes with excitation frequencies of 10 Hz to 1000 Hz can be selected for SOC estimation. To simplify the model and reduce the time required for battery EIS testing, this paper selects impedance amplitudes at excitation frequencies of 10 Hz, 100 Hz, and 1000 Hz as characteristic frequencies to characterize the battery SOC.
3.State of Charge Estimation Model
From the above analysis results, it can be concluded that the SOC of lithium batteries can be estimated in real-time based on their actual operating temperature and electrochemical impedance amplitude at characteristic frequency points. This section aims to accurately evaluate the impact of operating temperature. Using an actual lithium battery used in a 125 kW energy storage bin of a certain energy storage power plant as the test object, electrochemical impedance spectra were tested at different temperatures and SOC using an electrochemical workstation in the laboratory. Then, a deep neural network algorithm was used to test the battery operating temperature, 10 Hz, 100 Hz The electrochemical impedance amplitudes at three characteristic frequency points at 1000 Hz were used as input parameters to estimate the SOC of energy storage lithium batteries.
3.1 Deep neural network algorithm
A deep neural network is a deep learning model composed of multiple layers of neurons, typically consisting of input layers, hidden layers, output layers, and other structures. The basic unit of a neural network model is called a neuron, and its abstract schematic is shown in Figure 6.
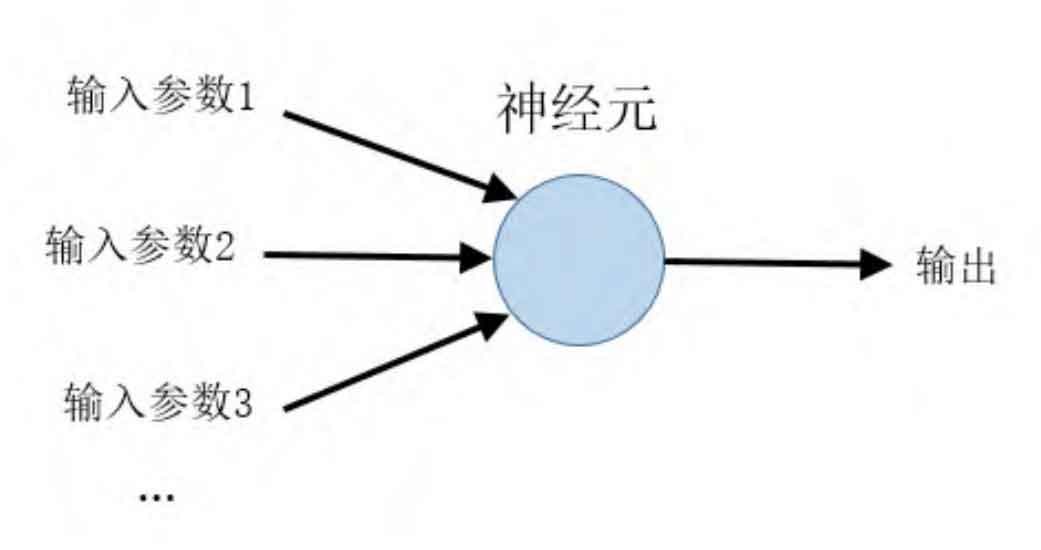
The neuron itself is an activation function model, which can generally be represented as:

Each neuron has a weight coefficient in the network. Through learning the training samples through the neural network model, the activation function and weight coefficient of the neuron are continuously calculated and iterated, and ultimately the mapping between input and output parameters is obtained. Deep neural network (DNN) is a process of mapping and transmitting parameters between neurons, pushing input parameters layer by layer from the input layer to the output layer, and finally obtaining output results. The implementation steps of DNN are as follows:
(1) Set the total number of layers N. The first layer is the input layer, corresponding to the input vector x; The Nth layer is the output layer, denoted as a ^ N; The middle layer is a hidden layer, with the weight coefficient matrix corresponding to the output layer denoted as W and the bias matrix denoted as b;
(2) Initialize setting a1=x; Calculate equation (2) starting from n=2:

(3) Obtain the trained neural network and output the result a ^ N.
Among them, the forward propagation of DNN determines the calculation of output values, but the update of weight coefficient matrix W and bias matrix b depends on backpropagation. The steps for updating W and b are as follows:
(1) Initialize activation function σ (z) Loss function L, iteration step r, error threshold ε;
(2) When the number of iterations is greater than 1 but less than k:
(a) Initialize a ^ 1=x; Calculate equation (2) during forward propagation;
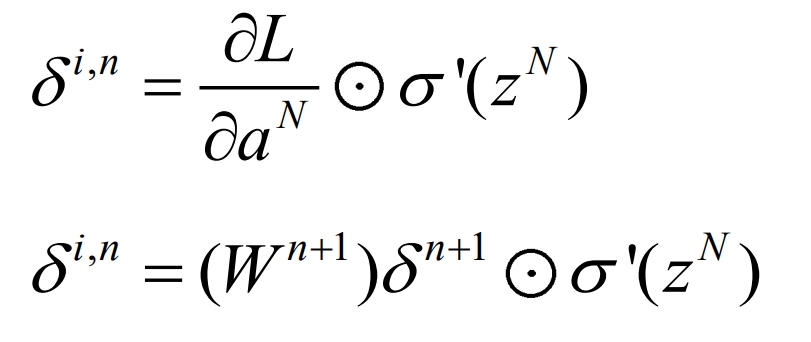
(b) After completing the forward propagation iteration, calculate the reverse loss δ i. N, as shown in equations (3) and (4):
(c) Based on reverse loss δ i. Calculate the new iterative values of W and b for n, as shown in equations (5) and (6):

(3) When the changes in W and b are less than the stop iteration threshold s, the iteration ends;
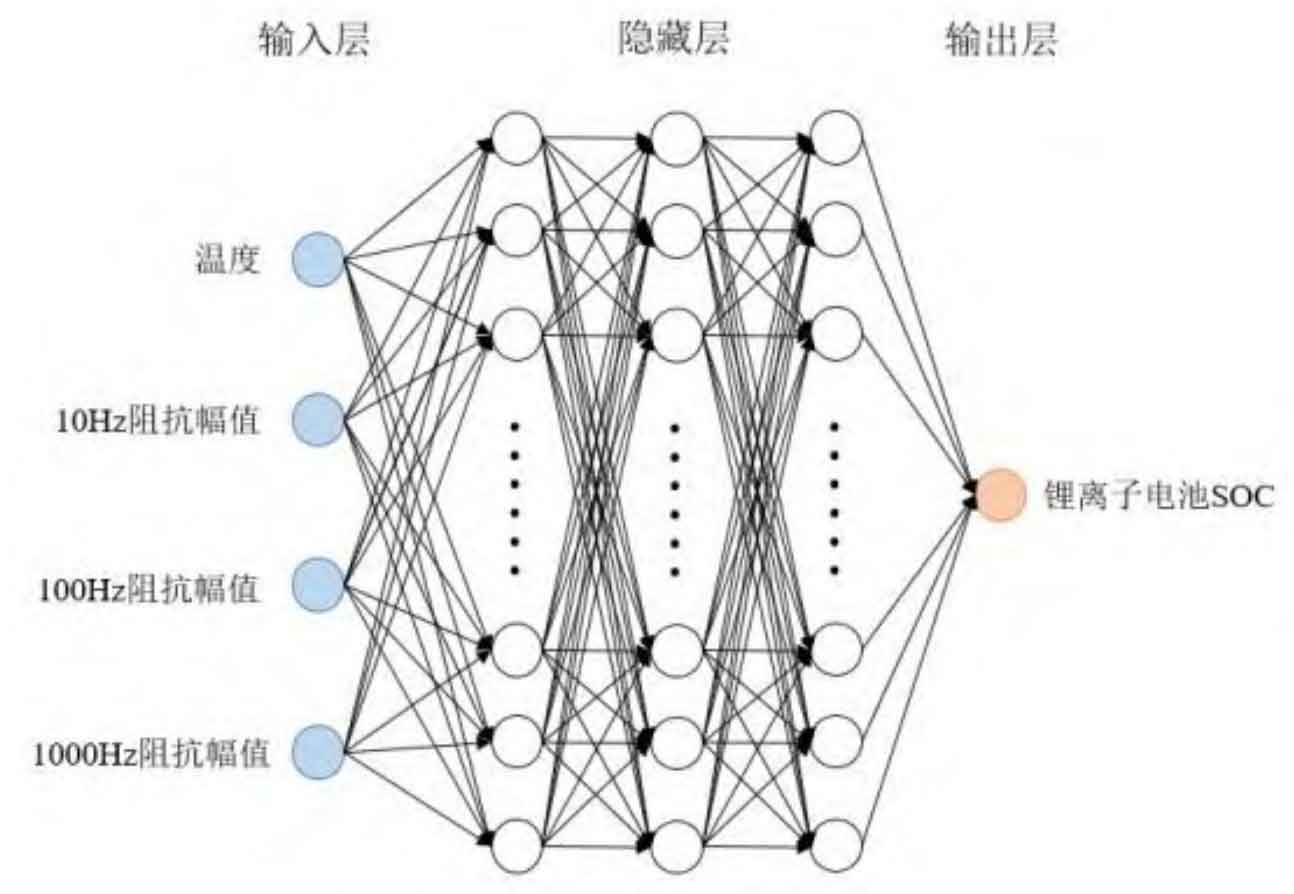
In this model, a total of 5 layers of network structure are set up, with 4 neurons in the input layer, 256 neurons in each hidden layer, and 1 neuron in the output layer. The number of iterations is 200, and the iteration step size is 0.001. The training samples were 20 individual lithium batteries from the 125 kW energy storage bin of the energy storage station. The electrochemical impedance spectra of the batteries were tested at 15 ℃, 20 ℃, 25 ℃, 30 ℃, 35 ℃, 40 ℃, and 45 ℃, respectively. A total of 140 sets of data were collected, including the full frequency AC impedance data of the battery at the corresponding temperature range of 0-100% SOC. The schematic diagram of the deep neural network model is shown in Figure 7.
(4) Obtain the trained neural network and output the result a ^ N.
3.2 Model Effect Verification
The training process curve of the DNN model for estimating the SOC of lithium batteries is shown in Figure 8.
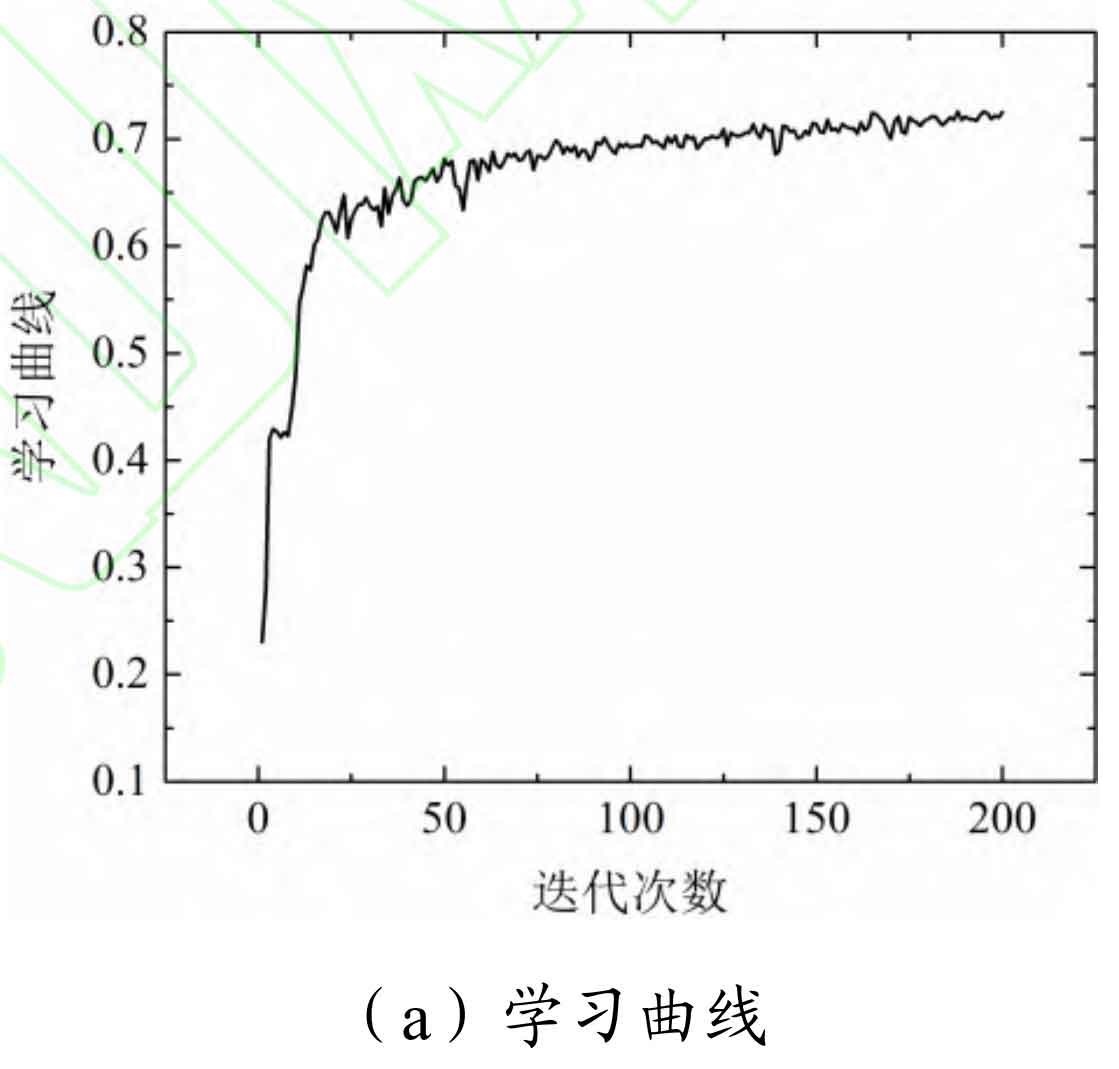
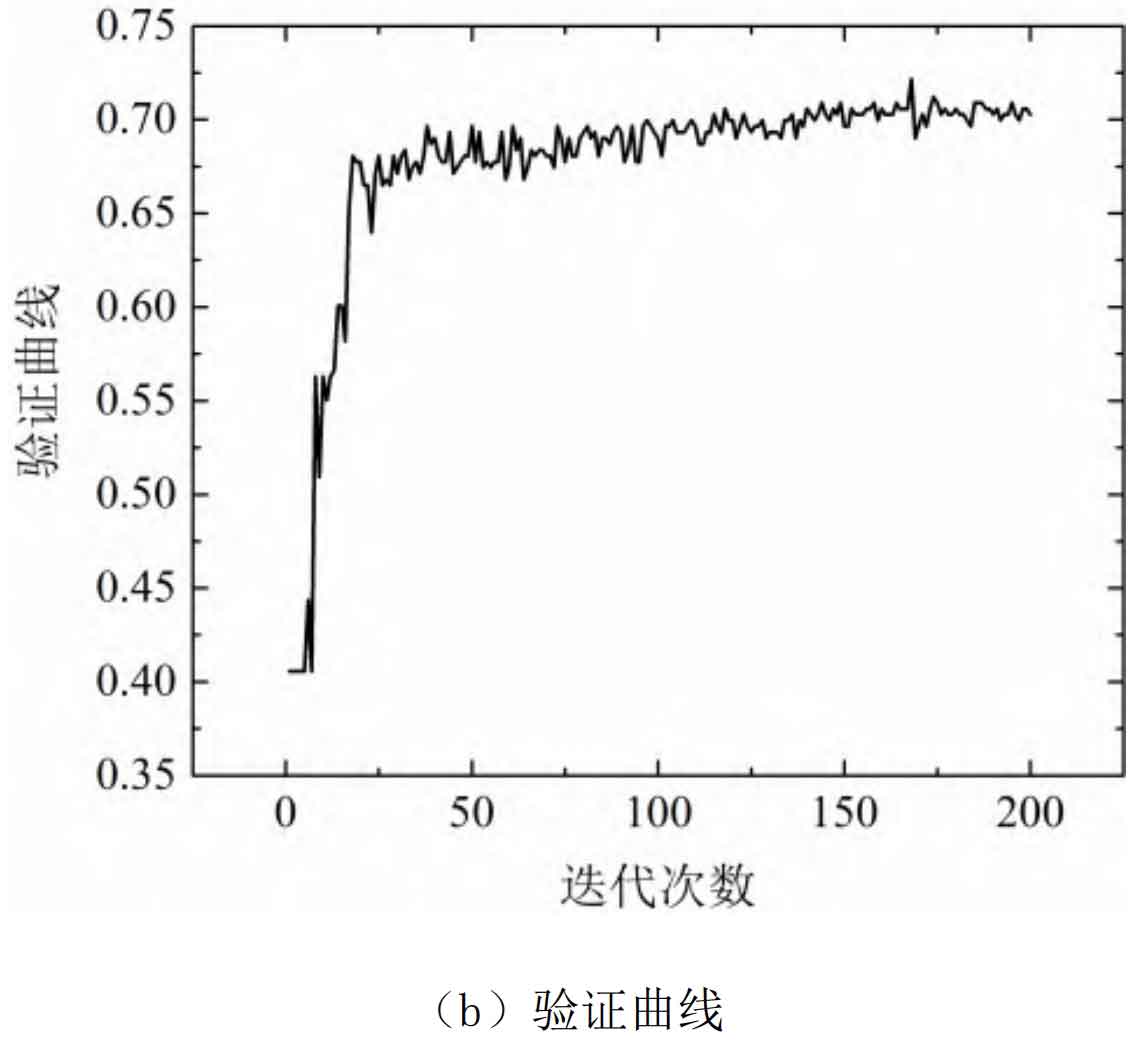
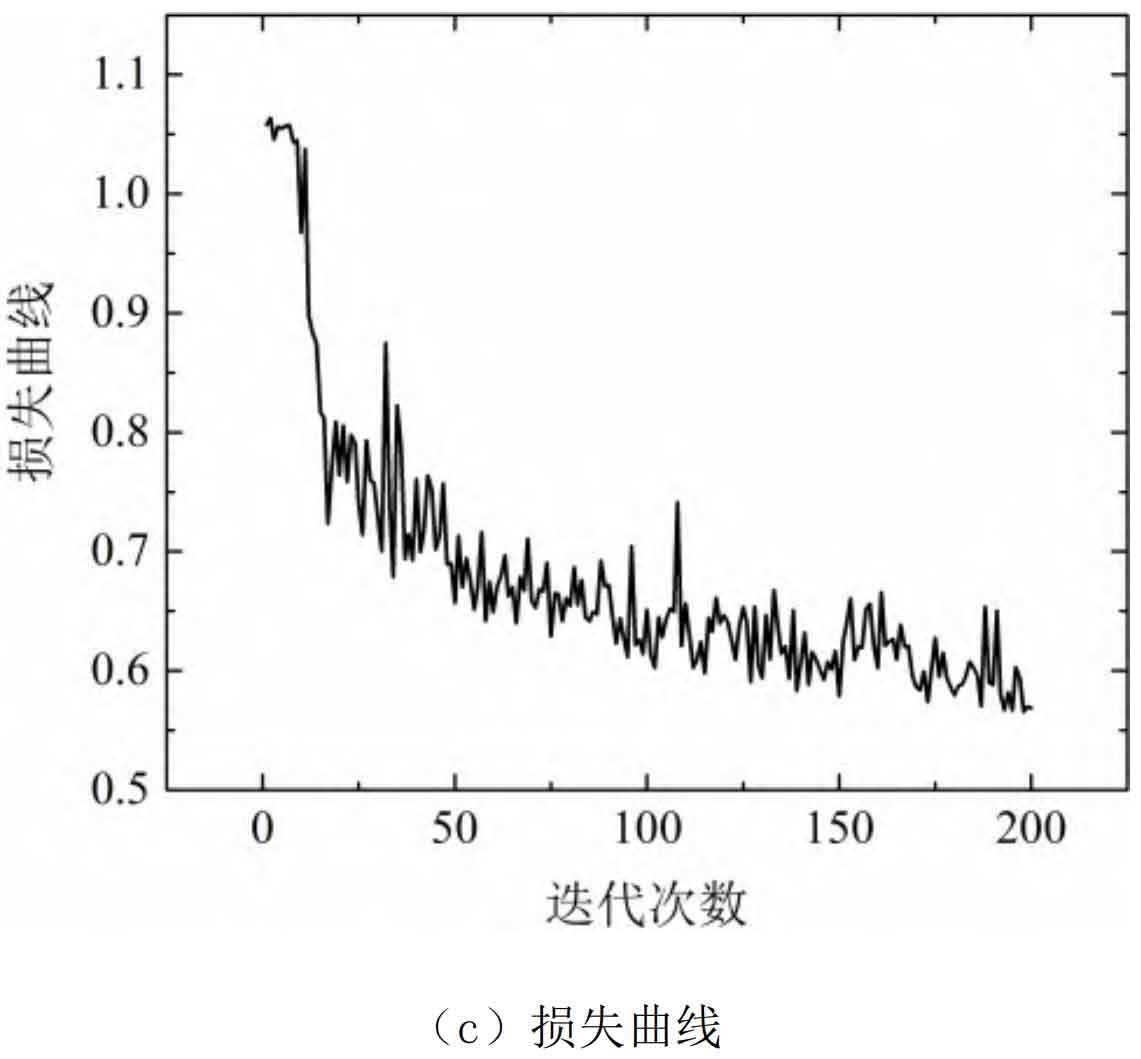
From Figure 8, it can be seen that this model has a good learning effect on the training samples, and after 20 iterations, the learning effect has basically reached stability. The training set was tested using a 10 fold cross validation method, and the average absolute percentage error of the model for the training samples was estimated to be 3.12%, with a maximum error of 3.81%.
Subsequently, based on the same data source as the training samples, an additional 20 sets of data were used as the test set to verify the predictive performance of the SOC estimation model. The obtained test results are shown in Figure 9.
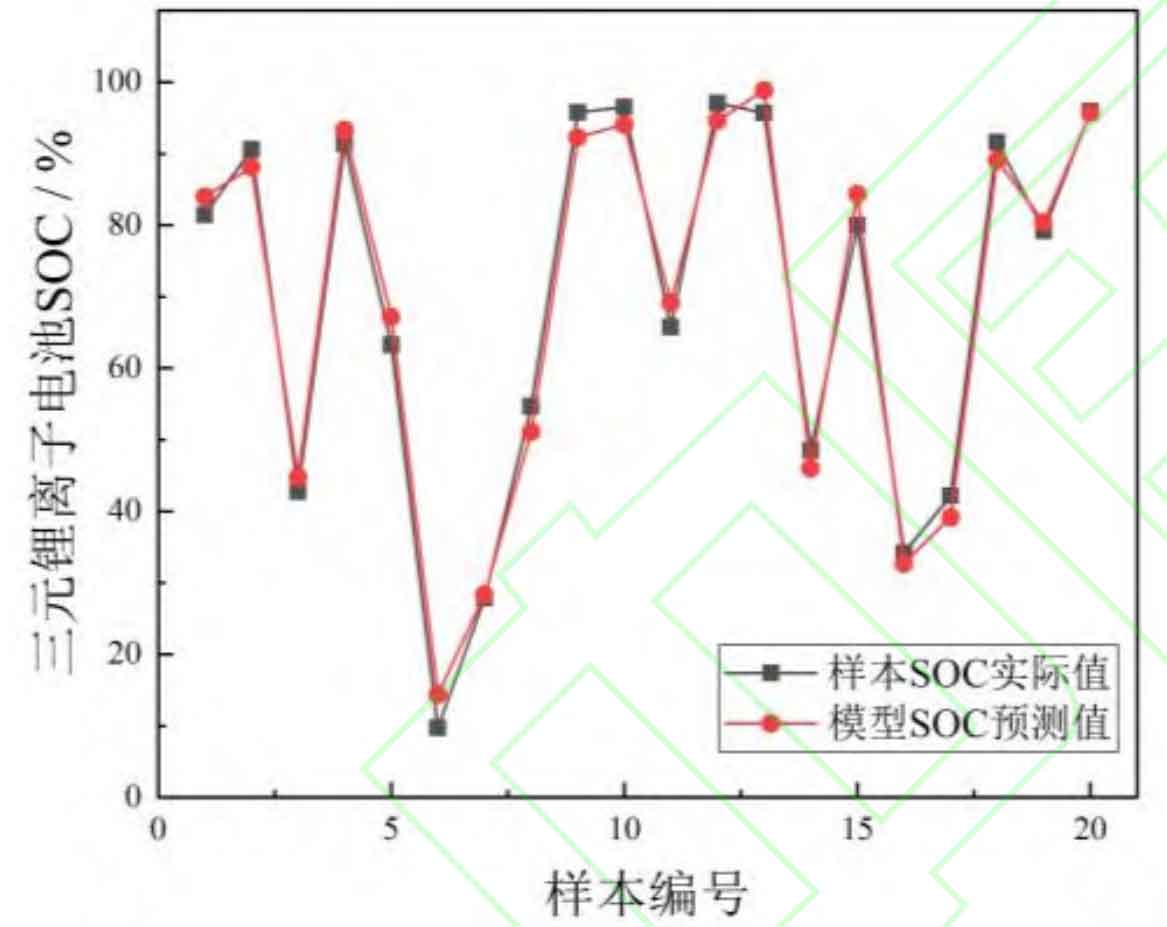
In the validation of the test set, the average absolute percentage error of the lithium battery SOC estimation model constructed in this article for the test samples is 2.59%, with a maximum error of 3.82% at sample 6. Compared with the results of cross validation, it can be seen that the prediction error of the model for the test samples is not significantly different from that of the training samples, so there is no overfitting problem. At the same time, the error between the SOC prediction results and the actual values of the model is within an acceptable range, indicating good estimation performance. From this, it can be concluded that the amplitude of electrochemical impedance spectroscopy can effectively characterize the battery SOC, avoid overcharging and over discharging faults, and effectively improve battery safety.
4.Conclusion
In this paper, a method based on electrical impedance spectroscopy (EIS) for estimating the impedance characteristics of lithium batteries under different SOC conditions is proposed. By applying a wide frequency small amplitude disturbance signal to both ends of a lithium battery, the AC impedance of the battery over a wide frequency range can be obtained. Test and compare the electrochemical impedance spectra of batteries at different SOC and temperatures, and obtain:
(1) At room temperature and low temperature, the phase angle of the electrochemical impedance spectrum of the battery does not change with changes in SOC, while at high temperature, the phase angle changes regularly with changes in SOC. The amplitude of AC impedance changes significantly with changes in SOC values over a wide temperature range;
(2) At different temperatures, the amplitude and phase angle of AC impedance significantly decrease with increasing temperature. The impedance amplitudes at 10 Hz, 100 Hz, and 1000 Hz over a wide temperature range can effectively characterize the battery SOC and serve as characteristic parameters for battery SOC estimation;
(3) The deep neural network constructed lithium battery SOC estimation model can achieve battery SOC estimation over a wide temperature range, with an average prediction error of nearly 3%.
The article measures and analyzes the electrochemical impedance spectra of batteries under different operating conditions, thereby achieving accurate estimation of SOC over a wide temperature range, providing a new approach for SOC estimation of energy storage lithium batteries. However, research is only focused on conventional operating conditions, and the electrochemical impedance spectra characteristics of batteries throughout their entire life cycle, as well as the impedance and SOC characteristics under extreme temperature conditions, are worth further systematic exploration in the future.