1. Measurement of overall efficiency
The main direction of solar inverter design is also to address energy consumption issues, continuously optimizing to achieve higher inverter efficiency. Based on the various problems encountered in the actual development process of the entire machine, a modification and optimization design plan for the above problems has been formulated. The main technologies and existing problems involved in the above have been optimized and innovatively designed to achieve an improvement in the working performance and inverter efficiency of the entire machine.
Under standard testing conditions, the measurement data of solar inverter efficiency and the overall efficiency test curve of the prototype are shown in Figures 1, 2, and 3. Among them, Figure 1 shows the test effect of dynamic MPPT efficiency. In the experiment, the output DC voltage is 45V, and the maximum power point is at the DC voltage of 38.75V, with a maximum power of 110.21W. The power point matched by the MPPT control algorithm is at the DC voltage of 38.69V, and the output power is 109.79W. At full load, the dynamic MPPT efficiency is 99.62%, which is 30.6% higher than the dynamic MPPT efficiency of the original solar inverter, Greatly optimized the overall performance and efficiency indicators of solar inverters.
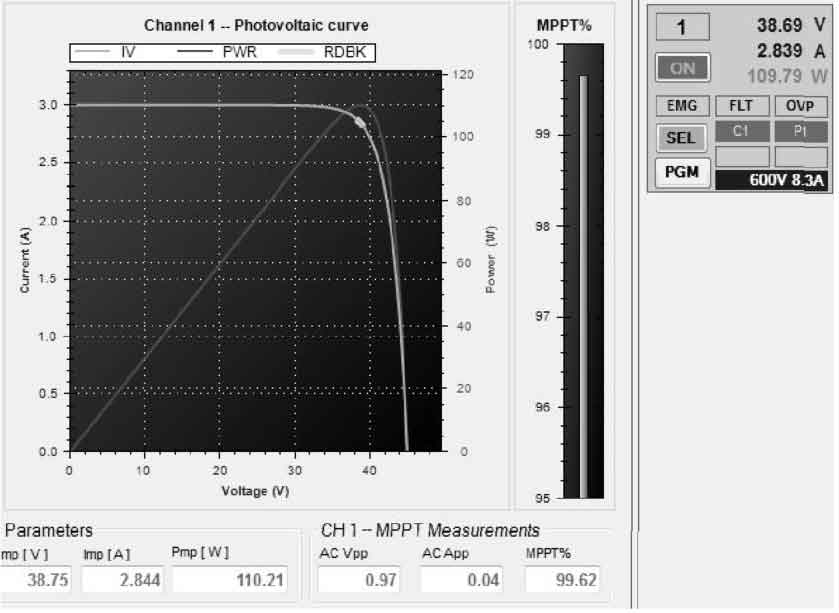
Figure 2 shows the overall efficiency test curve of the prototype, where p represents the output power. The solar inverter can achieve good output power within the load range, with a full load output efficiency of 97.2%.
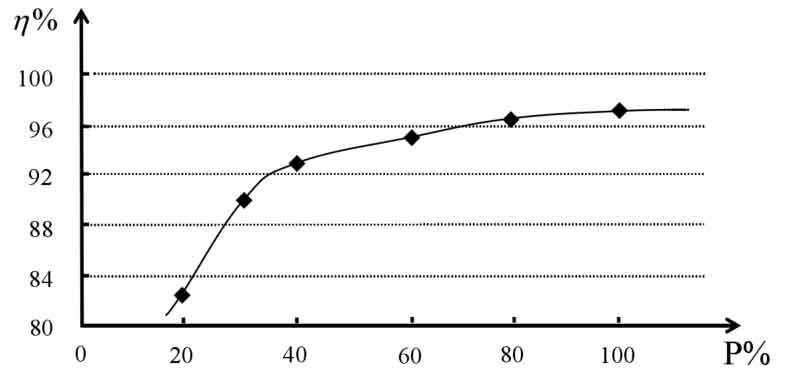
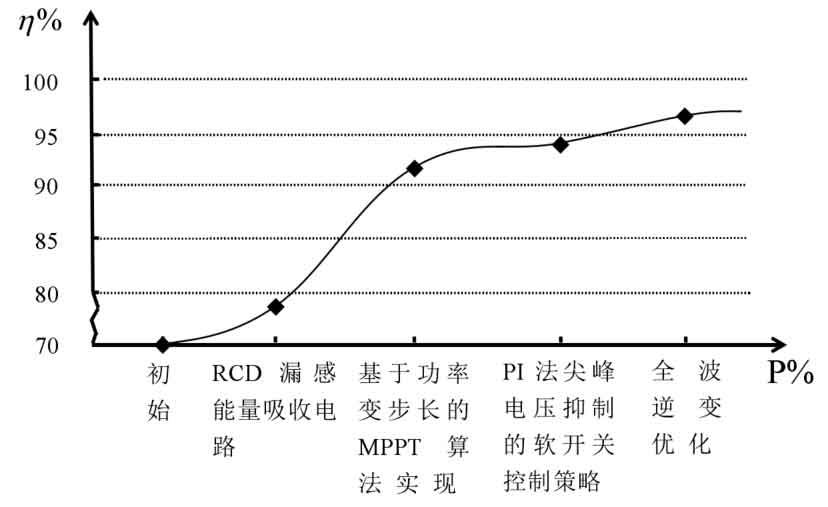
Figure 3 shows the historical variation curve of the inverter output efficiency of the prototype at full load. Due to insufficient consideration of energy consumption caused by leakage inductance energy loss, maximum power point tracking effect, peak voltage energy consumption, unclear soft switching, and full wave zero point drop during the design process of the original solar inverter, the overall inverter efficiency of the solar inverter is only about 69%, and even cannot meet the design requirements of a three-level grid connected solar micro inverter. After adding the RCD leakage energy absorption circuit, the overall inverter efficiency of the solar inverter increased to about 79%. After implementing the MPPT control algorithm based on power variable step size, the overall inverter efficiency of the solar inverter increased to about 92%, meeting the efficiency design requirements of the three-level solar inverter. Afterwards, By implementing a soft switching control strategy that suppresses peak voltage using PI method and a full wave inverter strategy that combines controllable silicon H-bridge with external interrupt algorithm, the full load inverter efficiency of the solar inverter has increased to 97.2%, which is 28.2% higher than the previous full load inverter efficiency.
According to the classification of solar micro inverters, it can be known that the overall efficiency of the grid connected solar micro inverter with a transformer designed in this article is greater than 95%, belonging to level 1 efficiency. This level classification further proves the reliability and efficiency of the multiple innovative optimization control strategies proposed in this paper from a data perspective, and provides data support for the research content and innovation points set in this paper.
2. Technical correlation analysis
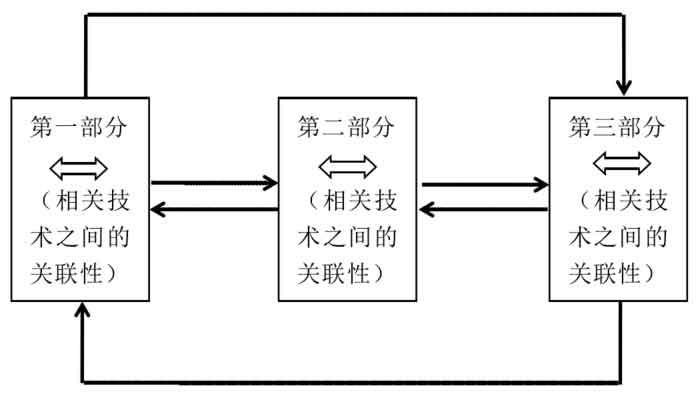
The development of solar micro inverters is a huge and complex system engineering project. The reason for this is that solar inverters are often designed in a loop by loop manner without clear boundaries, which makes it difficult to conduct qualitative or quantitative analysis of many practical problems. Therefore, in order to facilitate the qualitative treatment of related problems, this article divides the solar inverter system into three parts, namely the DC-DC part Power point tracking section and full wave inverter section.
Through searching and studying literature on many related technologies, it has been found that a considerable amount of research on solar inverters is based on simulation. For a certain technical problem involved, performance and efficiency can be improved through algorithm modification or replacement of simulation conditions. For example, for the MPPT algorithm, Most literature is based on the implementation of maximum power point tracking technology, optimizing previous algorithms and simulating the output MPPT efficiency to verify the authenticity of the optimization algorithm in improving MPPT efficiency. However, in the actual development process, it was found that the three parts of system design are not only related to each link within each part, but also to each other. Moreover, it is often not possible to independently analyze and optimize a certain problem, because the correctness of the subsequent processing results of each step depends on the correctness of the previous input results, and the output of the subsequent processing results will affect the results of the previous input, This forms a similar closed-loop problem for finding the optimal value, as shown in Figure 4. Most simulation experiments ignore similar interrelated phenomena and instead optimize a certain technique qualitatively and quantitatively, thereby reducing the authenticity and reliability of experimental data. Even if correlated effects are added to the simulation, the uncertainty brought by some special phenomena of hardware devices in specific environments makes the simulated data more of a theoretical data.
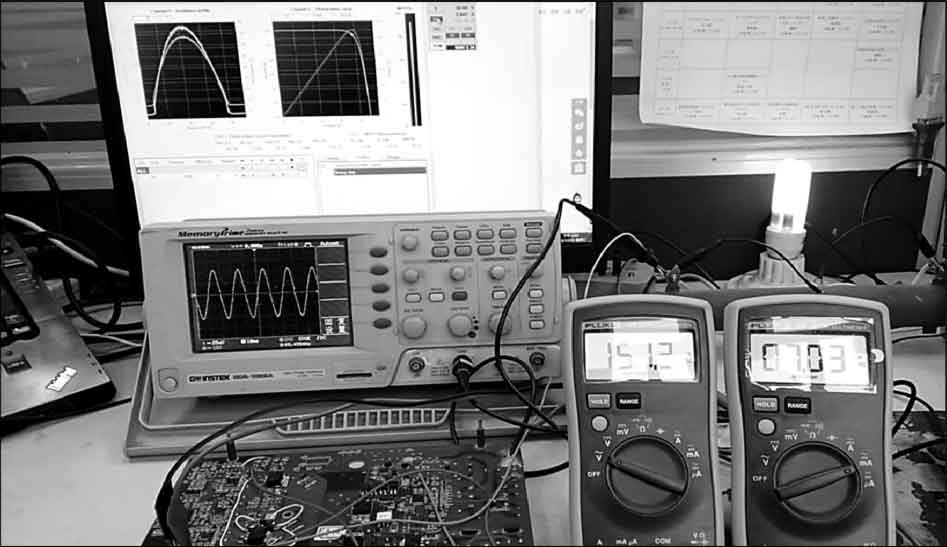
All measurement waveforms are actual collection and measurement of the input and output waveforms of the designed grid connected solar micro inverter hardware using an oscilloscope. The physical measurement diagram of the entire machine is shown in Figure 5. Among them, the upper computer interface displays the captured dynamic IV curve, real-time efficiency of dynamic MPPT, real-time input voltage and current values, and real-time input power values when inputting DC 45V 3A under custom environmental conditions. The oscilloscope displays the inverter output sine wave waveform, with a horizontal axis every 10ms and a vertical axis every 100V, which is an AC sine wave with a frequency of 50Hz and an effective value of 230V. Two multimeters are used to measure the AC voltage (V) and AC current (MA) values of the AC inverter output, respectively, for real-time measurement and statistical analysis of the inverter output power value. Grid connected appliances can work stably and safely.