
Sodium-ion batteries have emerged as a promising technology for grid-scale and residential energy storage systems owing to the abundant sodium resources, low material cost, and excellent low-temperature performance. However, the thermal safety and lifespan of these batteries are highly sensitive to operating temperature and temperature uniformity. In this work, I present a comprehensive study on the liquid cooling structure design and heat dissipation characteristics of a sodium-ion battery energy storage system. The research combines experimental characterization, electro-thermal modeling, CFD simulation, multi-objective optimization, and reduced-order modeling to achieve efficient and reliable thermal management. The following sections detail the methodology and key findings of this investigation.
1. Introduction
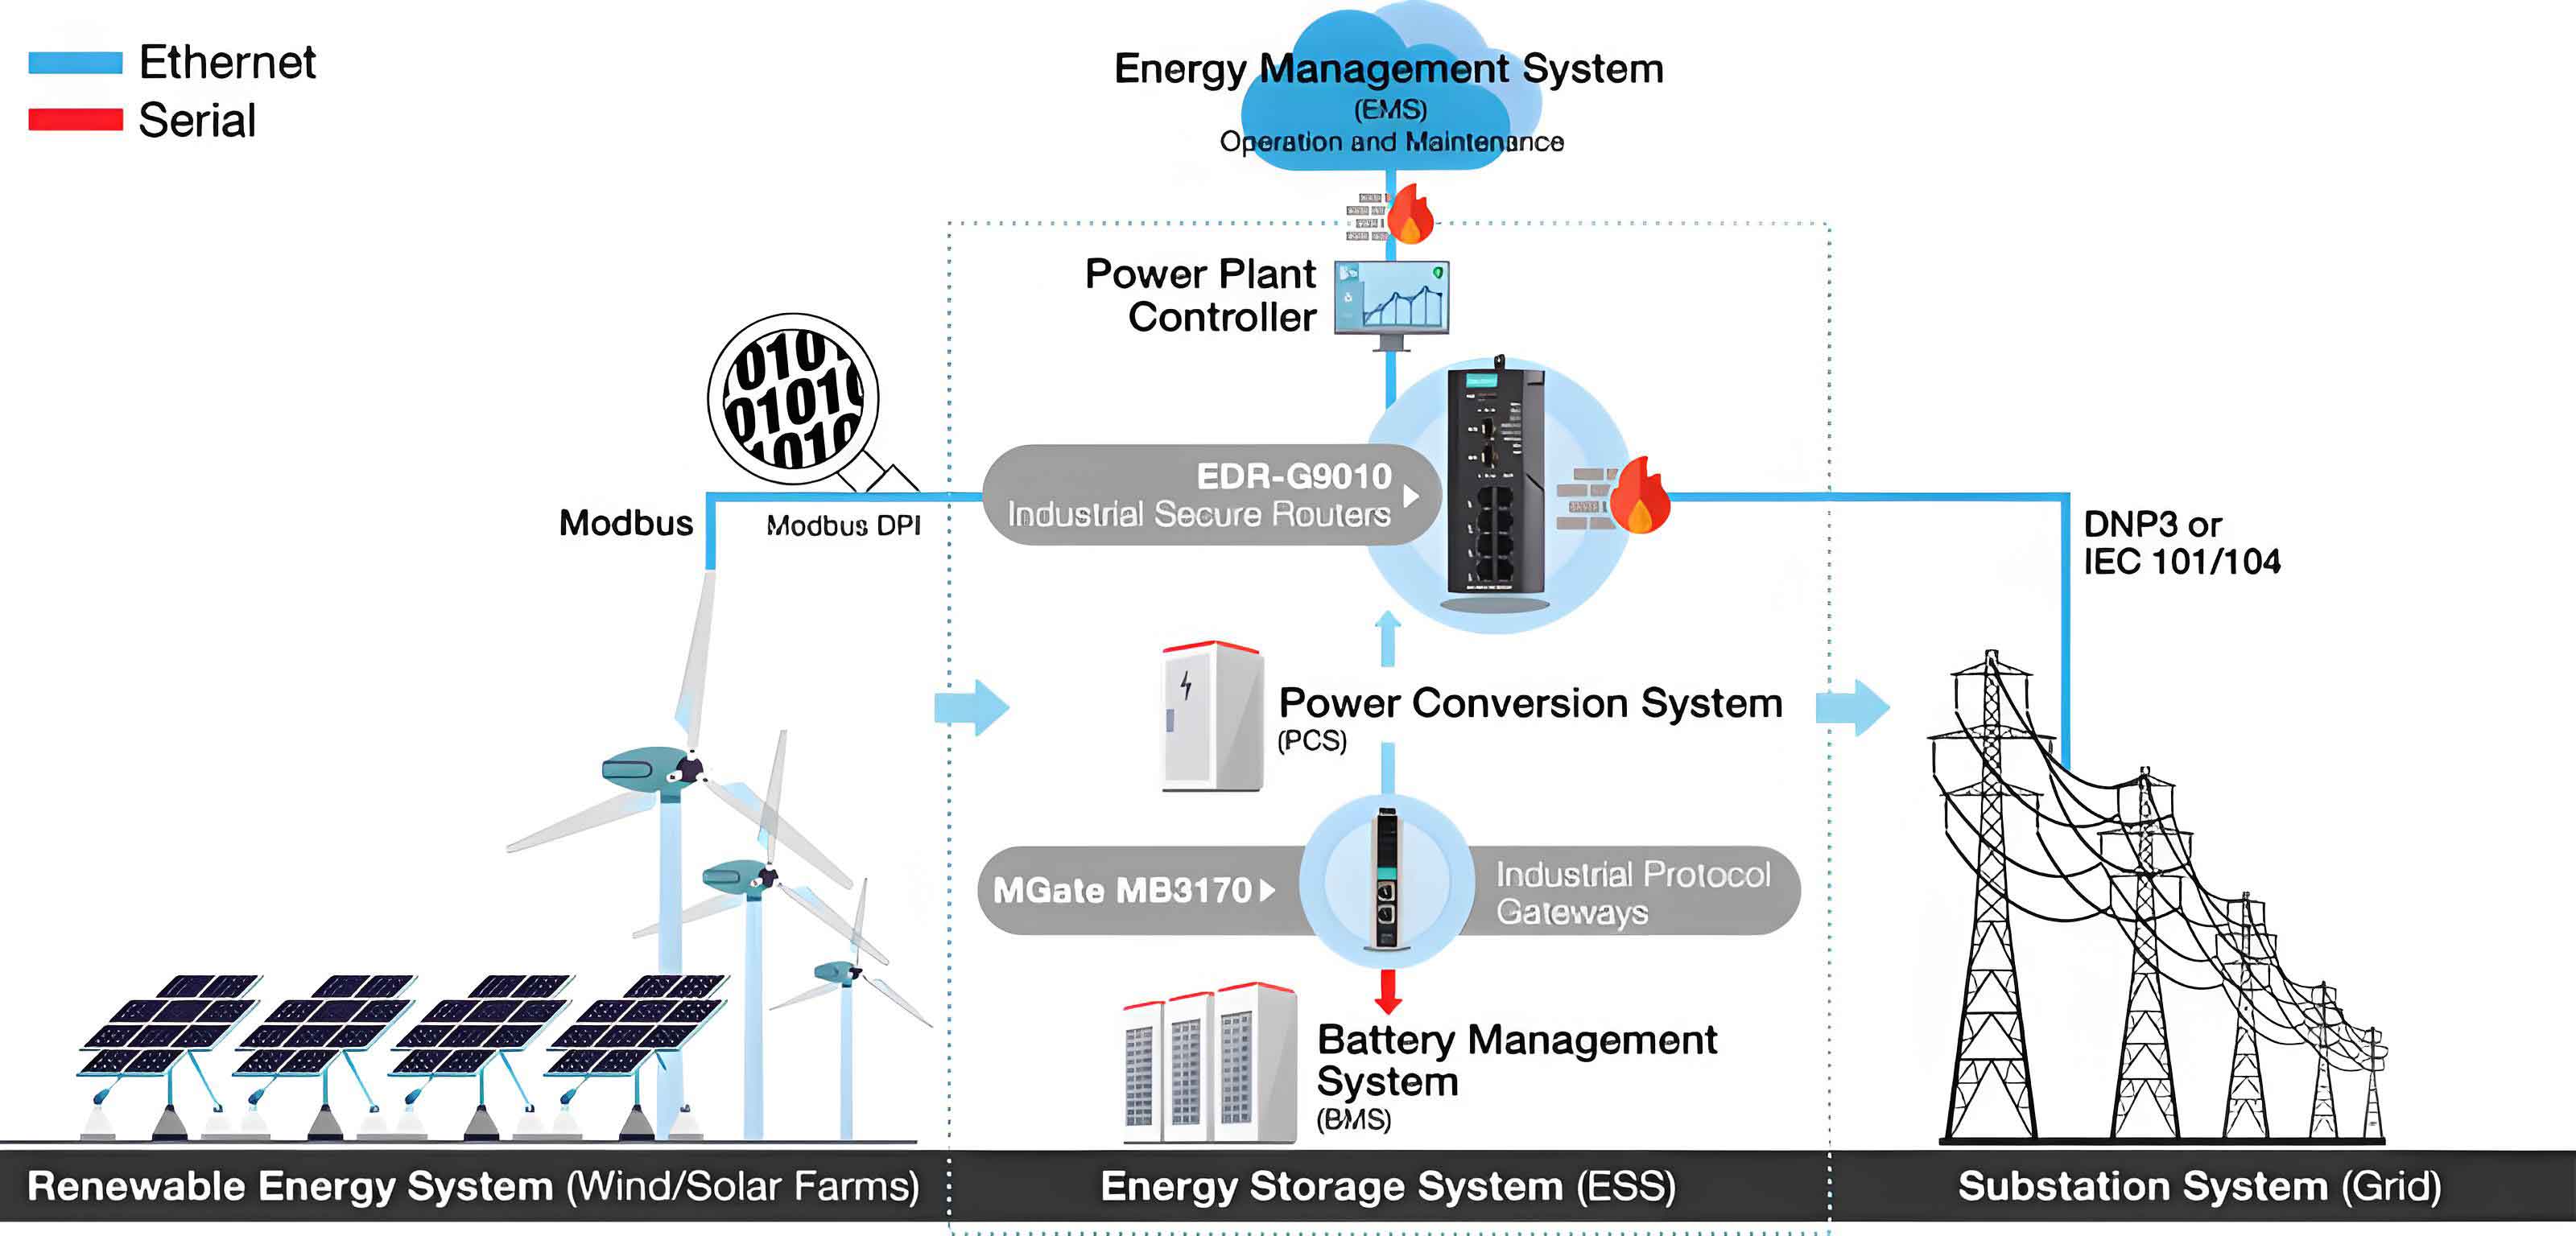
The global transition toward clean energy has accelerated the deployment of renewable sources such as wind and solar, which are inherently intermittent. Energy storage systems (ESS) play a critical role in smoothing these fluctuations and enhancing grid stability. Among various electrochemical storage technologies, sodium-ion batteries are particularly attractive for residential and commercial energy storage systems due to their cost advantage and wide operating temperature range. However, the thermal management of battery packs is essential to prevent capacity degradation and thermal runaway. Liquid immersion cooling, where the cells are directly submerged in a dielectric coolant, offers superior heat transfer and temperature uniformity compared to air cooling or conventional cold plates. This study focuses on the design of an immersion cooling system for a 2 kWh sodium-ion battery pack, aiming to minimize the maximum temperature and temperature difference through structural optimization.
2. Experimental Characterization of Sodium-ion Battery Cells
I first conducted a series of experiments to obtain the thermal parameters of the 18650 sodium-ion battery cells used in the energy storage system. The battery has a nominal capacity of 1.3 Ah, a nominal voltage of 3.2 V, and a weight of 35 g. The key specifications are summarized in the table below.
| Parameter | Value |
|---|---|
| Nominal capacity | 1.3 Ah |
| Nominal voltage | 3.2 V |
| Charge cutoff voltage | 4.0 V |
| Discharge cutoff voltage | 1.5 V |
| Weight | 35 g |
| Dimensions (diameter × height) | 18 mm × 65 mm |
Low-temperature performance
Discharge tests were performed at temperatures ranging from -25 °C to 5 °C. The sodium-ion battery exhibited significantly better low-temperature behavior than a lithium-ion counterpart. At -25 °C, the lithium-ion battery failed to discharge normally due to increased internal resistance and electrolyte viscosity, while the sodium-ion battery retained acceptable discharge capacity. The results highlight the suitability of sodium-ion chemistry for cold-climate energy storage systems.
Internal resistance and entropy coefficient
Using the HPPC method, I measured the ohmic resistance \(R_0\), polarization resistance \(R_p\), and two RC network resistances \(R_1\), \(R_2\) as functions of state of charge (SOC) at different discharge rates. The entropy coefficient \(\mathrm{d}U_{\mathrm{OCV}}/\mathrm{d}T\) was also determined by measuring the open-circuit voltage at several temperatures. These parameters are crucial for the electro-thermal model. A representative sample of the entropy coefficient data is given below.
| SOC | 1.0 | 0.8 | 0.6 | 0.5 | 0.4 | 0.2 | 0.0 |
|---|---|---|---|---|---|---|---|
| dU/dT (mV/K) | -0.18 | -0.17 | 0.18 | 0.21 | 0.12 | -0.01 | -0.05 |
3. Electro-thermal Coupling Model
The heat generation inside the battery can be described by the Bernardi equation, which combines irreversible heat from internal resistance and reversible heat from entropy change:
$$ q = \frac{I (U_{\mathrm{OCV}} – U) + I T \frac{\mathrm{d}U_{\mathrm{OCV}}}{\mathrm{d}T}}{V} $$
where \(I\) is the current, \(U\) the terminal voltage, \(T\) the battery temperature, and \(V\) the cell volume. For accurate prediction, I evaluated three equivalent circuit models: the Rint model, the Thevenin model, and the double polarization (DP) model. The DP model includes two RC networks to capture both electrochemical and concentration polarization effects. The corresponding equations are:
$$ U_{\mathrm{L}} = U_{\mathrm{OCV}} – I R_0 – U_1 – U_2 $$
$$ \dot{U}_i = \frac{I}{C_i} – \frac{U_i}{R_i C_i}, \quad i = 1,2 $$
By comparing simulated temperature rise with experimental data under 1C, 2C, and 3C discharge, I found that the DP model had the best accuracy. The maximum absolute error was 1.67 °C, and the mean relative error was less than 1.3%. Therefore, the DP model was used to generate the heat source via a user-defined function (UDF) in the CFD simulations.
4. Liquid Cooling Structure Design and Optimization
Selection of cooling method
I performed CFD simulations of the 2 kWh battery pack (462 cells) under natural air cooling, cold-plate cooling, and immersion cooling at a 2C discharge rate. The coolant inlet velocity was set to 0.2 m/s and the inlet temperature to 298.15 K for the liquid cooling cases. The results clearly showed that immersion cooling provided the best heat dissipation and temperature uniformity. Air cooling led to excessive temperatures, while the cold plate caused significant axial temperature gradients. The immersion cooling configuration was therefore selected for further optimization.
Battery arrangement comparison
Three cell arrangements were considered: cross (staggered) without baffles, cross with baffles, and a corrugated arrangement with baffles. The corrugated arrangement, where cells are aligned in a wavy pattern, exhibited the lowest maximum temperature \(T_{\mathrm{max}}\) and smallest maximum temperature difference \(\Delta T_{\mathrm{max}}\). This is because the baffles effectively direct the coolant flow through the gaps and suppress the formation of stagnant zones. Thus, the corrugated arrangement with baffles was chosen as the baseline for parameter optimization.
Box-Behnken experimental design
To optimize the liquid cooling structure, I selected three design variables: the battery spacing \(D\), the cell arrangement angle \(\alpha\), and the baffle inclination angle \(\beta\). Their ranges were set to \(D \in [1,5]\) mm, \(\alpha \in [15^\circ, 60^\circ]\), and \(\beta \in [0^\circ, 90^\circ]\). I used a three-level Box-Behnken design with 17 runs. The responses were the maximum temperature \(T_{\mathrm{max}}\) and the maximum temperature difference \(\Delta T_{\mathrm{max}}\). The design matrix and results are listed in the following table.
| Run | D (mm) | α (deg) | β (deg) | Tmax (K) | ΔTmax (K) |
|---|---|---|---|---|---|
| 1 | 1 | 37.5 | 0 | 317.05 | 19.118 |
| 2 | 3 | 60 | 90 | 316.97 | 18.596 |
| 3 | 5 | 60 | 45 | 317.02 | 18.642 |
| 4 | 5 | 37.5 | 0 | 309.69 | 11.177 |
| 5 | 3 | 37.5 | 45 | 309.08 | 10.540 |
| 6 | 1 | 60 | 45 | 324.67 | 26.269 |
| 7 | 3 | 37.5 | 45 | 309.08 | 10.540 |
| 8 | 3 | 60 | 0 | 319.71 | 21.332 |
| 9 | 1 | 37.5 | 90 | 317.08 | 18.650 |
| 10 | 5 | 15 | 45 | 318.84 | 20.444 |
| 11 | 3 | 37.5 | 45 | 309.08 | 10.540 |
| 12 | 3 | 37.5 | 45 | 309.08 | 10.540 |
| 13 | 3 | 15 | 90 | 321.18 | 22.650 |
| 14 | 5 | 37.5 | 90 | 309.46 | 10.951 |
| 15 | 3 | 37.5 | 45 | 309.08 | 10.540 |
| 16 | 1 | 15 | 45 | 322.69 | 24.391 |
| 17 | 3 | 15 | 0 | 321.49 | 22.776 |
Response surface model and multi-objective optimization
Using the least-squares method, I fitted a quadratic response surface model to the simulation results. The resulting regression equations are:
$$ T_{\mathrm{max}} = 345.017 – 4.7378 D – 0.0573 \alpha – 1.2934 \beta + 0.6513 D^2 + 0.000694 D \alpha + 0.02115 D \beta + 0.000809 \alpha^2 + 0.000598 \alpha \beta + 0.01802 \beta^2 $$
$$ \Delta T_{\mathrm{max}} = 47.174 – 5.1134 D – 0.0619 \alpha – 1.2925 \beta + 0.6915 D^2 + 0.000672 D \alpha + 0.02045 D \beta + 0.000824 \alpha^2 + 0.000644 \alpha \beta + 0.01806 \beta^2 $$
The ANOVA results showed that the battery spacing \(D\) had the most significant effect on both responses, while \(\alpha\) and \(\beta\) exhibited secondary influences. The coefficient of determination \(R^2\) for \(T_{\mathrm{max}}\) and \(\Delta T_{\mathrm{max}}\) were 0.986 and 0.988, respectively, confirming excellent fit.
To find the best trade-off between \(T_{\mathrm{max}}\) and \(\Delta T_{\mathrm{max}}\), I applied the NSGA-II multi-objective optimization algorithm. The optimization problem was defined as:
$$
\begin{aligned}
\min \quad & f_1(D,\alpha,\beta) = T_{\mathrm{max}} \\
\min \quad & f_2(D,\alpha,\beta) = \Delta T_{\mathrm{max}} \\
\text{s.t.} \quad & 1 \le D \le 5 \text{ mm},\\
& 15^\circ \le \alpha \le 60^\circ,\\
& 0^\circ \le \beta \le 90^\circ
\end{aligned}
$$
The Pareto front obtained from NSGA-II is shown in the figure below. From the optimal solution set, I selected a representative point that offers a balanced compromise: \(D = 4.3 \text{ mm}\), \(\alpha = 39^\circ\), \(\beta = 51^\circ\). This configuration gave predicted values of \(T_{\mathrm{max}} = 307.941 \text{ K}\) and \(\Delta T_{\mathrm{max}} = 9.464 \text{ K}\). A subsequent CFD simulation using these parameters confirmed the predictions, with a maximum temperature of 307.635 K and a temperature difference of 9.127 K. The relative errors were only 0.09% and 3.69%, respectively, validating the accuracy of the NSGA-II approach.
| Case | D (mm) | α (deg) | β (deg) | Tmax (K) | ΔTmax (K) |
|---|---|---|---|---|---|
| Initial design | 3.0 | 37.5 | 45 | 308.674 | 10.137 |
| NSGA-II optimum | 4.3 | 39 | 51 | 307.941 | 9.464 |
| CFD verification | 4.3 | 39 | 51 | 307.635 | 9.127 |
5. Field Synergy Analysis and Performance Study
To understand the mechanisms governing convective heat transfer in the immersion cooling system, I used the field synergy principle. The synergy angle \(\theta\) between the velocity vector and the temperature gradient vector is defined as:
$$ \cos \theta = \frac{\mathbf{U} \cdot \nabla T}{|\mathbf{U}| |\nabla T|} $$
A smaller \(\theta\) indicates better alignment between the flow field and the thermal field, leading to enhanced heat transfer. I analyzed the influence of coolant type, inlet temperature, and inlet velocity on the battery pack temperature distribution and the average field synergy angle.
Influence of coolant type
Five coolants were evaluated: HFE-6512 (electronic fluorinated liquid), mineral oil, deionized water, MIVOLT-DFT (ester-based), and silicone oil. Their thermophysical properties are summarized in the following table.
| Coolant | Density (kg/m³) | Specific heat (J/kg·°C) | Thermal conductivity (W/m·°C) | Kinematic viscosity (cSt) | Thermal diffusivity (×10⁻⁷ m²/s) |
|---|---|---|---|---|---|
| HFE-6512 | 1600 | 1170 | 0.23 | 1.18 | 1.23 |
| Mineral oil | 924.1 | 1900 | 0.13 | 56 | 0.74 |
| Deionized water | 998 | 4182 | 0.5984 | 1 | 1.43 |
| MIVOLT-DFT | 916 | 1907 | 0.129 | 16.4 | 0.74 |
| Silicone oil | 965 | 1460 | 0.16 | 100 | 1.14 |
The simulations showed that coolants with higher thermal diffusivity and lower viscosity, such as deionized water and HFE-6512, produced lower \(T_{\mathrm{max}}\) and \(\Delta T_{\mathrm{max}}\). HFE-6512 was preferred because it is electrically insulating, eliminating short-circuit risks while providing cooling performance comparable to water.
Influence of inlet temperature
When the coolant inlet temperature increased from 289.15 K to 298.15 K, the temperature of the battery pack increased correspondingly, and the uniformity deteriorated. The average field synergy angle also increased, indicating poorer alignment between the velocity and temperature gradient fields. This is due to the reduced temperature difference between the coolant and the battery surface, which weakens the heat transfer driving force.
Influence of inlet velocity and Reynolds number
I varied the inlet velocity from 0.0625 m/s to 0.625 m/s, corresponding to Reynolds numbers from 1165 to 11650. The results are summarized in the figure below, where the maximum temperature reduction rate is plotted against the Reynolds number. It is evident that increasing the velocity initially causes a sharp drop in temperature, but beyond a Reynolds number of about 6900, the additional benefit becomes marginal. The average synergy angle first increased in the transition regime and then decreased in the fully turbulent regime, confirming that turbulent flow improves field synergy and enhances heat transfer.
6. Reduced-Order Model (ROM) for Real-Time Prediction
Traditional CFD simulations are computationally expensive, making it impractical to explore a wide range of operating conditions in real time. To address this, I developed a reduced-order model based on Proper Orthogonal Decomposition (POD). The POD method extracts dominant modes from a set of high-fidelity snapshots obtained through CFD. Using singular value decomposition, the snapshot matrix \(S\) is decomposed as:
$$ S = U \Sigma V^T $$
where the columns of \(U\) are the POD modes and \(\Sigma\) contains the singular values. The reduced-order representation of the temperature field is given by a truncated set of modes:
$$ T \approx \sum_{i=1}^{k} \beta_i \phi_i $$
where \(\phi_i\) are the first \(k\) POD modes and \(\beta_i\) are the corresponding coefficients. These coefficients can be interpolated from the training data to predict the thermal field for new boundary conditions.
I generated a database of 9 CFD simulations with varying inlet velocity and temperature. Using 66% of the samples as training data, I constructed a POD-based ROM. The ROM predictions were then compared with CFD results for several untested conditions. The relative errors for the maximum temperature were below 0.16% in all cases, while the errors for the temperature difference were negligible. Below is a comparison table for different inlet temperatures.
| Inlet temperature (K) | Relative error Tmax (%) | Relative error ΔTmax (%) |
|---|---|---|
| 290.15 | 0.07 | 0.03 |
| 292.15 | 0.16 | 0.04 |
| 294.15 | 0.084 | 2.104 |
| 296.15 | 0.11 | 0.06 |
The POD-based reduced-order model was able to generate the temperature field in milliseconds, whereas a full CFD simulation typically takes several hours. This represents a computational speed-up of four orders of magnitude. Therefore, the ROM is highly suitable for real-time monitoring, control, and optimization of the energy storage system thermal performance.
7. Conclusion
In this study, I systematically designed and optimized a liquid immersion cooling structure for a sodium-ion battery energy storage system. The key findings are summarized as follows:
1. The sodium-ion battery exhibited excellent low-temperature performance compared to lithium-ion, and the double polarization (DP) electro-thermal model provided accurate predictions with a maximum error below 1.7 °C.
2. Immersion cooling was proven superior to air and cold-plate cooling in terms of both maximum temperature and temperature uniformity. The corrugated battery arrangement combined with baffles yielded the best thermal performance.
3. By using a Box-Behnken design and the NSGA-II multi-objective algorithm, the optimized structural parameters were \(D = 4.3\) mm, \(\alpha = 39^\circ\), \(\beta = 51^\circ\), resulting in a maximum temperature of 307.94 K and a temperature difference of 9.46 K, both lower than the initial design.
4. Field synergy analysis revealed that high thermal diffusivity, low viscosity coolants, lower inlet temperatures, and higher Reynolds numbers (turbulent flow) enhance the alignment of velocity and temperature gradient fields, thereby improving heat dissipation.
5. The POD-based reduced-order model accurately predicted the thermal behavior of the battery pack with relative errors under 0.17%, while accelerating the computation by several orders of magnitude. This enables real-time optimization of the energy storage system under varying operating conditions.
The proposed methodology provides a practical framework for designing efficient and reliable thermal management systems for sodium-ion battery energy storage systems, contributing to the broader adoption of this promising technology in sustainable energy applications.