
We conducted a year-long fixed‑point monitoring study from October 2024 to October 2025 at a mountainous photovoltaic (PV) power station in Chaoyang County, Liaoning Province, China. The study area is representative of low‑mountain landscapes with high ecological sensitivity and extensive PV deployment. By deploying GMX600 MaxiMet micro weather stations and 5TM soil temperature‑moisture sensors, we continuously measured air temperature, air humidity, wind speed, wind direction, soil temperature, and soil moisture at three locations: inside the PV array (IA), beside the PV array (BA), and at a reference site (R) located 6.4 km away. Data were collected at 1‑minute intervals and aggregated into daily, monthly, and seasonal averages. Statistical analysis was performed using SPSS 27.0 with ANOVA and Bonferroni post‑hoc tests (lsmeans method). Our goal was to quantify how large‑scale deployment of solar panels alters local climate variables in mountainous terrain.
The results reveal that the presence of solar panels consistently modifies the local microclimate from the outer boundary toward the interior of the PV station. The observed effects can be summarized in five key aspects: warming and drying of the air, reduction and deflection of wind, and cooling and moistening of the soil. Each of these effects exhibited pronounced diurnal, monthly, and seasonal patterns, with the strongest impacts occurring during low‑temperature periods (nighttime, cold months, autumn‑winter) for air and soil thermal‑moisture variables, and during high‑temperature periods (daytime, warm months, spring‑summer) for wind speed reduction. The following sections present the quantitative evidence.
1. Air Temperature
The annual average air temperature inside the PV area (IA) was 2.626 °C higher than the reference site (R), while the area beside the array (BA) was 1.934 °C higher. The temperature difference between IA and BA was 0.692 °C. Bonferroni post‑hoc test indicated a significant difference only between IA and R (P = 0.048). The warming effect was more pronounced during nighttime (ΔTnight = 2.669 °C) than during daytime (ΔTday = 2.590 °C), and during September–February (ΔTcold = 1.979 °C) compared to March–August (ΔTwarm = 1.071 °C). Seasonal analysis showed autumn‑winter warming greater than spring‑summer warming (1.980 °C vs. 1.065 °C). This thermal enhancement is primarily attributed to the conversion of absorbed solar radiation into sensible heat by the solar panels, reduced convective cooling due to wind sheltering, and the trapping of heat under stable atmospheric conditions typical of mountain valleys at night.
| Pair | Mean Difference | Std. Error | P‑value | 95% CI Lower | 95% CI Upper |
|---|---|---|---|---|---|
| IA vs R | 2.6258 | 1.0641 | 0.048 | 0.0147 | 5.2368 |
| BA vs R | 1.9336 | 1.0641 | 0.221 | -0.6774 | 4.5447 |
| IA vs BA | 0.6921 | 1.0641 | 1.000 | -1.9189 | 3.3032 |
The temperature enhancement can be expressed as:
$$ \Delta T_{\text{IA-R,annual}} = 2.626\;^{\circ}\mathrm{C} $$
$$ \Delta T_{\text{IA-R,night}} = 2.669\;^{\circ}\mathrm{C} > \Delta T_{\text{IA-R,day}} = 2.590\;^{\circ}\mathrm{C} $$
$$ \Delta T_{\text{IA-R,cold months}} = 1.979\;^{\circ}\mathrm{C} > \Delta T_{\text{IA-R,warm months}} = 1.071\;^{\circ}\mathrm{C} $$
2. Air Humidity
Annual average relative humidity inside the PV area decreased by 5.254% compared to the reference site, with BA exhibiting a reduction of 4.206%. The difference between IA and BA was only 1.048%. None of the pairwise differences reached statistical significance (P > 0.05), yet the time‑series analysis showed a consistent pattern: the drying effect was greater at night (ΔRH = -5.879%) than during the day (-5.572%), and during December–May (-9.371%) compared to June–November (-7.154%). Winter‑spring exhibited a stronger drying (−9.047%) than summer‑autumn (−7.154%). The drying is caused by the combined effect of reduced evapotranspiration under solar panels and the higher saturation vapor pressure in the warmer air within the PV station.
| Pair | Mean Difference | Std. Error | P‑value | 95% CI Lower | 95% CI Upper |
|---|---|---|---|---|---|
| IA vs R | -5.2541 | 2.67118 | 0.160 | -11.8085 | 1.3003 |
| BA vs R | -4.2059 | 2.67118 | 0.360 | -10.7603 | 2.3485 |
| IA vs BA | -1.0482 | 2.67118 | 1.000 | -7.6026 | 5.5062 |
The drying effect can be summarized as:
$$ \Delta RH_{\text{IA-R,annual}} = -5.254\% $$
$$ \Delta RH_{\text{IA-R,night}} = -5.879\% < \Delta RH_{\text{IA-R,day}} = -5.572\% \quad (\text{more negative indicates stronger drying}) $$
3. Wind Environment
3.1 Wind Speed
Annual average wind speed inside the PV area was reduced by 0.669 m s⁻¹ relative to the reference site (significant, P = 0.001), and BA showed a reduction of 0.278 m s⁻¹ (P = 0.055, not significant). The difference between IA and BA was 0.391 m s⁻¹ (P = 0.003). The wind‑reduction effect was more pronounced during nighttime (ΔWS = -0.805 m s⁻¹) than daytime (-0.508 m s⁻¹), and during March–August (-0.694 m s⁻¹) compared to September–February (-0.497 m s⁻¹). Spring‑summer reduction (-0.692 m s⁻¹) exceeded autumn‑winter (-0.497 m s⁻¹). This shows that during high‑background‑wind periods (warm season, daytime), the blocking effect of the solar panels is amplified.
| Pair | Mean Difference | Std. Error | P‑value | 95% CI Lower | 95% CI Upper |
|---|---|---|---|---|---|
| IA vs R | -0.6690 | 0.11481 | 0.001 | -0.9507 | -0.3872 |
| BA vs R | -0.2777 | 0.11481 | 0.055 | -0.5594 | 0.0040 |
| IA vs BA | -0.3913 | 0.11481 | 0.003 | -0.6730 | -0.1096 |
Wind speed reduction can be expressed as:
$$ \Delta WS_{\text{IA-R,annual}} = -0.669\;\mathrm{m\,s^{-1}} $$
$$ \Delta WS_{\text{IA-R,night}} = -0.805\;\mathrm{m\,s^{-1}} < \Delta WS_{\text{IA-R,day}} = -0.508\;\mathrm{m\,s^{-1}} $$
$$ \Delta WS_{\text{IA-R,warm months}} = -0.694\;\mathrm{m\,s^{-1}} < \Delta WS_{\text{IA-R,cold months}} = -0.497\;\mathrm{m\,s^{-1}} $$
3.2 Wind Direction
The dominant wind direction at the reference site was NNW and NW. Inside the PV area, the dominant directions shifted to NNW, NW, and N. Beside the array, the dominant wind direction changed dramatically to WSW. The annual mean wind direction deviation showed a clockwise (westward) shift of 2.96° inside the array and 18.06° beside the array relative to the reference. This indicates that the solar panels not only reduce wind speed but also systematically deflect the flow, likely due to the channelling effect of the tilted panel rows and the altered surface roughness.
$$ \theta_{\text{IA shift}} = +2.96^{\circ} \quad (\text{clockwise}) $$
$$ \theta_{\text{BA shift}} = +18.06^{\circ} \quad (\text{clockwise}) $$
4. Soil Temperature
Annual average soil temperature inside the PV area was lower than the reference site at all three depths (10 cm, 20 cm, 40 cm). The cooling effect was strongest in the 10 cm layer (IA vs R: -1.482 °C, significant P = 0.002; BA vs R: -0.754 °C, not significant). At 20 cm, IA vs R was -1.076 °C (P = 0.001), BA vs R was -0.520 °C (P = 0.017), and IA vs BA was -0.556 °C (P = 0.010). At 40 cm, IA vs R was -1.050 °C (P = 0.001) and IA vs BA was -0.854 °C (P = 0.001). The cooling magnitude decreased with depth: the 10 cm layer experienced a 13.97% reduction for IA and 6.66% for BA relative to R, while the 40 cm layer showed 10.02% and 2.26% reductions, respectively. The cooling was more effective during nighttime (ΔTIA-R,soil = -3.346 °C) than daytime (-3.064 °C), and during cold months (September–February) and autumn‑winter season. This depth‑dependent cooling is due to the direct shading effect of solar panels, which reduces solar radiation reaching the surface and lowers the soil heat flux.
| Depth | Pair | Mean Difference | Std. Error | P‑value | 95% CI Lower | 95% CI Upper |
|---|---|---|---|---|---|---|
| 10 cm | IA vs R | -1.4815 | 0.40981 | 0.002 | -2.4871 | -0.4759 |
| BA vs R | -0.7542 | 0.40981 | 0.210 | -1.7598 | 0.2514 | |
| IA vs BA | -0.7272 | 0.40981 | 0.241 | -1.7328 | 0.2783 | |
| 20 cm | IA vs R | -1.0758 | 0.18188 | 0.001 | -1.5220 | -0.6295 |
| BA vs R | -0.5198 | 0.18188 | 0.017 | -0.9661 | -0.0736 | |
| IA vs BA | -0.5559 | 0.18188 | 0.010 | -1.0022 | -0.1097 | |
| 40 cm | IA vs R | -1.0503 | 0.03836 | 0.001 | -1.1445 | -0.9562 |
| BA vs R | -0.3636 | 0.18354 | 0.149 | -0.8089 | 0.0818 | |
| IA vs BA | -0.8542 | 0.18354 | 0.001 | -1.2995 | -0.4088 |
Soil temperature cooling is described by:
$$ \Delta T_{\text{soil, IA-R,10cm}} = -1.482\;^{\circ}\mathrm{C} $$
$$ \Delta T_{\text{soil, IA-R,20cm}} = -1.076\;^{\circ}\mathrm{C} $$
$$ \Delta T_{\text{soil, IA-R,40cm}} = -1.050\;^{\circ}\mathrm{C} $$
$$ \text{Relative cooling at 10 cm: } 13.97\% > 20 cm: 10.07\% > 40 cm: 10.02\% $$
5. Soil Moisture
Annual average soil moisture increased inside the PV area, with the largest increase at 10 cm depth: IA vs R was +0.0688 m³ m⁻³ (44.60% relative increase), BA vs R was +0.0459 m³ m⁻³ (34.99% relative increase), and IA vs BA was +0.0229 m³ m⁻³. All pairwise differences were highly significant (P = 0.001) at every depth. At 20 cm, IA vs R showed +0.0392 m³ m⁻³ (25.41% increase), BA vs R +0.0199 m³ m⁻³ (14.75%), and IA vs BA +0.0193 m³ m⁻³. At 40 cm, IA vs R was +0.0396 m³ m⁻³ (25.38%), BA vs R +0.0120 m³ m⁻³ (9.35%), and IA vs BA +0.0276 m³ m⁻³. The moistening effect was stronger at night (ΔθIA-R = +0.150 m³ m⁻³) than daytime (+0.145 m³ m⁻³), and during cold months (September–February) and autumn‑winter season. This is explained by the shading of solar panels reducing evaporation from the soil surface, as well as the modification of surface runoff that allows more water to infiltrate and be retained within the array.
| Depth | Pair | Mean Difference | Std. Error | P‑value | 95% CI Lower | 95% CI Upper |
|---|---|---|---|---|---|---|
| 10 cm | IA vs R | 0.0688 | 0.00162 | 0.001 | 0.0648 | 0.0728 |
| BA vs R | 0.0459 | 0.00162 | 0.001 | 0.0419 | 0.0499 | |
| IA vs BA | 0.0229 | 0.00162 | 0.001 | 0.0189 | 0.0269 | |
| 20 cm | IA vs R | 0.0392 | 0.00132 | 0.001 | 0.0359 | 0.0424 |
| BA vs R | 0.0199 | 0.00132 | 0.001 | 0.0166 | 0.0231 | |
| IA vs BA | 0.0193 | 0.00132 | 0.001 | 0.0160 | 0.0225 | |
| 40 cm | IA vs R | 0.0396 | 0.00016 | 0.001 | 0.0392 | 0.0400 |
| BA vs R | 0.0120 | 0.00016 | 0.001 | 0.0116 | 0.0124 | |
| IA vs BA | 0.0276 | 0.00016 | 0.001 | 0.0272 | 0.0280 |
Soil moisture increase is summarized as:
$$ \Delta \theta_{\text{IA-R,10cm}} = 0.0688\;\mathrm{m^3\,m^{-3}} \quad (44.60\%) $$
$$ \Delta \theta_{\text{IA-R,20cm}} = 0.0392\;\mathrm{m^3\,m^{-3}} \quad (25.41\%) $$
$$ \Delta \theta_{\text{IA-R,40cm}} = 0.0396\;\mathrm{m^3\,m^{-3}} \quad (25.38\%) $$
6. Discussion
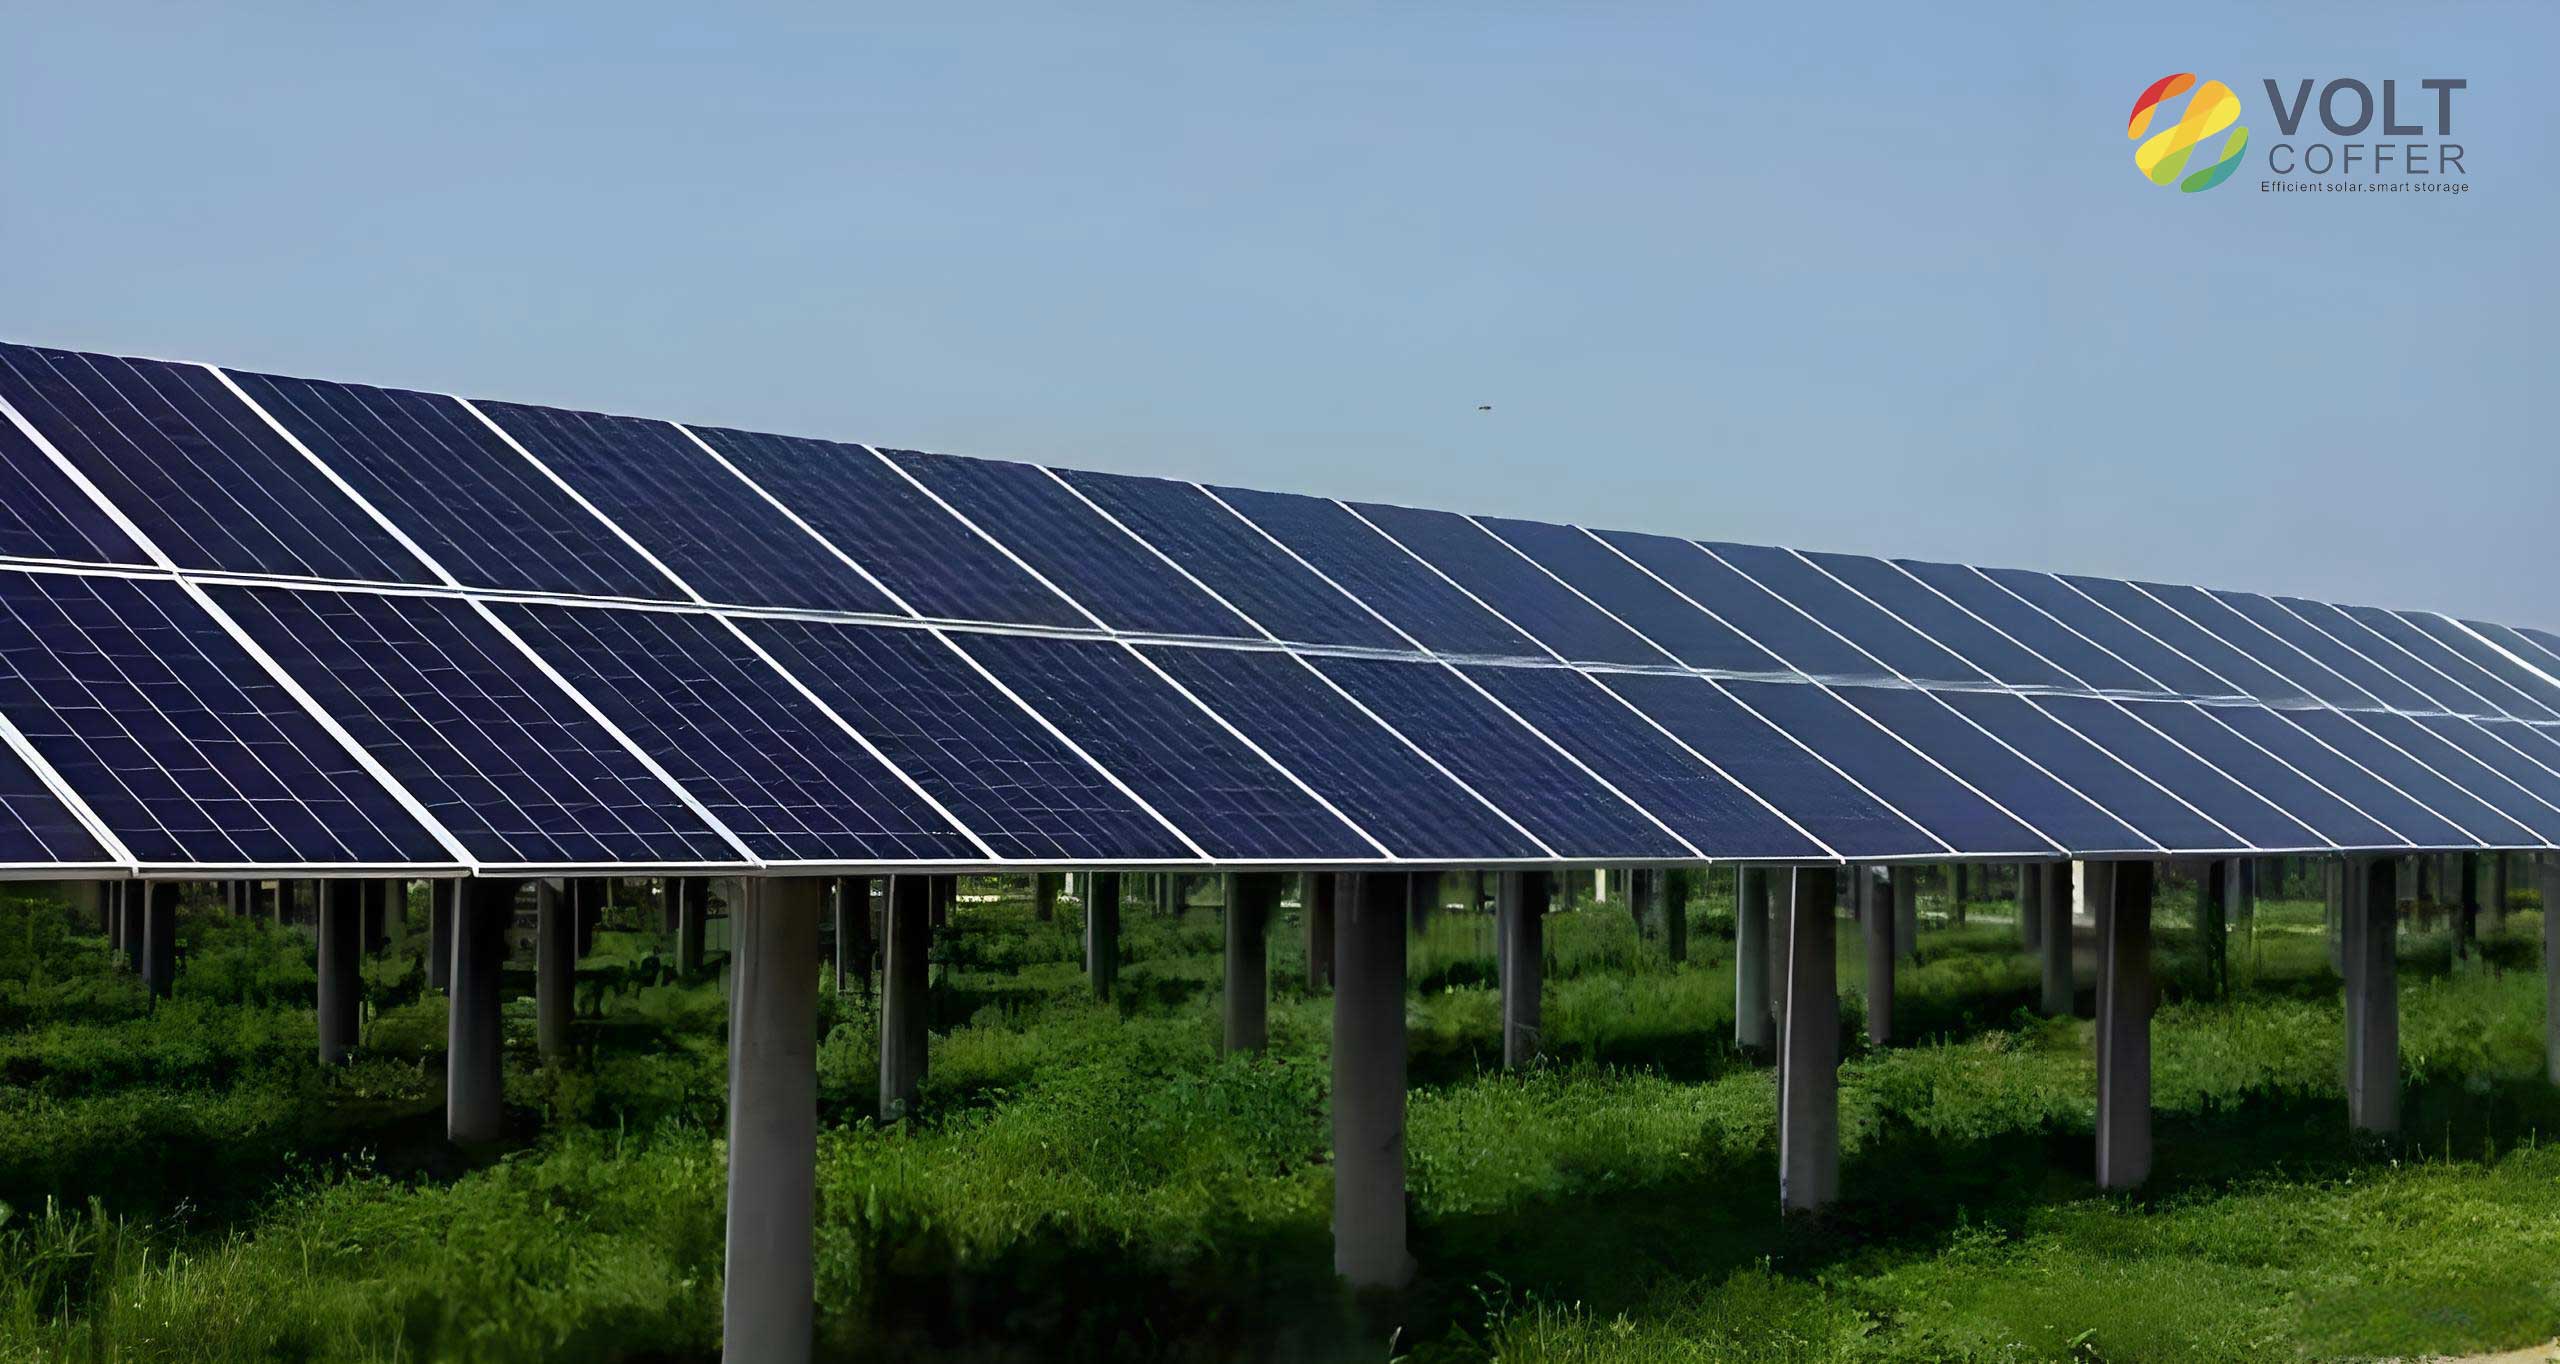
The observed patterns confirm that solar panels in mountainous terrain create a distinct “oasis‑heat‑island” dichotomy: the air above the panels becomes warmer and drier, while the soil beneath becomes cooler and wetter. The wind field is simultaneously weakened and deflected. These results are consistent with previous studies in flat desert or grassland environments, but the mountain setting amplifies certain effects due to valley inversions and restricted horizontal mixing. For instance, the nocturnal warming is more intense because cold air drainage is blocked by the panel rows, and the daytime wind reduction is stronger because the panels act as obstacles to the up‑valley and down‑valley flows. The significant increase in soil moisture (up to 44.6% at 10 cm) suggests that soil water conservation is a benefit under the panels, but the accompanying soil cooling may delay seed germination and root growth in spring. The shift in wind direction (up to 18°) could affect pollen dispersal and pest migration patterns.
Based on these findings, we propose several ecological restoration strategies tailored to the local climate effects of solar panels. To counteract the air warming and drying in cold months, shade‑tolerant herbaceous species should be planted under the panels to enhance evapotranspiration and humidity. For soil cooling and moistening, deep‑rooted shrub strips can be established between panel rows to improve infiltration and nutrient cycling while buffering runoff. To mitigate the wind reduction and deflection, ventilation corridors aligned with the prevailing wind direction should be incorporated into the array layout during planning. Additionally, rainwater harvesting systems integrated with the panel surfaces can supplement the ecological water demand of the restored vegetation. These measures aim to minimize the microclimate modifications induced by solar panels and to promote sustainable coexistence of photovoltaic infrastructure and mountain ecosystems.
7. Conclusions
Our one‑year field monitoring quantifies the local climate impacts of a large mountain photovoltaic power station. The presence of solar panels leads to an average air temperature increase of 2.63 °C, relative humidity decrease of 5.25%, wind speed reduction of 0.67 m s⁻¹ (with a westward wind‑direction shift of 3–18°), soil temperature decrease of 1.20 °C, and soil moisture increase of 4.92% (m³ m⁻³) inside the array compared to the reference site. The effects are depth‑ and time‑dependent, with the most pronounced responses in the surface soil and during low‑temperature periods for thermal‑moisture variables, and during high‑wind periods for wind variables. These findings provide a scientific basis for the ecological planning and mitigation design of future mountain PV projects.