
In the rapidly evolving landscape of renewable energy integration, the reliability of the energy storage battery system under elevated temperatures is a critical bottleneck. I embarked on this study to deconstruct the failure mechanisms of a commercial 280 Ah LiFePO4 (LFP)/graphite energy storage battery subjected to prolonged cycling at 45 °C. While LFP is celebrated for its safety, its performance under sustained thermal stress reveals complex degradation pathways that are distinct from room-temperature aging. My comprehensive analysis leverages differential voltage analysis (dQ/dV), post-mortem ex-situ characterization, and half-cell reassembly to construct a holistic model of capacity fade. The insights derived are crucial for engineers designing energy storage battery systems for demanding climates.
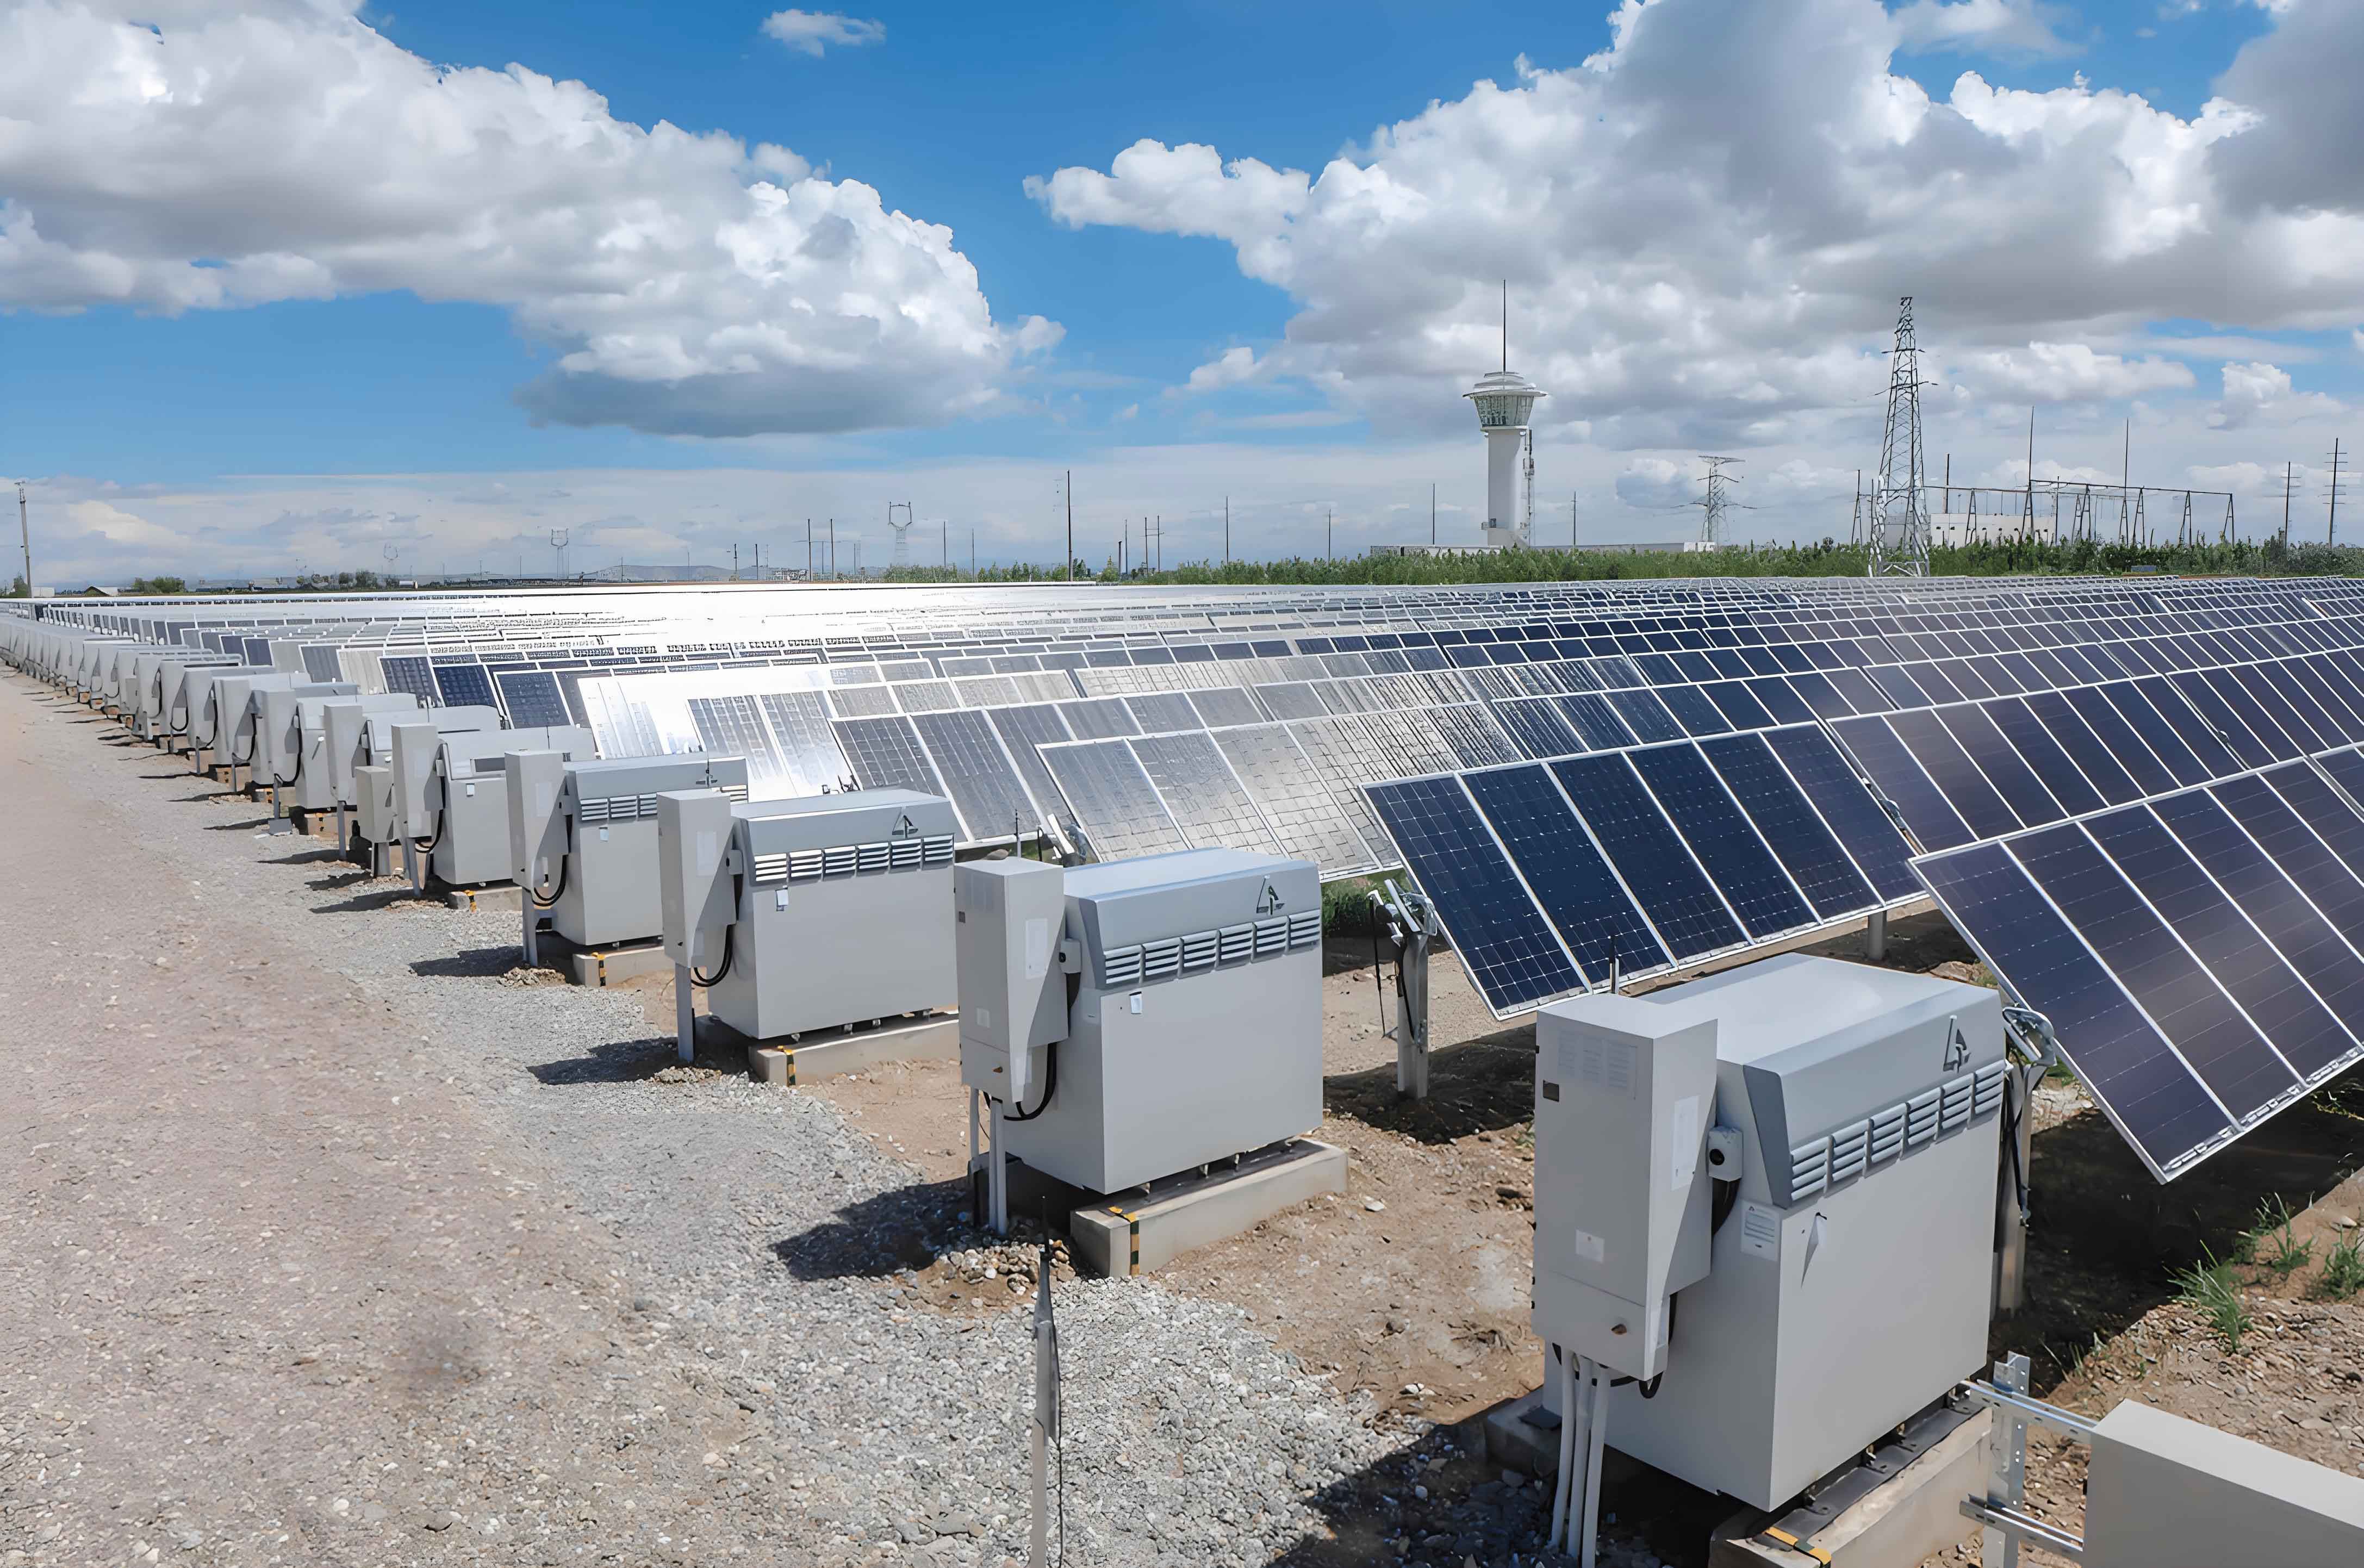
The core objective of my work was to separate the contributions of the cathode, anode, and electrolyte to the total capacity loss. I found that while the LFP cathode remained remarkably stable, the graphite anode underwent a catastrophic structural failure. This failure triggered a cascade of detrimental side reactions, including the thickening of the solid-electrolyte interphase (SEI), decomposition of the electrolyte, and blockage of the separator, all of which led to a massive loss of active lithium (LLI). My findings suggest that the energy storage battery lifetime at high temperatures is predominantly dictated by the robustness of the negative electrode structure.
Experimental Methodology and Electrochemical Benchmarking
I conducted cycling tests using a 1C CC-CV charge (3.65 V) and 1C CC discharge (2.5 V) protocol in a 45 °C environmental chamber. To track the evolution of the energy storage battery properties, I periodically performed reference performance tests (RPTs) to measure capacity and resistance. The cycle life data is summarized in the table below, highlighting the abrupt acceleration of decay below 80% State-of-Health (SOH).
| Cycles | SOH (%) | Discharge Capacity (Ah) | DC Internal Resistance (mΩ) | Fade Rate per Cycle (Ah) |
|---|---|---|---|---|
| 0 | 100.0 | 280.0 | 0.80 | – |
| 500 | 95.2 | 266.6 | 0.95 | 0.027 |
| 1500 | 90.1 | 252.3 | 1.25 | 0.018 |
| 2500 | 80.5 | 225.4 | 1.80 | 0.022 |
| 3500 | 68.0 | 190.4 | 2.60 | 0.035 |
| 4750 | 58.2 | 162.9 | 3.50 | 0.058 |
The voltage profiles during cycling showed increasing polarization, particularly in the latter stages, which is a classical sign of kinetic limitations due to material degradation. To quantify the sources of this polarization and capacity loss, I turned to the differential voltage technique.
Deciphering Degradation via dQ/dV Analysis
The dQ/dV curves derived from the charging process serve as a fingerprint for phase transitions. For the graphite anode, three distinct peaks are typically observed, corresponding to the staging phenomena (e.g., Dilute Stage 1 -> Stage 4 -> Stage 2 -> Stage 1). I tracked the evolution of these peaks over the lifetime of the energy storage battery.
| SOH (%) | Peak 1 Voltage (V) | Peak 2 Voltage (V) | Peak 3 Voltage (V) | Combined Area (Peak 2+3) |
|---|---|---|---|---|
| 100 | 3.301 | 3.345 | 3.350 | 230 |
| 90 | 3.305 | 3.350 | 3.360 | 205 |
| 80 | 3.312 | 3.360 | 3.370 | 172 |
| 70 | 3.320 | 3.375 | 3.390 | 140 |
| 60 | 3.324 | 3.390 | 3.410 | 110 |
The results were clear: while the voltage of Peak 1 shifted only slightly (~23 mV), indicating moderate polarization increase, the combined area of Peaks 2 and 3 experienced a drastic reduction of over 50% by 60% SOH. This reduction is a direct measure of the loss of usable host sites for lithium intercalation (Loss of Active Material, LAM) combined with the irreversible consumption of lithium (Loss of Lithium Inventory, LLI). The merging of Peaks 2 and 3 at 80% SOH signals a loss of structural order in the graphite, homogenizing the intercalation stages.
Structural Stability of the LiFePO4 Cathode
I disassembled the energy storage battery at 100%, 90%, and 60% SOH to perform ex-situ analysis. Scanning Electron Microscopy (SEM) of the LFP cathode showed intact primary particles at 90% SOH. However, at 60% SOH, intergranular cracks were visible. Despite this, the electrochemical performance of the cathode was surprisingly resilient. I extracted the LFP material and reassembled it into half-cells with lithium metal.
| SOH of Full Cell | LFP Half-Cell Charge (mAh/g) | LFP Half-Cell Discharge (mAh/g) | Ireversible Capacity Loss (%) |
|---|---|---|---|
| 100 (Fresh) | 158.0 | 156.0 | 1.3 |
| 90 (Cycled) | 152.4 | 151.7 | 0.5 |
| 60 (Cycled) | 147.6 | 147.1 | 0.3 |
The X-Ray Diffraction (XRD) patterns of the cathodes at 60% SOH showed a slight increase in the intensity of the FePO4 phase peaks (020) and (200). This indicates that lithium vacancies were present in the structure, meaning not all lithium could be reinserted. Nevertheless, the half-cell data demonstrates that the LFP material itself retained approximately 94% of its intrinsic capacity. Thus, the cathode contribution to the overall capacity fade of the energy storage battery was minimal, estimated at roughly 4% of active material loss.
Catastrophic Failure of the Graphite Anode
The negative electrode was the epicenter of the degradation in my study. SEM images of the anode revealed a pristine surface initially, which became covered in a thick, mossy deposit by 60% SOH. Furthermore, deep grooves and cracks appeared on the graphite particles, suggesting structural exfoliation. I quantified this structural damage using XRD and Raman spectroscopy.
| SOH of Cell | Raman D/G Intensity Ratio | Crystallite Size (Lc) (nm) | d002 Spacing (Å) |
|---|---|---|---|
| 100 (Fresh) | 0.302 | 25.1 | 3.354 |
| 90 (Cycled) | 0.481 | 22.8 | 3.365 |
| 60 (Cycled) | 0.859 | 18.5 | 3.382 |
The Raman D/G ratio, a proxy for disorder, increased by a factor of 2.8. The XRD results confirmed this: the (002) peak shifted to a lower angle, corresponding to an increase in the d-spacing. This signifies a loss of long-range order and the amorphization of the graphite. When I reassembled the graphite into half-cells, the severity of the capacity loss became starkly apparent.
| SOH of Full Cell | Graphite Half-Cell Charge (mAh/g) | Graphite Half-Cell Discharge (mAh/g) | Relative Capacity Loss (%) |
|---|---|---|---|
| 100 (Fresh) | 336.0 | 360.0 | 0.0 |
| 90 (Cycled) | 345.0 | 423.0 | 2.7 |
| 60 (Cycled) | 196.2 | 228.0 | 45.5 |
The capacity loss of 45.5% from the anode half-cell directly demonstrates that structural failure of graphite is the dominant factor leading to the end-of-life of this energy storage battery. The higher discharge capacity compared to charge capacity in the aged samples is due to the loss of lithium inventory, which creates vacancies that are refilled from the lithium counter electrode in the half-cell setup.
Secondary Degradation: Electrolyte and SEI Layer
The structural failure of the graphite creates fresh, unpassivated surfaces. This triggers a cascade of parasitic reactions. X-ray Photoelectron Spectroscopy (XPS) depth profiling allowed me to measure the thickness of the SEI layer on the anode.
| SOH of Cell | SEI Thickness (nm) | Atomic Concentration of C (%) | Atomic Concentration of O (%) | Atomic Concentration of F (%) |
|---|---|---|---|---|
| 100 (Fresh) | 43.7 | 62.5 | 28.0 | 9.5 |
| 60 (Cycled) | 82.5 | 48.2 | 35.5 | 16.3 |
The SEI thickness nearly doubled. This growth consumes lithium ions and electrolyte solvent, directly contributing to LLI. The increase in oxygen and fluorine concentrations suggests the formation of Li2CO3, LiF, and other decomposition products. I analyzed the electrolyte composition using GC-MS and IC to confirm the depletion of critical components.
| Electrolyte Component | Fresh (wt%) | Aged 60% SOH (wt%) | Consumption Rate (%) |
|---|---|---|---|
| LiPF6 | 14.0 | 10.9 | 22.1 |
| Ethylene Carbonate (EC) | 41.6 | 35.0 | 15.9 |
| Ethyl Methyl Carbonate (EMC) | 12.3 | 9.4 | 23.6 |
| Vinylene Carbonate (VC) | 1.5 | 0.2 | 86.7 |
| Fluoroethylene Carbonate (FEC) | 0.5 | 0.1 | 80.0 |
The depletion of film-forming additives (VC, FEC) and the reduction in the main solvent (EC) and salt (LiPF6) indicate severe electrolyte degradation. This dry-out increases the internal resistance, which is evident in the DCIR data. Additionally, the separator, particularly the side facing the cathode, showed severe clogging. Permeability tests revealed that the time for 100 mL of air to pass through the separator increased from 190 seconds (fresh) to 526 seconds at the rear of the roll, indicating that reaction products are physically blocking ion transport.
Modeling the Capacity Fade of the Energy Storage Battery
Putting all the pieces together, I constructed a mechanistic model for the capacity fade of this energy storage battery. The degradation is not linear but follows a two-phase process. The initial phase (100% to 80% SOH) is dominated by linear LLI due to steady SEI growth. The second phase (below 80% SOH) is triggered by the structural failure of the graphite.
The sudden capacity drop can be described as a feedback loop:
1. Graphite anisotropy causes mechanical fatigue and cracking (LAM_NE).
2. Fresh surfaces react with the electrolyte, accelerating SEI formation (LLI).
3. SEI growth increases internal resistance and consumes electrolyte.
4. Lithium plating becomes more favorable on the high-resistance, disordered graphite, further accelerating failure.
I quantified the contribution of each mode using the data from my half-cells and dQ/dV analysis. The total capacity loss ($Q_{loss}$) is the sum of the loss of lithium inventory ($Q_{LLI}$) and the loss of active material ($Q_{LAM}$).
$$ Q_{loss} = Q_{LLI} + Q_{LAM} $$
$$ Q_{loss} = (1 – CE) \times Q_{test} + \Delta Q_{anode} + \Delta Q_{cathode} $$
Using the half-cell data, I could isolate the $Q_{LAM}$ for the anode and cathode. The remaining capacity loss was attributed to $Q_{LLI}$. For an energy storage battery cycled to 60% SOH:
$$ Q_{loss, total} = 280Ah – 162Ah = 118Ah (100\%) $$
$$ Q_{LAM, anode} = 280Ah \times 0.455 = 127Ah (107\%) $$
$$ Q_{LAM, cathode} = 280Ah \times 0.04 = 11Ah (9\%) $$
Note that the contributions appear to overlap. The LLI is primarily a consequence of the LAM in the anode. The structural damage exposes new surfaces, which consume active lithium. The mathematical relationship for the effective lithium loss due to surface area increase can be expressed as:
$$ \frac{dQ_{LLI}}{dt} = k \cdot A(t) \cdot c^{n}_{electrolyte} $$
Where $A(t)$ is the time-dependent surface area of the anode, which increases exponentially as cracks propagate. This model fits the observed acceleration of decay in the energy storage battery.
Conclusion: The Graphite Bottleneck in High-Temperature Energy Storage Batteries
My comprehensive investigation of a 280 Ah LFP/graphite energy storage battery at 45 °C leads to a definitive conclusion: the structural failure of the graphite anode is the root cause of performance degradation. The LFP cathode acts as a reliable partner, retaining most of its capacity, while the anode suffers a catastrophic loss of order, leading to a 45.5% loss of its active material function.
This structural collapse of the graphite is the primary driver for the cascade of secondary failures observed: the thickening of the SEI layer (from 43.7 nm to 82.5 nm), the decomposition of electrolyte components (EC, EMC, LiPF6), and the depletion of additives. This cascade consumes the active lithium inventory, which accelerates the capacity fade in a positive feedback loop. While the LFP cathode itself is stable, the overall energy storage battery system is rendered inoperable due to the anode’s inability to host lithium, combined with the resulting ionic resistance from separator clogging and electrolyte starvation.
To improve the lifetime of energy storage battery systems operating under high-temperature conditions, my analysis suggests that the focus should be placed on stabilizing the graphite structure. Strategies such as using artificial SEI layers, developing highly oriented pyrolytic graphite (HOPG) with better mechanical integrity, or employing electrolyte additives that can form a more robust and flexible SEI are critical. Without addressing the intrinsic structural vulnerability of the graphite anode, the long-term reliability of LFP-based energy storage battery systems will remain limited by the weakest link in the chain, which is clearly the negative electrode.