
Our research focuses on developing an efficient and robust system for identifying faults in solar panels using infrared video captured by unmanned aerial vehicles (UAVs) and a deep learning-based object detection algorithm. Solar panels are widely deployed in outdoor environments and are susceptible to two major types of faults: foreign object occlusion (e.g., leaves, bird droppings, plastic bags) and internal hot spots (thermal anomalies caused by cell damage). Traditional inspection methods, such as monitoring output power or using handheld infrared cameras, are labor-intensive and inefficient. To address these challenges, we propose a system based on the Single Shot MultiBox Detector (SSD) algorithm, which can simultaneously detect and classify both types of faults with high accuracy. In this paper, we present the methodology, data preparation, model training, experimental results, and future improvements of our system.
1. Introduction
The increasing demand for renewable energy has led to the large-scale deployment of solar panels in photovoltaic (PV) power plants. However, solar panels are constantly exposed to harsh environmental conditions, leading to performance degradation and faults. Two common issues are foreign object occlusion and hot spot formation. Foreign objects such as dust, leaves, and bird droppings can partially block sunlight, reducing power output and potentially causing localized heating. Hot spots, on the other hand, result from cell mismatch, shading, or manufacturing defects, which can cause irreversible damage if not detected early. Rapid and accurate identification of these faults is crucial for maintaining the efficiency and longevity of solar panel installations.
Existing methods for fault detection include electrical monitoring, thermography, and image processing. Electrical monitoring analyzes the current-voltage characteristics of the solar panel array, but it cannot localize faults precisely. Thermographic inspection using handheld infrared cameras is effective but slow and requires manual interpretation. Recent advances in computer vision and deep learning have enabled automated fault detection from infrared images. For instance, Otsu-based methods and edge detection algorithms like Canny have been applied, but they often fail to handle complex backgrounds and varying lighting conditions. Convolutional neural networks (CNNs) have shown promise, but many approaches focus solely on hot spot detection, leaving other fault types unaddressed. Our work aims to fill this gap by using the SSD algorithm – a one-stage object detector – to simultaneously detect foreign objects and hot spots from infrared video streams.
2. SSD Algorithm Overview
The SSD algorithm is a popular one-stage object detection framework that balances speed and accuracy. Unlike two-stage detectors (e.g., Faster R-CNN), SSD performs a single forward pass to predict both bounding boxes and class probabilities. The base network is typically a pre-trained VGG-16, which is followed by several auxiliary convolutional layers that produce feature maps at different scales. These feature maps are used to generate default bounding boxes (also known as prior boxes) with various aspect ratios and scales. For each default box, the model predicts offsets relative to the box coordinates and confidence scores for each class. The key advantage of SSD is its ability to detect objects of different sizes by leveraging multi-scale feature maps. Small objects are detected from early, high-resolution feature maps, while large objects are captured from deeper, low-resolution feature maps.
The loss function of SSD consists of two parts: localization loss (smooth L1) and confidence loss (softmax cross-entropy). To improve generalization and prevent overfitting, we applied label smoothing regularization. Label smoothing modifies the target probability distribution by assigning a small probability to non-target classes, thereby reducing the model’s overconfidence. The formulation is as follows:
$$
P_i = \begin{cases} 1, & \text{if } i = y \\ 0, & \text{if } i \neq y \end{cases} \quad \longrightarrow \quad P_i = \begin{cases} 1 – \varepsilon, & \text{if } i = y \\ \dfrac{\varepsilon}{K-1}, & \text{if } i \neq y \end{cases}
$$
where \(K\) is the number of classes, \(\varepsilon\) is the smoothing parameter (set to 0.6 in our experiments), and \(y\) is the ground-truth class. The cross-entropy loss then becomes:
$$
\text{Loss} = -\sum_{i=1}^{K} p_i \log q_i \quad \longrightarrow \quad \text{Loss}_i = \begin{cases} (1-\varepsilon) \times \text{Loss}, & \text{if } i = y \\ \varepsilon \times \text{Loss}, & \text{if } i \neq y \end{cases}
$$
This regularization prevents the model from assigning extreme probabilities and improves its robustness to unseen variations.
3. Data Acquisition and Preparation
Our infrared video data were collected at a utility-scale photovoltaic power plant using a UAV equipped with a thermal camera. The UAV followed a predefined flight path at a fixed altitude and angle, capturing continuous video of the solar panel arrays. The videos were stored in common formats. To extract training images, we sampled frames every 12 frames from the video streams. We then manually inspected each frame and discarded those with excessive blur, reflections, or where the solar panel area occupied less than 80% of the frame. This filtering step ensured that the dataset contained high-quality images suitable for training.
We selected 1150 infrared images that exhibited either hot spots or foreign object occlusions. Among them, 1030 images contained hot spots, and 620 images contained foreign objects. Note that some images contained both fault types. All faults were annotated by experts using the LabelImg tool, generating XML files in PASCAL VOC format. Each fault was labeled with a tight bounding box. Hot spots were annotated as class “hotspot” and foreign objects as class “foreign”. The dataset was split into training and testing sets in a 7:3 ratio, resulting in 805 training images and 345 testing images. The following table summarizes the dataset statistics:
| Fault Type | Training Images | Testing Images | Total Annotations |
|---|---|---|---|
| Hot Spot | 721 | 309 | 1030 |
| Foreign Object | 434 | 186 | 620 |
| Total | 1155 (with overlap) | 495 (with overlap) | 1650 |
4. Model Training Configuration
We implemented the SSD model using a deep learning framework (e.g., PyTorch or TensorFlow). The base network was VGG-16 pre-trained on ImageNet. We added extra convolutional layers (Conv4_3, Conv7, Conv8_2, Conv9_2, Conv10_2, Conv11_2) to produce feature maps of sizes 38×38, 19×19, 10×10, 5×5, 3×3, and 1×1, respectively. Default boxes were generated with aspect ratios of 1:1, 1:2, 2:1, 1:3, and 3:1. The number of default boxes per feature map cell varied from 4 to 6, resulting in a total of 8732 default boxes per image. During training, we used hard negative mining to balance positive and negative samples with a ratio of 1:3.
We applied data augmentation techniques including random cropping, horizontal flipping, color jittering, and brightness adjustments to improve generalization. The training hyperparameters are listed in Table 2.
| Parameter | Value |
|---|---|
| Label Smoothing (ε) | 0.6 |
| Initial Learning Rate | 0.04 |
| Batch Size | 32 |
| Number of Epochs | 150 |
| Momentum | 0.9 |
| Weight Decay | 5×10⁻⁴ |
| Learning Rate Decay | Step decay at epochs 80 and 120 (factor 0.1) |
The loss curve during training is shown in Figure 1 (not displayed here due to formatting constraints). The total loss converged smoothly after approximately 120 epochs, indicating stable training. No signs of overfitting were observed, which we attribute to the label smoothing regularization and data augmentation.
5. Experimental Results and Analysis
We evaluated the trained model on the testing set (345 images). The detection performance was measured using precision, recall, and F1-score. For each fault type, we counted the number of ground-truth annotations and the number of correctly detected annotations (Intersection over Union > 0.5). The results are summarized in Table 3.
| Fault Type | Ground-Truth Annotations | Correctly Detected | Detection Accuracy |
|---|---|---|---|
| Hot Spot | 309 | 298 | 96.4% |
| Foreign Object | 186 | 169 | 90.9% |
| Overall | 495 | 467 | 94.3% |
Our SSD-based system achieved an overall detection accuracy of 94.3% on the test set. The hot spot detection rate was 96.4%, while foreign object detection was slightly lower at 90.9%. This difference is likely because foreign objects exhibit more diverse shapes, sizes, and thermal signatures compared to the relatively consistent thermal patterns of hot spots. Examples of detection outputs (not shown) illustrate that the model correctly localizes both fault types, with green bounding boxes for hot spots and cyan bounding boxes for foreign objects. The model also shows robustness to partial occlusions and varying backgrounds.
We compared our method with a baseline approach using Otsu thresholding and Canny edge detection. The baseline achieved only 72% accuracy for hot spot detection and failed to reliably detect foreign objects due to the lack of clear edges. In contrast, the deep learning-based SSD method significantly outperformed traditional image processing techniques.
6. Discussion
Our results demonstrate that the SSD algorithm, combined with infrared video from UAVs, provides a practical and accurate solution for solar panel fault detection. The system can process video frames in real time and simultaneously identify both hot spots and foreign objects. This capability is crucial for large-scale PV plants where manual inspection is impractical. The use of label smoothing helped improve generalization, as evidenced by the stable convergence and high testing accuracy.
However, several limitations remain. First, the dataset used in this study was collected from a single PV plant with specific panel layouts and environmental conditions. The model may need retraining or fine-tuning when applied to different sites with varying panel tilt angles, background textures, or climatic conditions. Second, the flight altitude and angle of the UAV significantly affect the quality of the infrared images. Too low an altitude reduces the field of view, while too high an altitude may obscure small faults. Future work could explore adaptive flight planning to optimize image capture. Third, our current system only classifies faults into two broad categories. There is potential to further subdivide foreign objects by type (e.g., leaves, bird droppings, dust) and hot spots by severity, which would provide more actionable information for maintenance crews.
We also note that the infrared video often contains reflections from the glass surface of solar panels, which can cause false positives. Although our model was trained with such examples, incorporating additional noise-removal preprocessing might further improve robustness. Another area for improvement is the integration of temporal information from consecutive video frames, which could help distinguish transient occlusions from permanent faults.
7. Conclusion and Future Work
In this work, we presented a fault detection system for solar panels based on the SSD object detection algorithm and far-infrared video captured by UAVs. The system automatically identifies two common types of faults – hot spots and foreign object occlusions – with an overall accuracy exceeding 94%. Our approach addresses the inefficiency of traditional manual inspection and provides a scalable solution for modern PV power plants. The use of label smoothing regularization contributed to the model’s robustness and generalization ability.
Future research directions include:
- Expanding the dataset with images from multiple PV plants under diverse weather and lighting conditions to improve model transferability.
- Investigating more advanced architectures such as EfficientDet or YOLOv5 that may offer better speed-accuracy trade-offs.
- Incorporating temporal analysis by processing video sequences with recurrent neural networks or 3D convolutions to reduce false positives and detect evolving faults.
- Developing a severity rating system for hot spots based on the area and temperature gradient, enabling predictive maintenance scheduling.
We believe that integrating our system into the routine operation of solar panel inspection can significantly reduce downtime, increase energy yield, and lower maintenance costs. The combination of UAVs and deep learning is a promising avenue for the future of photovoltaic plant management.
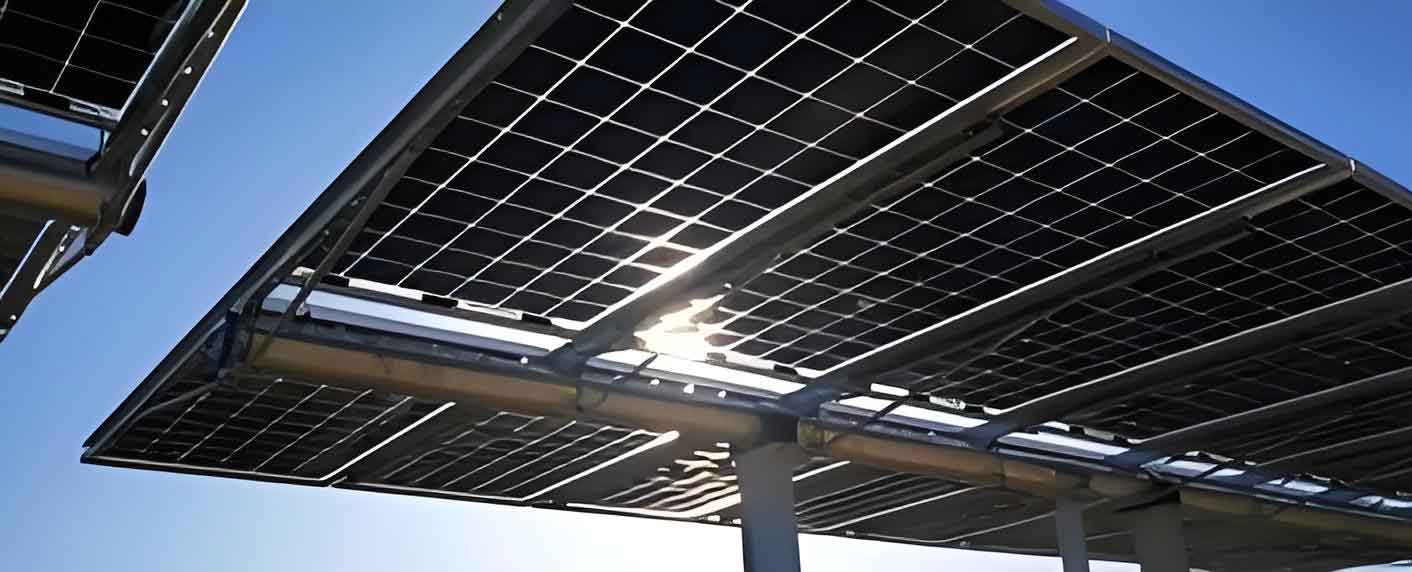
(Note: The image above illustrates a typical bifacial solar panel installation, which is relevant to the type of solar panels we study. The infrared characteristics of such panels are similar to those in our dataset.)
In summary, our research contributes a practical and effective method for solar panel fault detection that leverages modern deep learning and remote sensing technologies. We hope this work will inspire further developments in automated photovoltaic system monitoring.