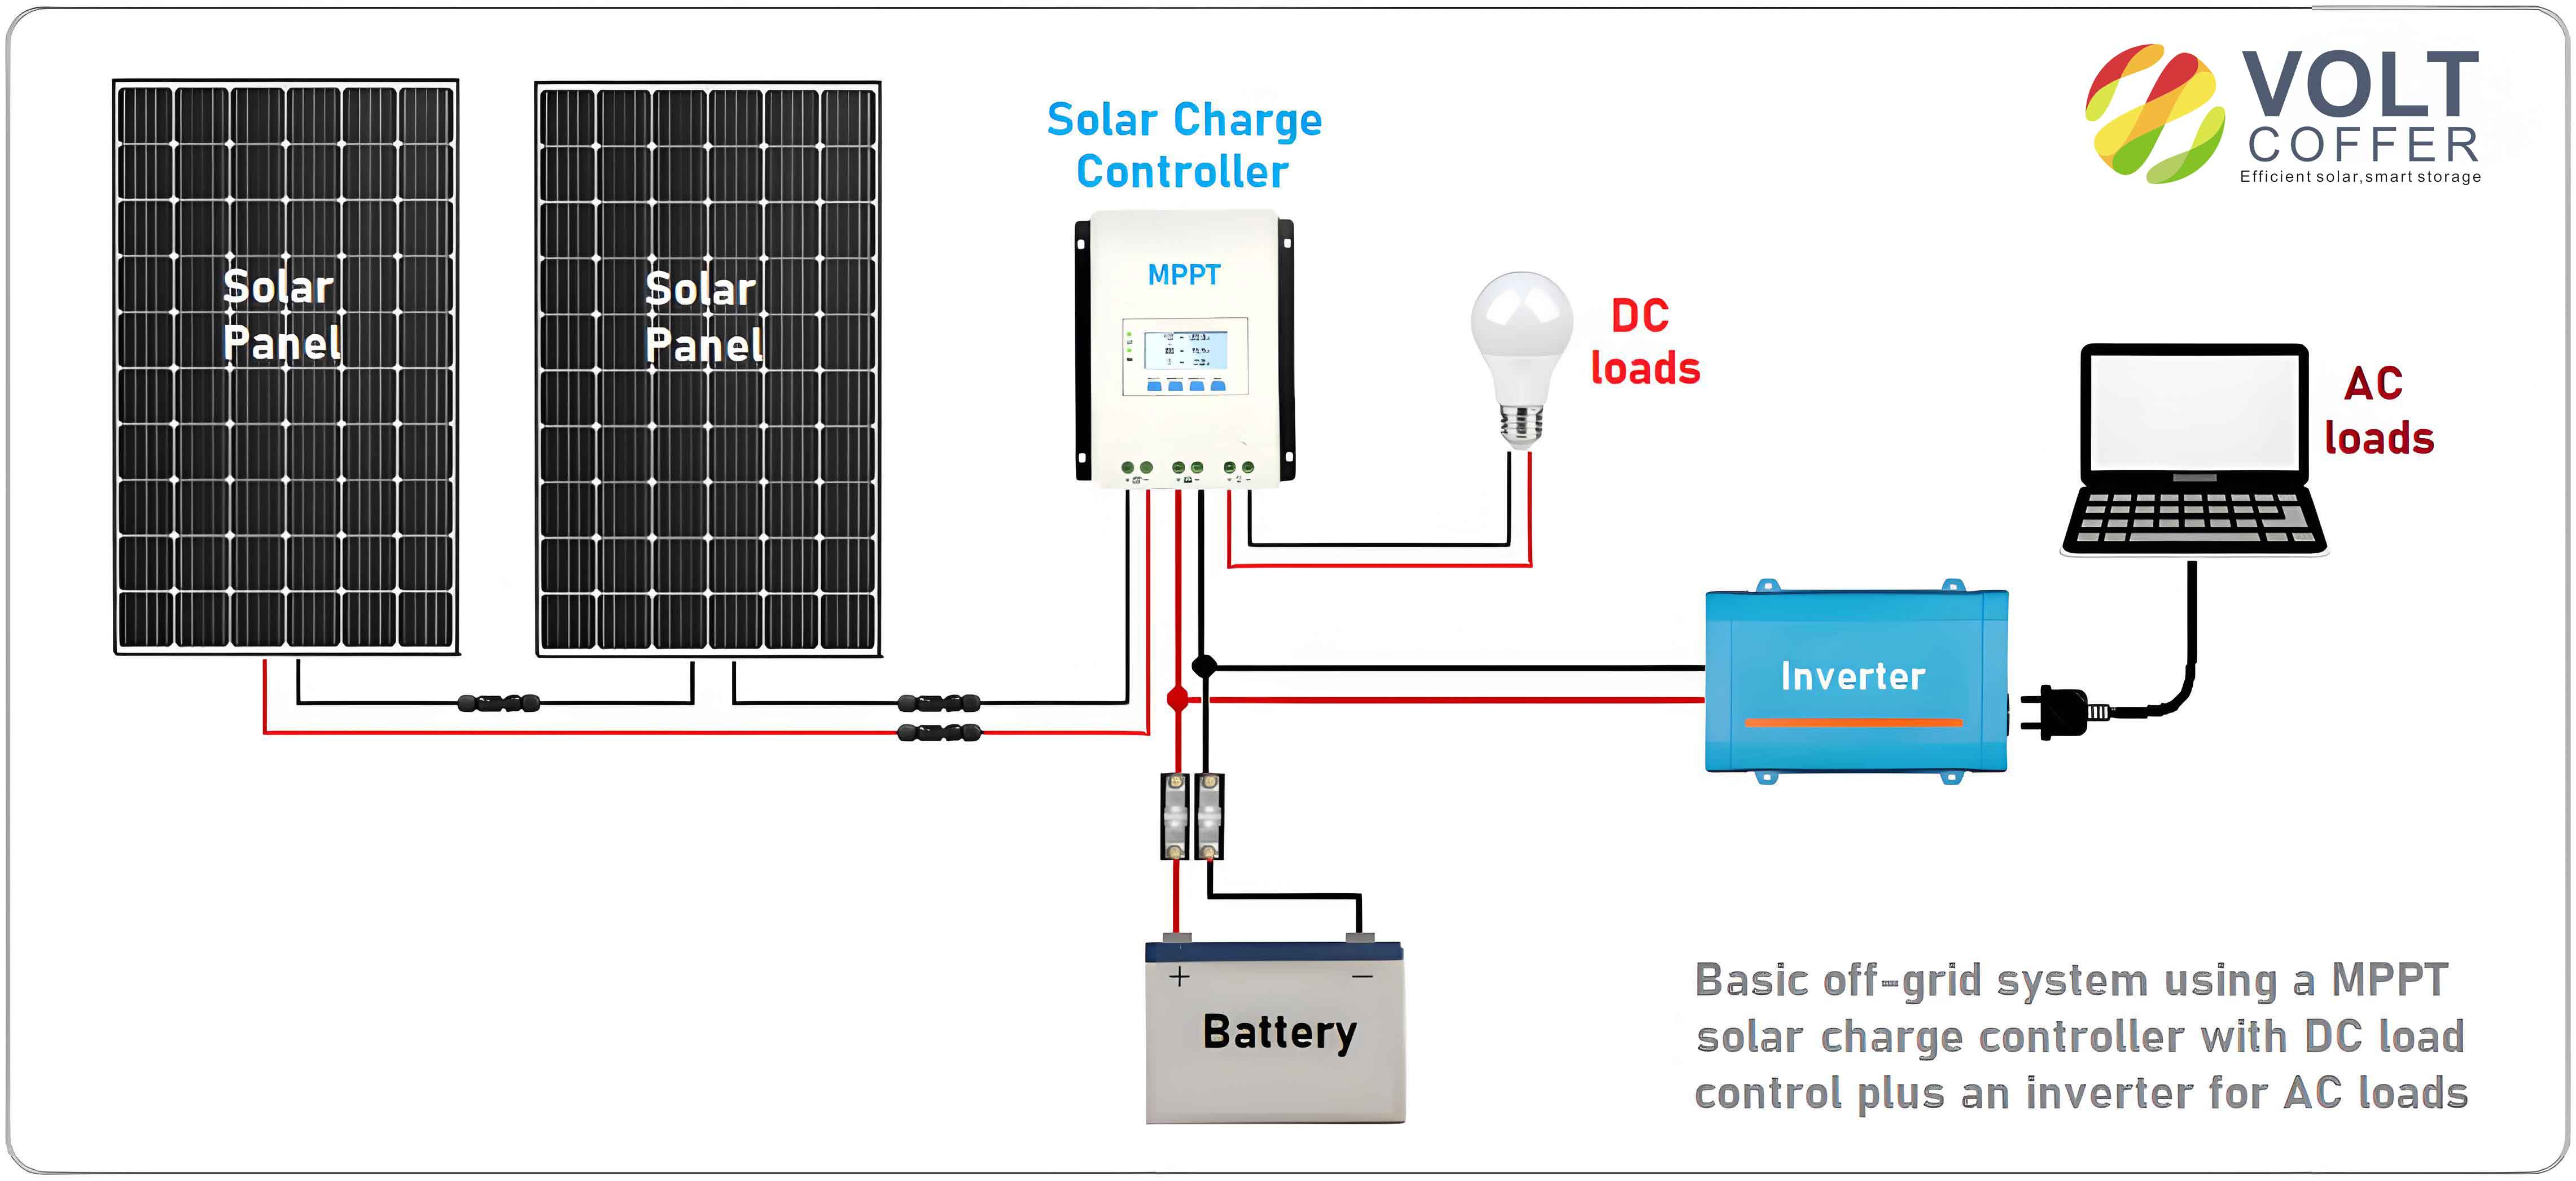
In recent years, the global transition toward renewable energy has intensified, with photovoltaic (PV) systems playing a pivotal role. However, partial shading conditions (PSC) often induce multi-peak characteristics in PV arrays, challenging traditional maximum power point tracking (MPPT) algorithms. Conventional methods, such as perturb-and-observe (P&O) and incremental conductance (INC), struggle to distinguish global maxima under PSC, leading to power loss and inefficiency. To address this, we propose a novel MPPT strategy based on an Improved Parrot Optimization (IPO) algorithm, integrating Halton sequence initialization, tangent flight mechanisms, and somersault foraging strategies. This approach enhances tracking accuracy, convergence speed, and robustness in dynamic shading environments.

1. Photovoltaic Array Modeling Under Partial Shading
1.1 PV Cell Equivalent Circuit
The simplified PV cell model comprises a current source, diode, and series/parallel resistances. The output current IpIp is expressed as:Ip=Iph−Io[exp(q(Up+IpRs)AKT)−1]−Up+IpRsRshIp=Iph−Io[exp(AKTq(Up+IpRs))−1]−RshUp+IpRs
where IphIph: photocurrent, IoIo: reverse saturation current, RsRs: series resistance, RshRsh: shunt resistance, AA: ideality factor, TT: temperature, and KK: Boltzmann constant.
1.2 Multi-Peak Characteristics
Under PSC, the power-voltage (P-V) curve exhibits multiple local maxima. For a 3×1 PV array with parameters Uoc=37.3 VUoc=37.3V, Isc=8.66 AIsc=8.66A, Um=30.7 VUm=30.7V, and Im=8.15 AIm=8.15A, shading scenarios were simulated (Table 1).
Table 1: Irradiance Conditions for Multi-Peak Analysis
| Scenario | PV1 (W/m²) | PV2 (W/m²) | PV3 (W/m²) |
|---|---|---|---|
| No Shading | 1000 | 1000 | 1000 |
| Shading 1 | 1000 | 1000 | 800 |
| Shading 2 | 810 | 730 | 620 |
| Shading 3 | 400 | 300 | 100 |
Simulations confirmed that shading reduces irradiance non-uniformly, generating 2–3 peaks in the P-V curve. Traditional MPPT methods frequently trap at local maxima, necessitating advanced optimization algorithms.
2. Improved Parrot Optimization (IPO) Algorithm
2.1 Traditional Parrot Optimization (PO)
The PO algorithm mimics four parrot behaviors: foraging, staying, communicating, and fearing. Initial positions xixi are randomized within bounds [lb,ub][lb,ub]:xi=rand(ub−lb)+lbxi=rand(ub−lb)+lb
Foraging updates positions using Lévy flights:xit+1=(xi−xbest)⋅Levy(d)+rand(1−ttmax)⋅2ttmax⋅xmeanxit+1=(xi−xbest)⋅Levy(d)+rand(1−tmaxt)⋅tmax2t⋅xmean
where xbestxbest: global best position, xmeanxmean: population mean, and Levy(d)Levy(d): step size.
2.2 Key Enhancements in IPO
- Halton Sequence Initialization
Traditional random initialization causes uneven exploration. Halton sequences, based on prime numbers, improve population diversity:H(n)=[ϕp1(n),ϕp2(n)]H(n)=[ϕp1(n),ϕp2(n)]where ϕp(n)ϕp(n): radical inverse function, p1,p2p1,p2: primes. For N=100N=100, Halton distributes particles uniformly, reducing search gaps (Figure 1). - Tangent Flight Mechanism
Replacing Lévy flights with tangent flights balances exploration and exploitation:xt+1=xt+S⋅tan(θ)xt+1=xt+S⋅tan(θ)Here, SS: step size, θθ: direction angle. This avoids erratic jumps and enhances global search capability. - Somersault Foraging Strategy
To prevent premature convergence, individuals “somersault” around the global best xbestxbest:Ost+1=Ost+S⋅(r1⋅xbest−r2⋅Ost)Ost+1=Ost+S⋅(r1⋅xbest−r2⋅Ost)where S=2S=2, r1,r2∈[0,1]r1,r2∈[0,1]. This strategy adaptively narrows search ranges, accelerating convergence.
3. Performance Evaluation
3.1 Benchmark Function Tests
IPO was tested against PO, Golden Jackal Optimization (GJO), Gray Wolf Optimization (GWO), and others using CEC2005 functions f1f1-f9f9. Parameters: N=30N=30, tmax=500tmax=500.
Table 2: Optimization Results for Test Functions
| Function | Metric | IPO | PO | GJO | GWO |
|---|---|---|---|---|---|
| f1f1 | Best | 0 | 4.45e-144 | 1.61e-55 | 7.76e-29 |
| Std | 0 | 7.24e-122 | 1.03e-54 | 9.46e-28 | |
| f7f7 | Best | 0 | 2.98e-05 | 1.37e-04 | 6.67e-04 |
| Std | 0 | 5.33e-05 | 6.25e-04 | 0.0027 |
IPO achieved zero deviation in f1f1, f7f7, and f9f9, outperforming competitors in stability and precision.
3.2 MPPT Simulation Under PSC
A 3×1 PV array with Uoc=43.6 VUoc=43.6V, Isc=8.35 AIsc=8.35A, and Pmax=266 WPmax=266W was simulated under static and dynamic shading.
Table 3: Static Shading Performance Comparison
| Algorithm | Tracking Time (s) | Steady Power (W) | Accuracy (%) |
|---|---|---|---|
| IPO | 0.059 | 522.13 | 98.75 |
| PO | 0.108 | 521.25 | 98.58 |
| GJO | 0.127 | 519.28 | 98.21 |
Table 4: Dynamic Shading Performance Comparison
| Algorithm | Tracking Time (s) | Steady Power (W) | Accuracy (%) |
|---|---|---|---|
| IPO | 0.077 | 310.86 | 98.23 |
| PO | 0.112 | 302.33 | 97.26 |
| GJO | 0.127 | 301.25 | 96.91 |
IPO reduced tracking time by 31–50% and improved accuracy by 0.97–1.32% over alternatives.
4. Experimental Validation
A hardware platform comprising a PVS1000 simulator, Buck-Boost converter, and STM32 controller validated IPO’s efficacy. Under irradiance steps from 1000→800→600 W/m², IPO achieved stable power output within 0.077s, outperforming GWO and PO (Figure 2).
Table 5: Experimental Tracking Efficiency
| Algorithm | Tracking Accuracy (%) |
|---|---|
| IPO | 99.96 |
| PO | 98.87 |
| GWO | 98.32 |
5. Conclusion
The proposed IPO-based MPPT strategy addresses multi-peak challenges under PSC through three innovations:
- Halton initialization ensures uniform population distribution.
- Tangent flights enhance global search and avoid local traps.
- Somersault foraging accelerates convergence via adaptive range reduction.
Experimental results demonstrate IPO’s superiority: 98.23–99.96% tracking accuracy, 0.059–0.077s response time, and minimal oscillations. This work advances MPPT technology for real-world PV systems operating under dynamic environmental conditions.
