
With the development and popularization of computer technology, CFD technology has undergone rapid development. Due to its advantages of low cost and easy operation in solving fluid flow problems, it is widely used in various engineering fields. This chapter first presents the overall physical model of the container, proposes a thermal management scheme based on the structural characteristics of the container energy storage system, and analyzes the working mechanism of thermal management. Secondly, elaborate on the simulation methods and mathematical models used in the calculation. On this basis, algorithm validation and grid independence testing are conducted to provide a technical foundation for the simulation and exploration of heat transfer and flow patterns in energy storage battery systems.
1. Thermal management plan for container energy storage system
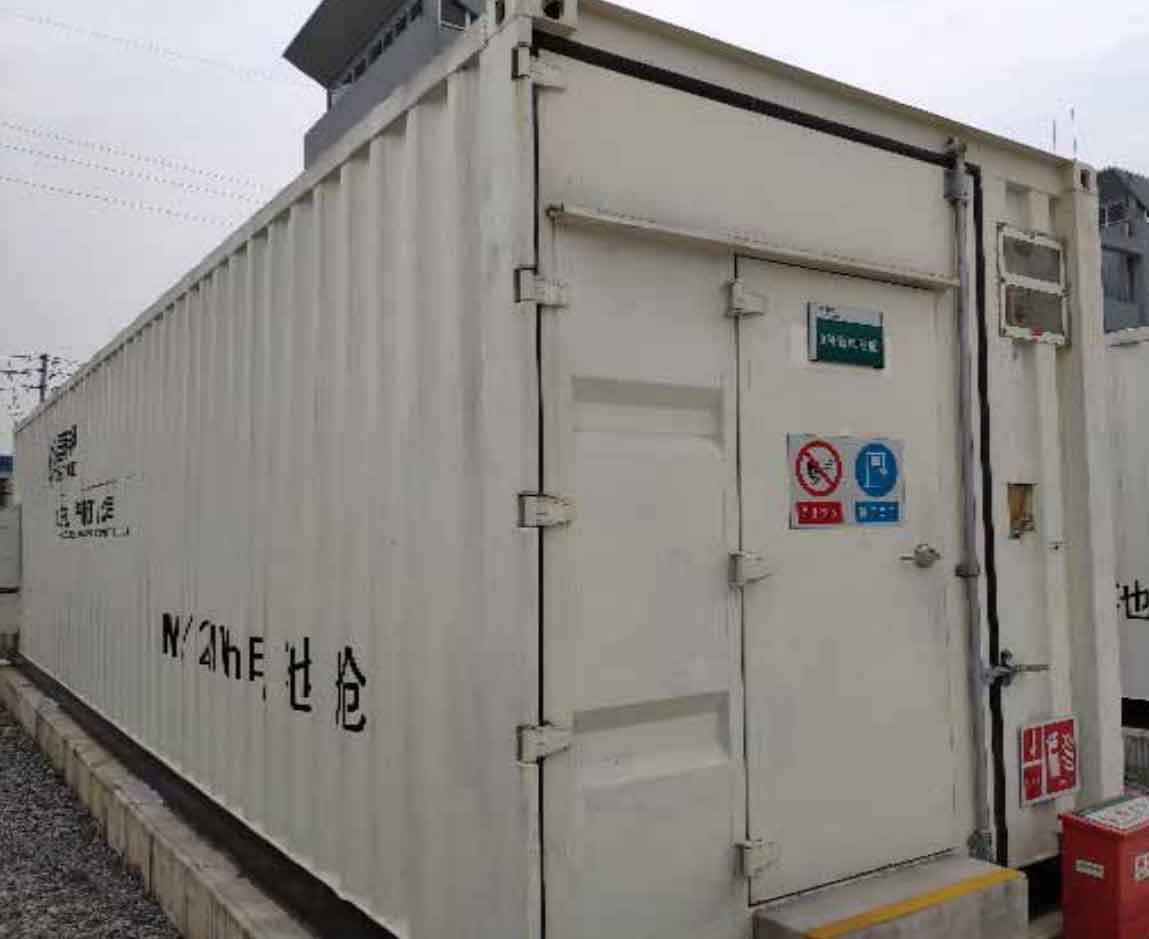
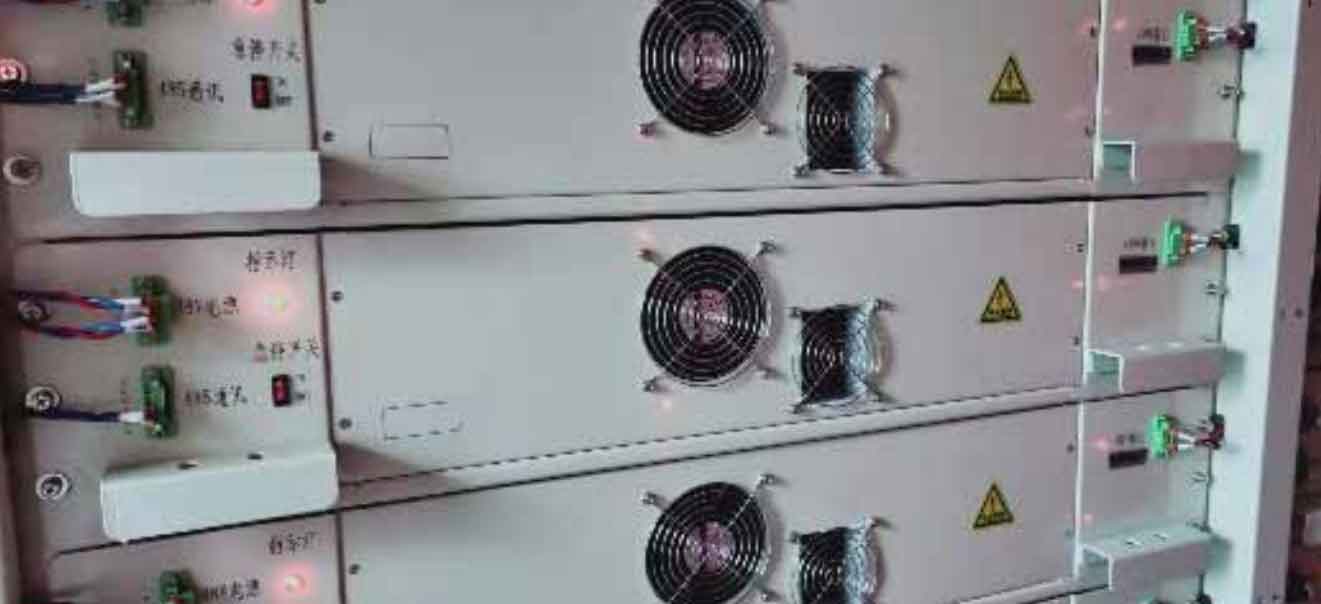
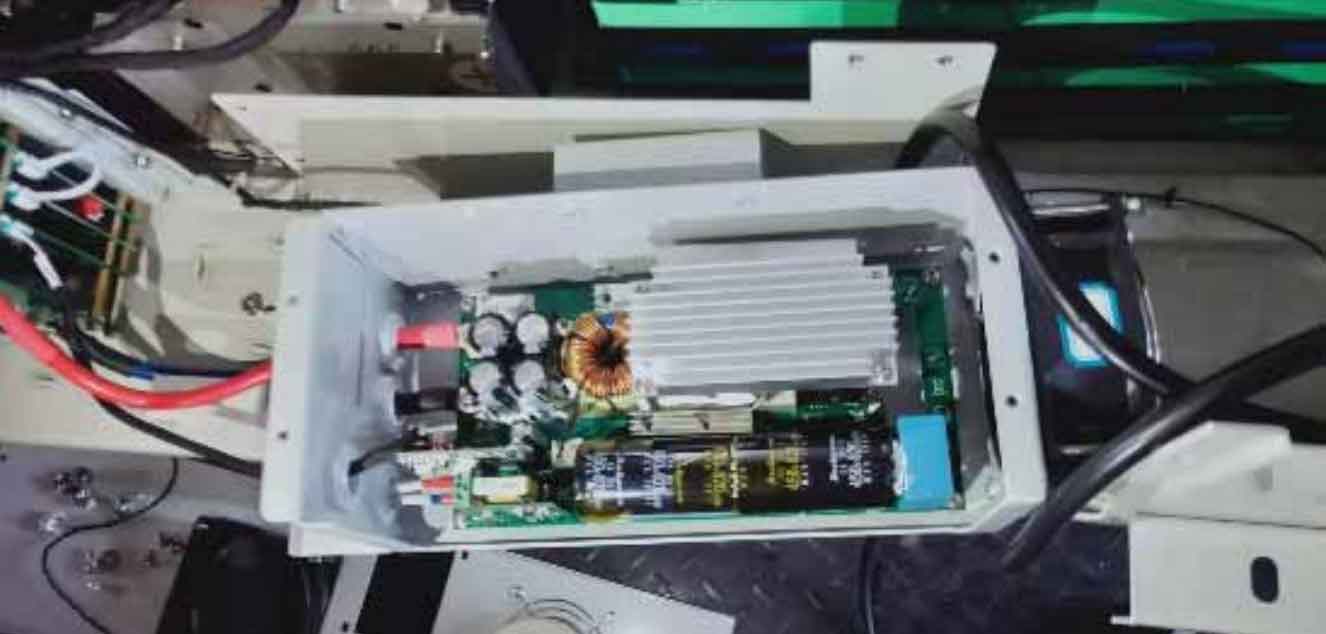
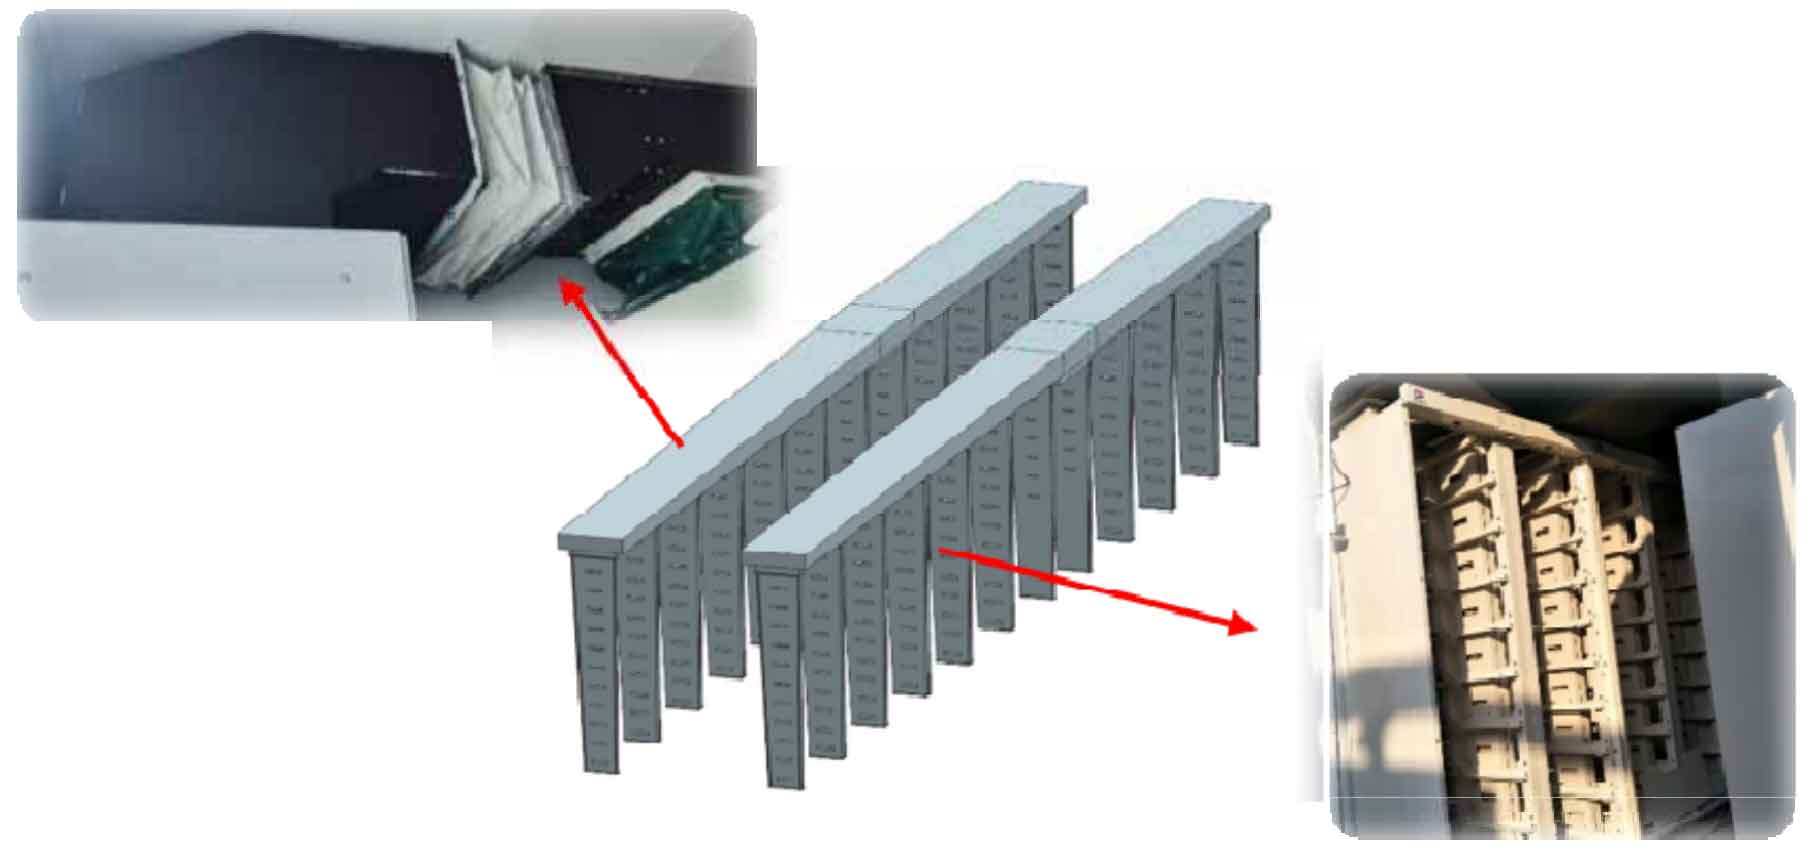
Container energy storage system is an integrated energy storage system developed to meet the needs of the mobile energy storage market. It mainly consists of components such as box structure, power control cabinet, air supply box, cooling pipeline, battery cabinet, and battery box. Each battery cabinet is stacked with 8-12 sets of battery boxes, which become a key component of the entire container energy storage system and a key focus of thermal management due to their high heat flux density and dense layout. The structure of the energy storage system, battery cabinet, and battery box is shown in Figures 1-3.
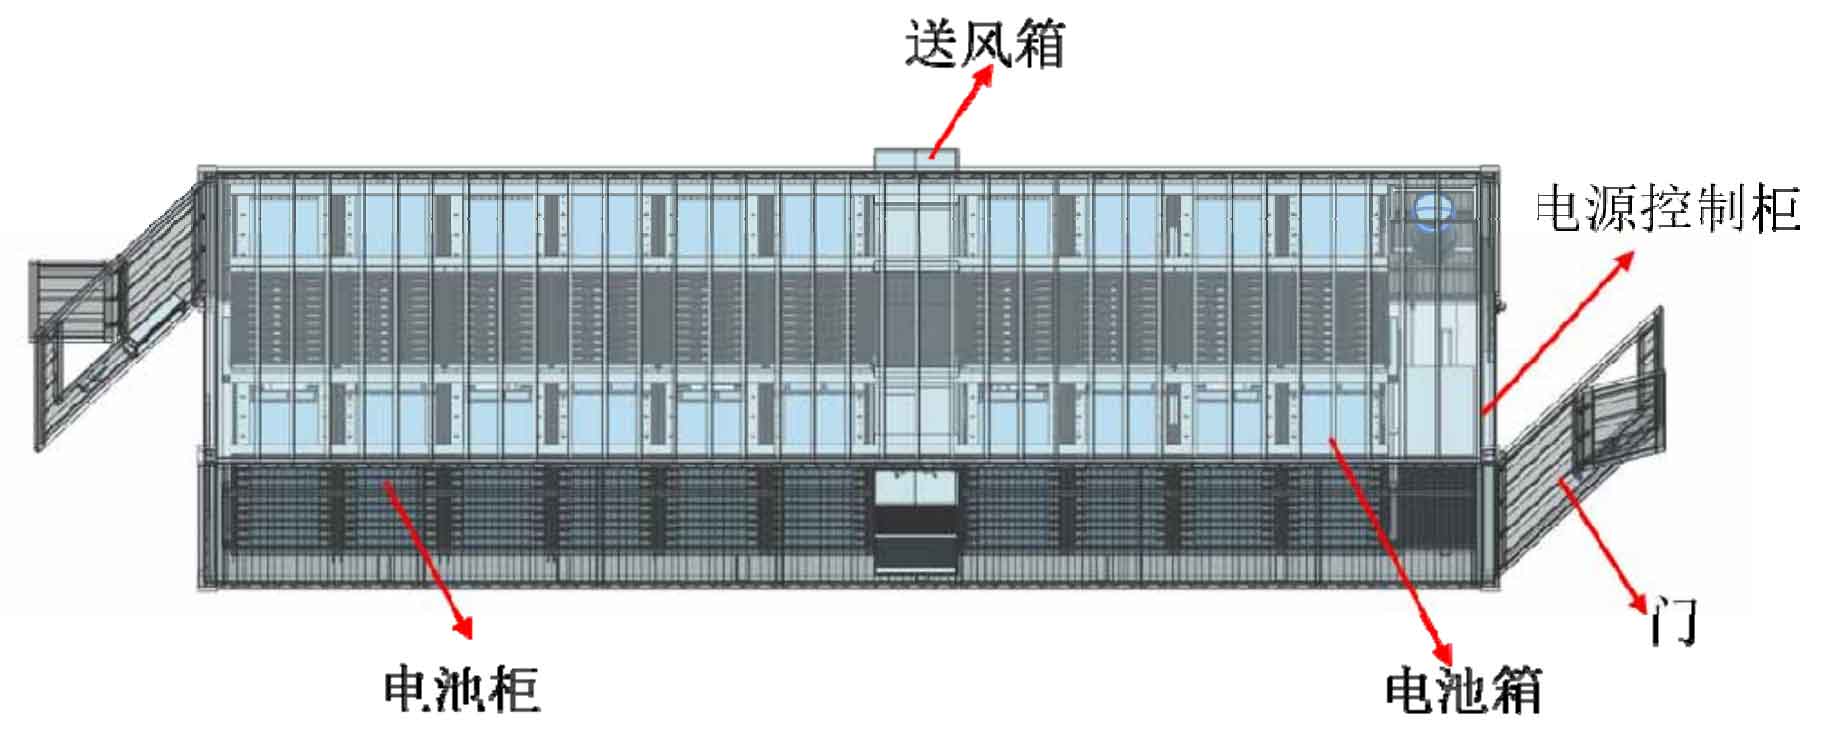
Based on the characteristics of the container energy storage system, the following thermal management scheme is proposed: cold air is sent from the air supply box to the main air duct, then enters the riser through the main air duct, and finally enters the battery box through the riser to effectively dissipate heat from the battery, ultimately achieving personalized heat dissipation for the energy storage battery module. Figure 4 shows the data model diagram of container CATIA and the model diagrams of various parts of the container. Figure 5 shows the air duct layout of the thermal management system.
2. Modeling of container energy storage system
Container energy storage systems generally involve dozens of battery cabinets, with 8-12 sets of battery boxes in each row. Each battery box also includes 16 battery cell groups. Therefore, building a grid model of the entire container energy storage system based on the microstructure of the battery box is relatively complex and has a huge computational scale. Therefore, this article proposes a modular processing method, which involves separately heat treating the air duct and battery box, and finally conducting integrated thermal verification. The battery box and air duct of the container energy storage system are modeled separately below.
2.1 Construction of battery box model
Energy storage container batteries complete the supply and demand balance of the power system through lithium battery charging and discharging. During the process of battery charging and discharging, the battery emits a large amount of heat. If the battery is in a high temperature state or thermal runaway state for a long time (the heating rate of the battery exceeds 1/min ℃), it will cause significant changes in the thermal and electrical characteristics of the battery, thereby reducing its service life, Therefore, it is particularly necessary to study reducing the operating temperature of batteries. The battery box model is shown in Figure 6.
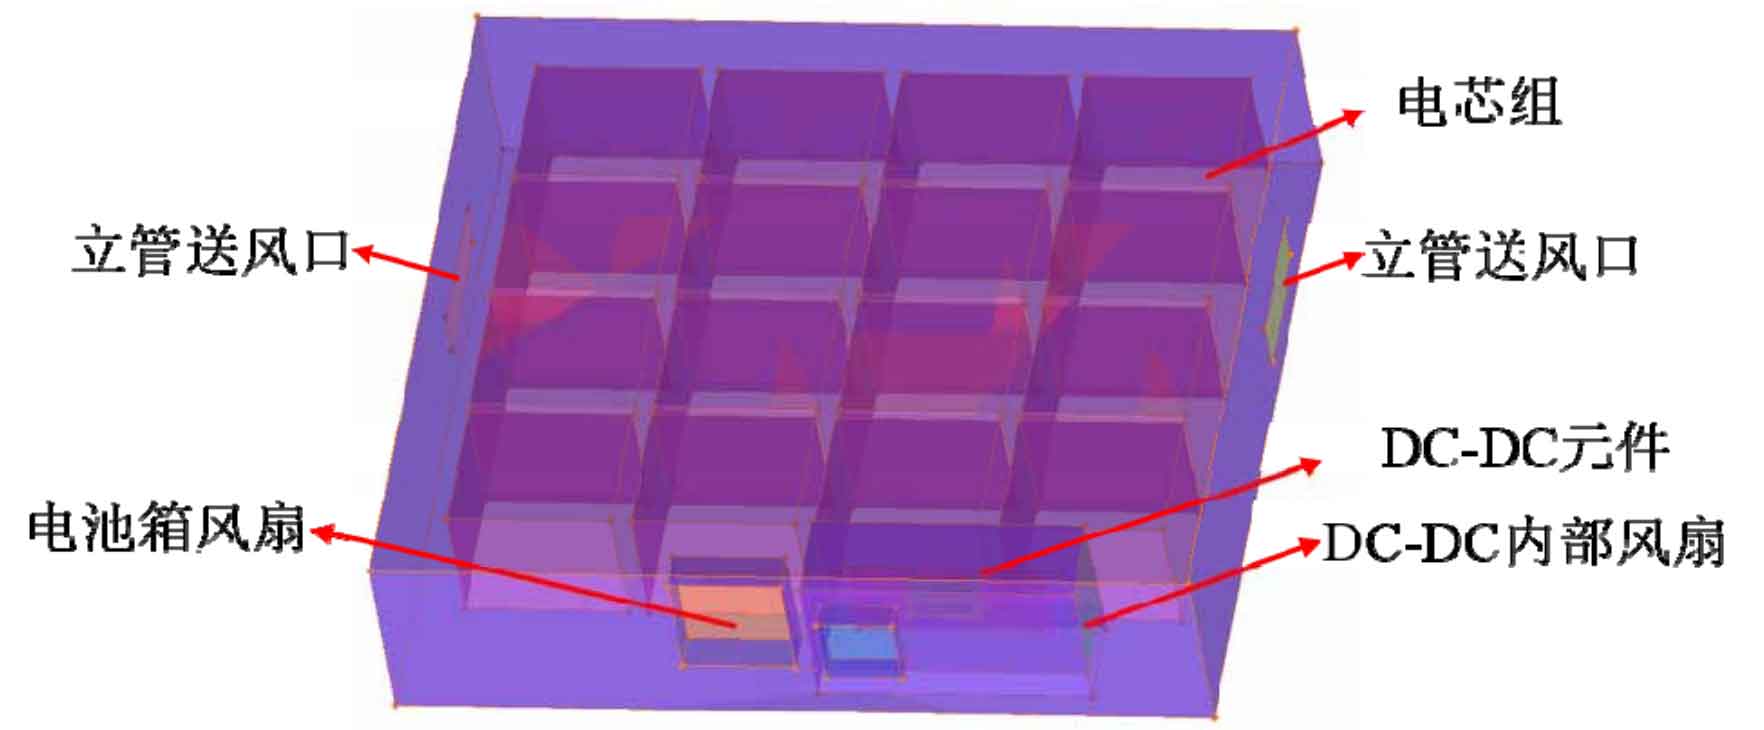
As shown in Figure 6, both sides of the battery box are air supply inlets for vertical pipes, and the front end of the battery box is composed of a fan and a DC-DC element. Among them, the DC-DC element is one of the main heating elements except for the battery cell, and a fan is added to the front end of the DC-DC element to cool it; The entire battery box has a total of 48 cells, of which 3 cells are a set of batteries, 12 cells are in a row, and the entire battery box has 4 rows of batteries. Due to the small spacing between the cells, an integrated simplification treatment is carried out here.
2.2 Construction of cooling air duct model
The prerequisite for meeting the heat dissipation needs of a single battery box is to ensure that there is sufficient air supply at the entrance of each battery box. Therefore, the overall heat dissipation effect of the battery box also depends on the uniformity of the air supply in the cooling ducts and the guarantee of the air supply. The cooling ducts of the battery box are symmetrically distributed on both sides of the container, the battery pack is distributed between the risers, and the spacing between the risers is equal. The battery box is evenly distributed in each column, as shown in Figure 7 for the specific model.
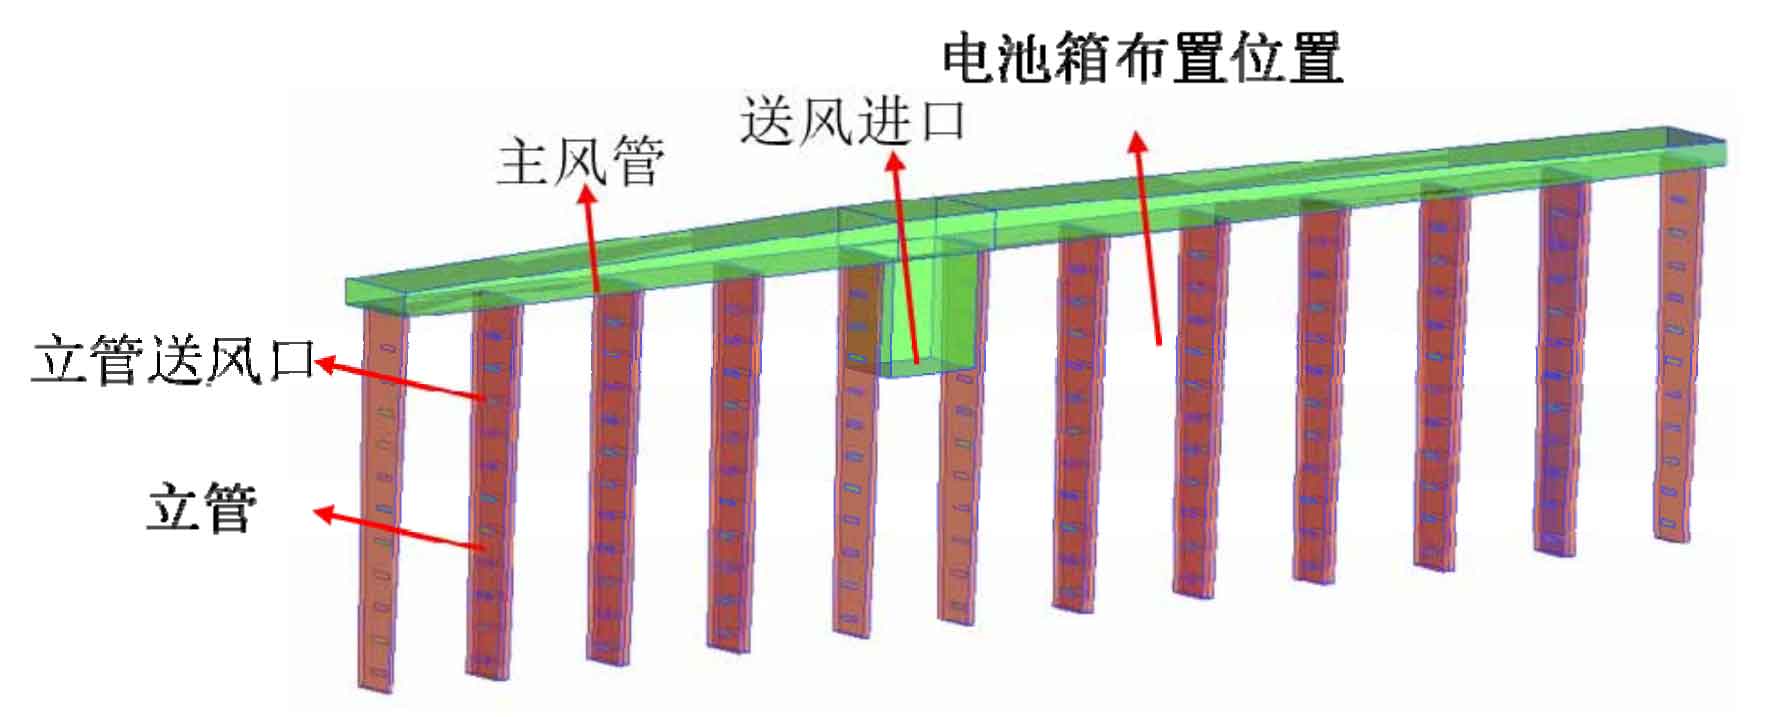
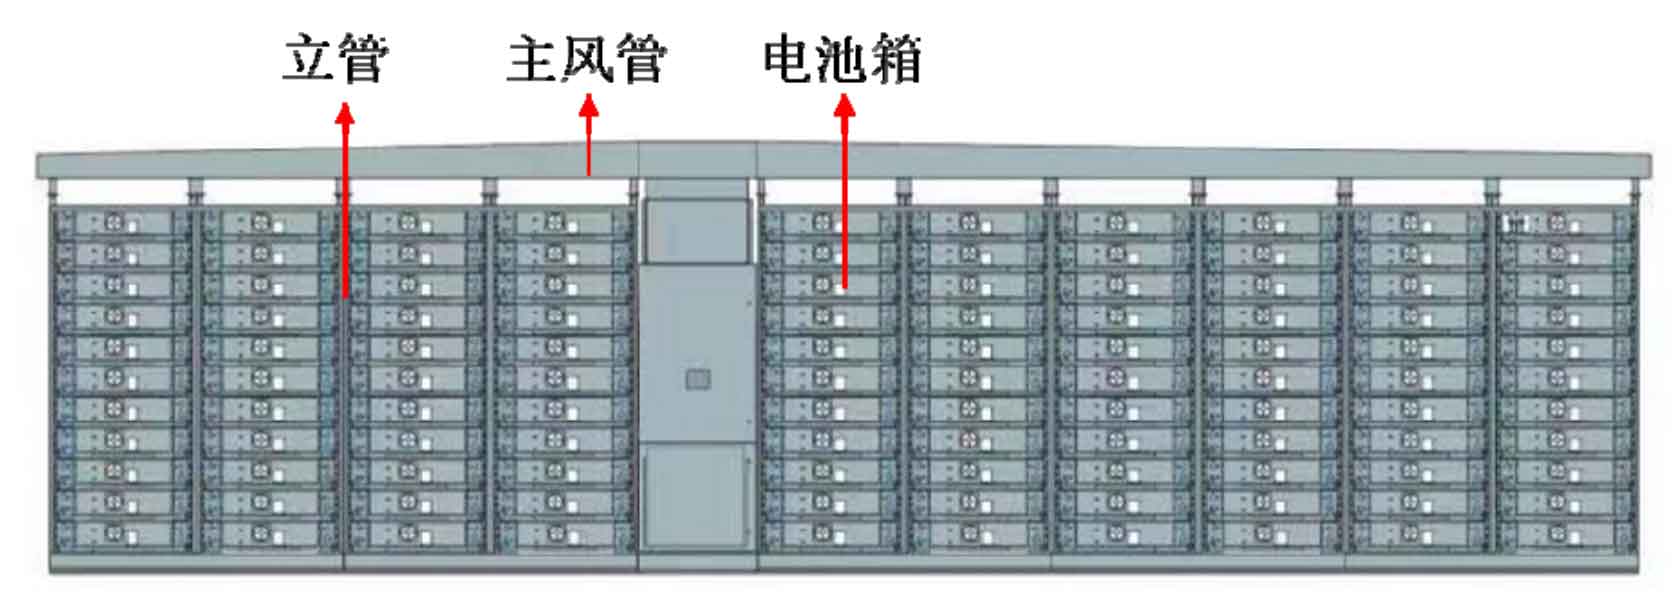
As shown in Figure 7, the cooling pipeline is designed in the form of a “main air duct+riser” and its span is distributed in an asymmetric structure. There are two opposite rows of battery cabinets inside the container, with one row containing 10 rows of battery cabinets. Therefore, the cooling air duct scheme adopted in this article is set up as two sets of cooling ducts, which respectively cool the battery cabinets arranged on both sides of the container. One cooling duct corresponds to the cooling of 10 rows of battery cabinets. There are 12 vertical pipes on the cooling pipeline, and the battery cabinet is evenly arranged between any two vertical pipes. Each vertical pipe is arranged with two opposite air supply outlets along the height direction. Therefore, a battery box will be cooled by two vertical pipe air supply outlets, ensuring the uniformity of air supply volume and air supply. Furthermore, according to the layout structure of the battery cabinet, there are 4 rows of battery boxes on the left side of the main air duct and 6 rows of battery boxes on the right side. The entire container needs to cool 220 battery boxes. The relative structure of the riser and battery box is shown in Figure 8.
3. Simulation calculation method
3.1 CFD simulation processing software
Computational Fluid Dynamics (CFD) is a highly dynamic discipline that combines modern fluid mechanics, numerical mathematics, and computer science. CFD simulation software generally consists of three parts: preprocessing, solver, and post-processing, each of which has its own role.
The preprocessor is used to complete preprocessing work. Pre processing is the process of inputting relevant data of the desired model into CFD software, which is completed through a dialog box connected to the solver. The accuracy of the solution is determined by the quantity and quality of the mesh. The preprocessing software used is ANSYS ICEM CFD (referred to as ICEM): ICEM is the mainstream grid partitioning software currently available in CFD software, with high compatibility. It not only supports the import of multiple format model files, but also can automatically capture, repair, and ignore small geometric defects. The ICEM grid division methods are mainly divided into unstructured grid, structured grid, and mixed grid. This article is based on structured grids for simulation calculations.
The core of the solver is a numerical solution algorithm. The solving process of the solver involves approximating the variable to be solved using a simple function, then incorporating the variable into the continuity equation to form a discrete equation system, and finally solving the algebraic equation system. The main difference between numerical solution algorithms lies in the way the flow variables are approximated and the corresponding discretization process. The solver used in this article is FLUENT, which is currently one of the most popular computational fluid dynamics software. It provides multiple computational models and advanced numerical calculation methods, which can solve various problems related to fluid flow, heat transfer, and chemical reactions. It is widely used in the fields of shipbuilding, aerospace, automotive, chemical, mechanical, and petroleum and natural gas, and has high applicability. The post processor is an effective observation and analysis of flow calculation results. At present, most CFD software is equipped with a post-processor, and professional post-processing software can also be selected for result analysis.
The post processor mainly has functions such as computing domain model and grid display, vector map display, contour map display, cloud map display, XY scatter map display, trajectory particle map display, and image processing. The post-processors used are CFD-Post and Tecplot.
3.2 CFD simulation mathematical model
Mathematical modeling of the heat transfer and flow model of containers follows three conservation laws during the research process: conservation of mass, conservation of momentum, and conservation of energy. At the same time, air is selected as the calculation working fluid in this article. Since the Mach number of the gas is less than 0.3 (Mach number: the ratio of velocity to local sound velocity), the gas can be regarded as an incompressible fluid, i.e. partial partial partial= ρ / 0 t. During a period of time, the mass input and output of the fluid in the element are equal, indicating the conservation of fluid mass.
Mass conservation equation:
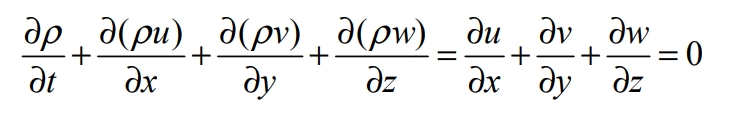
In the equation, ρ Is the density; T is the time; u. V, w, are the vector components of velocity on the x, y, and z axes.
Over a period of time, the change in momentum of the microelement in the fluid is equal to the change in momentum of the microelement under external action on the fluid, indicating the conservation of momentum.
Momentum conservation equation:
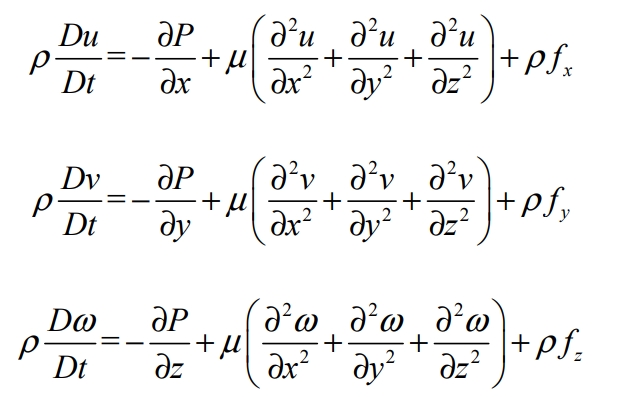
In the equation: ρ Is the density; μ Is the viscosity of air; T is the time; u. V and w are the vector components of velocity on the x, y, and z axes.
During a period of time, the sum of heat and force acting on the micro element entering the fluid is equal to the increment of the energy of the micro element. This indicates the conservation of energy.
Energy conservation equation:
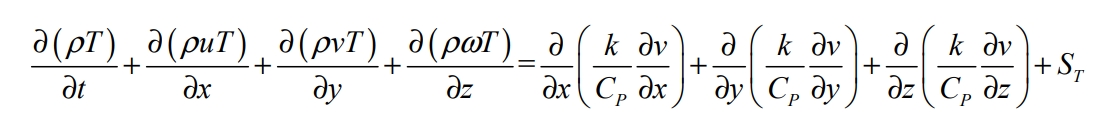
In the equation: ρ Is the density; T is the time; u. V, w are the vector components of velocity on the x, y, and z axes; CP is the specific heat capacity of the heating surface of the battery; K is the heat transfer coefficient of air; T is the ambient temperature; T S is the amount of gas mechanical energy converted into internal energy.
4. Grid independence verification
Example validation verifies the rationality of grid partitioning and numerical calculation methods to ensure the feasibility of numerical calculations, while the density of the grid determines the efficiency and accuracy of numerical calculations. The mesh is too sparse, which can easily lead to insufficient accuracy and errors in the results; When the grid is too dense, it is easy to consume a large amount of time, leading to a waste of computer resources. Therefore, it is particularly important to choose an appropriate grid level. Therefore, before numerical simulation of container energy storage systems, grid independence verification should be conducted on the battery box and cooling air duct. Based on the reference grid level verified by the numerical examples in this article, grid verification is carried out on the battery box, cooling pipeline, and overall container. The baseline number of grids for battery boxes is initially proposed to be 1.4 million, 2.1 million, 2.8 million, 3.5 million, and 4.2 million; The basic number of grids proposed for the cooling pipeline is 800000, 1.6 million, 2.4 million, 3.2 million, and 4 million grids; The benchmark quantity for the overall grid of containers is 72 million, 84 million, 96 million, 108 million, and 120 million. The following figure shows the grid structure and numerical results of the computational domain.
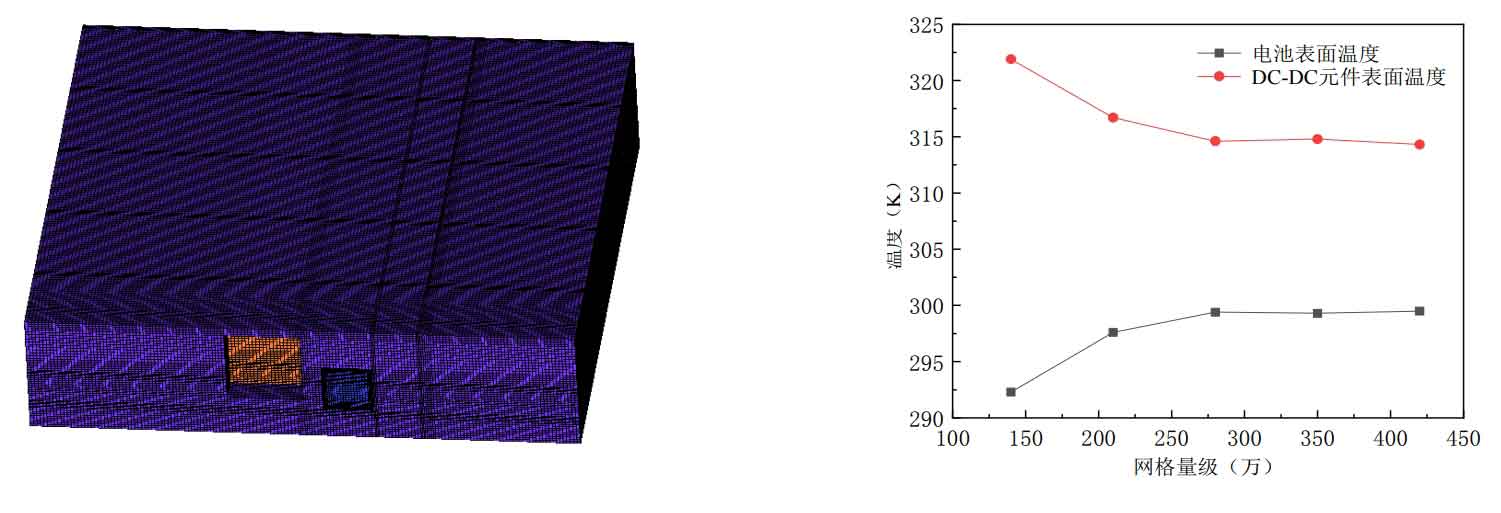
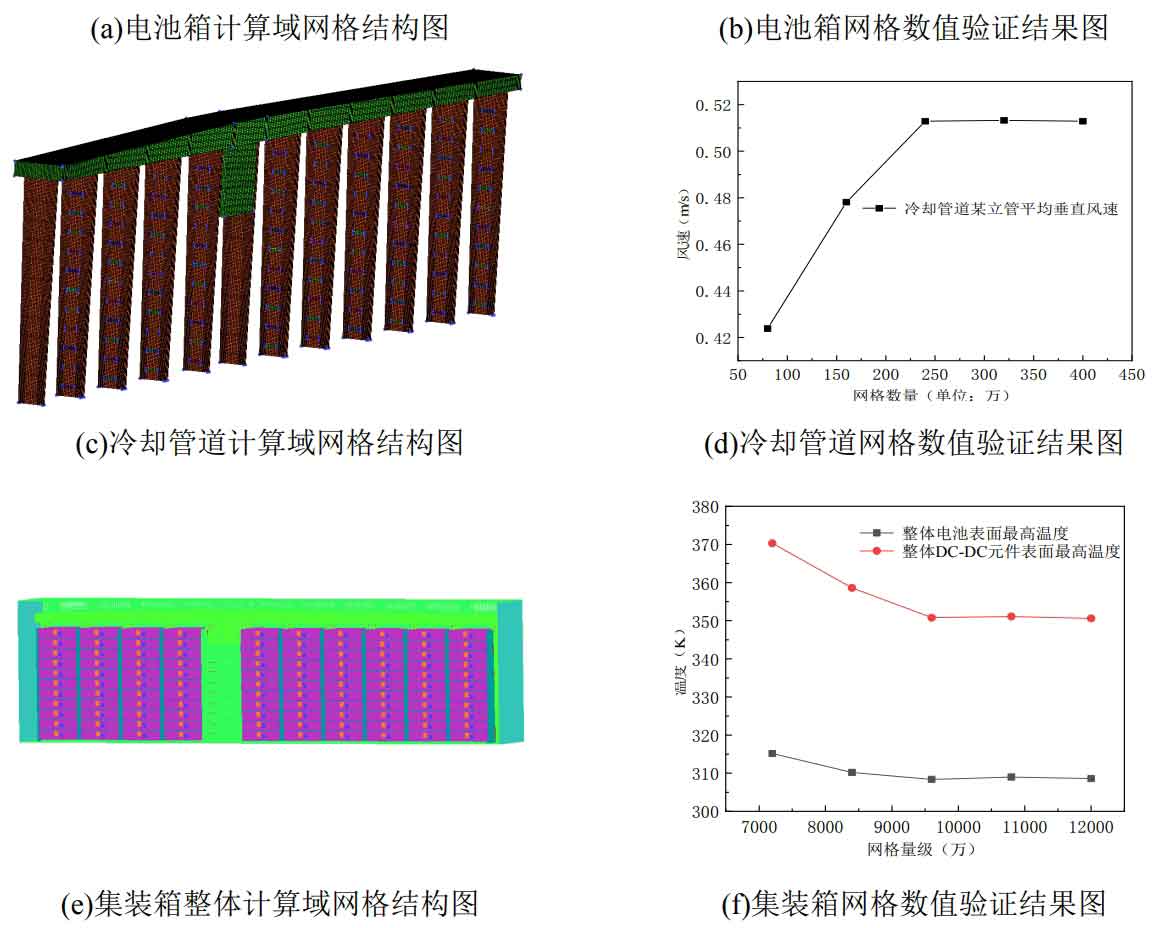
As shown in Figure 12, when the number of grids in the battery box exceeds 2.8 million, the surface temperature of the battery and DC-DC components tends to stabilize, and the results do not significantly change with the number of grids; When the number of grids in the cooling pipeline exceeds 2.4 million, the vertical average flow velocity of the cooling pipeline riser tends to stabilize with small changes; When the number of container grids exceeds 96 million, the maximum surface temperature values of batteries and DC-DC components tend to stabilize. Therefore, while ensuring grid accuracy, this article takes into account labor and computational costs. The grid size of the battery box is 2.8 million, the grid size of the cooling pipeline is 2.4 million, and the grid size of the container is 96 million.
5. Example validation
In this section, numerical examples were conducted to validate the battery box and cooling pipeline, combined with the boundary conditions in the reference literature, and compared with the results in the literature to verify the reliability of the calculation algorithm in this paper.
5.1 Verification of battery box calculation examples
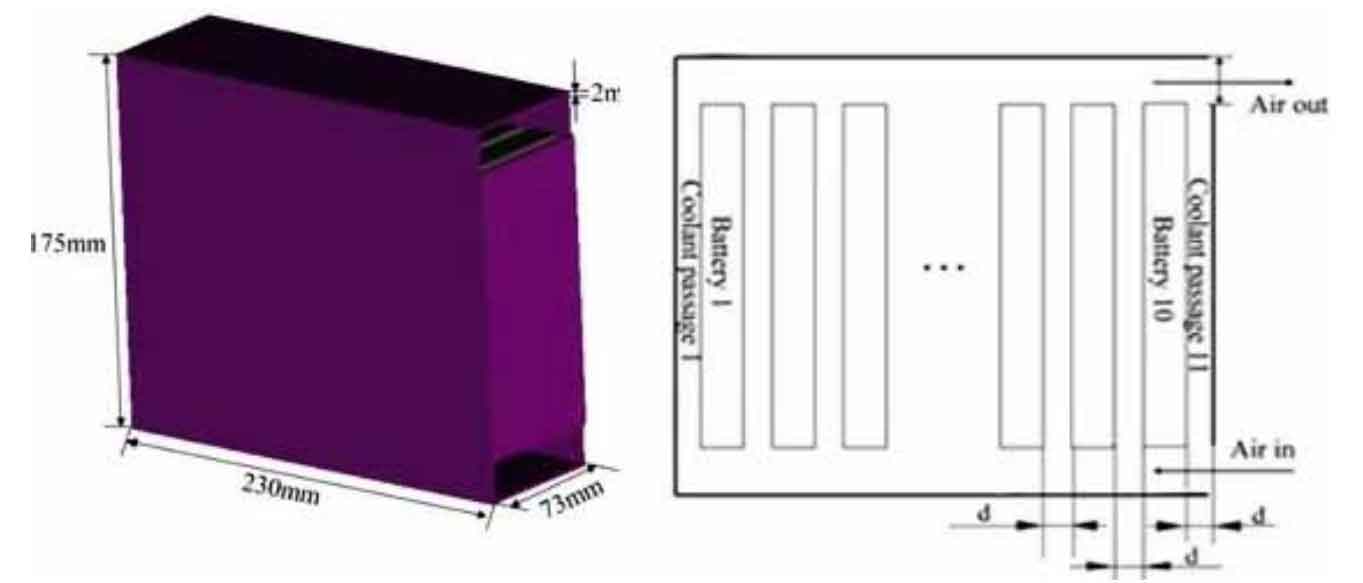
This section compares the heat dissipation experimental results of the lithium battery box in Ge’s paper with the simulation calculation results, and sets the boundary conditions for the simulation calculation based on the experimental conditions: the size of the battery box is 230 mm × 73 mm × 175 mm, with a wall thickness of 2 mm, and 10 evenly distributed internally with a size of 16 mm × 65 mm × A 131 mm battery module with an inlet speed of 3 m/s and a free outlet with an ambient temperature of 25 ℃. Two monitoring points are set on each battery, and the model is shown in Figure 9. The temperature comparison results of each point are shown in Figure 10.
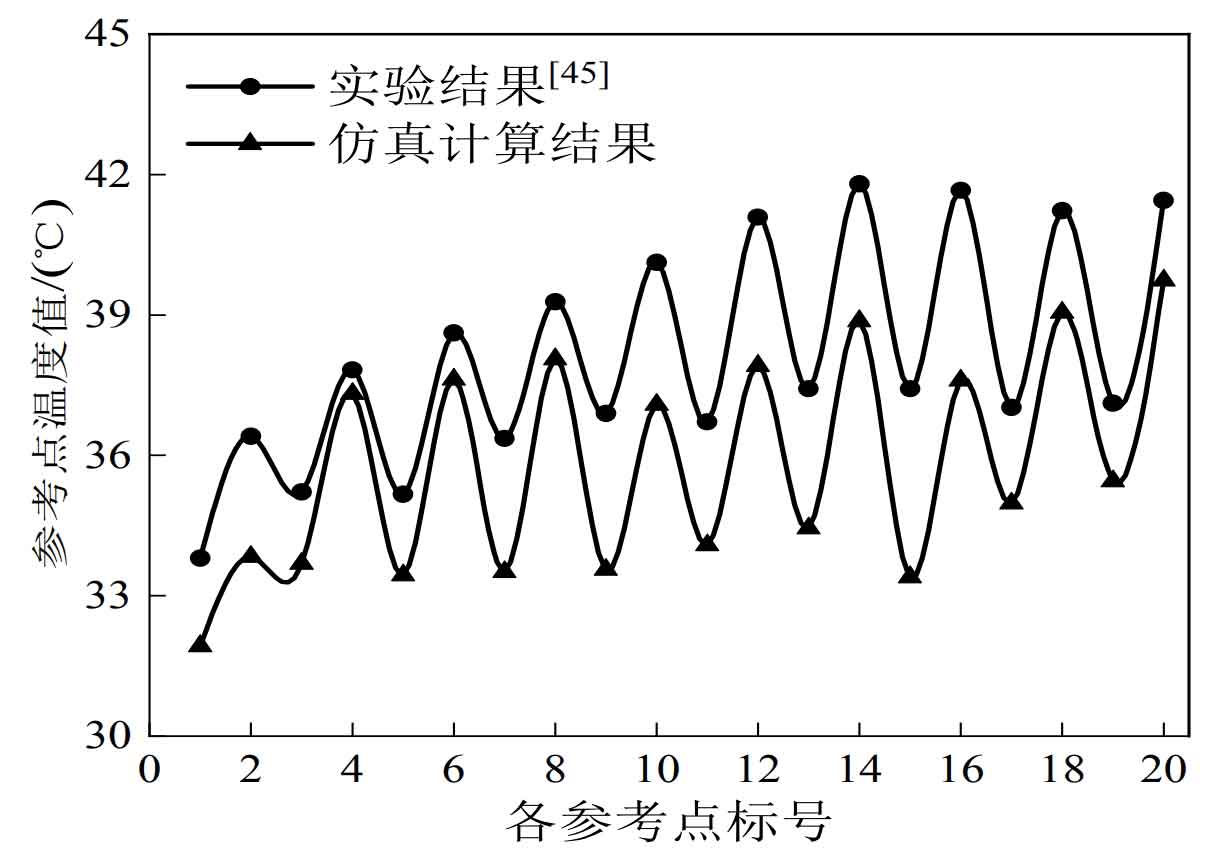
From Figure 10, it can be seen that the temperature change trend of each measurement point in the numerical simulation results is basically consistent with the experimental results. The experimental value is slightly higher than the theoretical value. The main reason is that during the actual charging and discharging process, the heat generation rate of the battery increases, and the heat generation in the simulation is constant throughout the entire charging and discharging rate process. Therefore, this method has certain reliability in numerical simulation of heat dissipation in lithium-ion battery boxes and can be used for subsequent research.
5.2 Example verification of cooling pipes
Taking Yao Zhenggang’s model in his paper as an example, the research object is the structural air duct between the transformer and the engine room in a certain offshore platform, as shown in Figure 11.
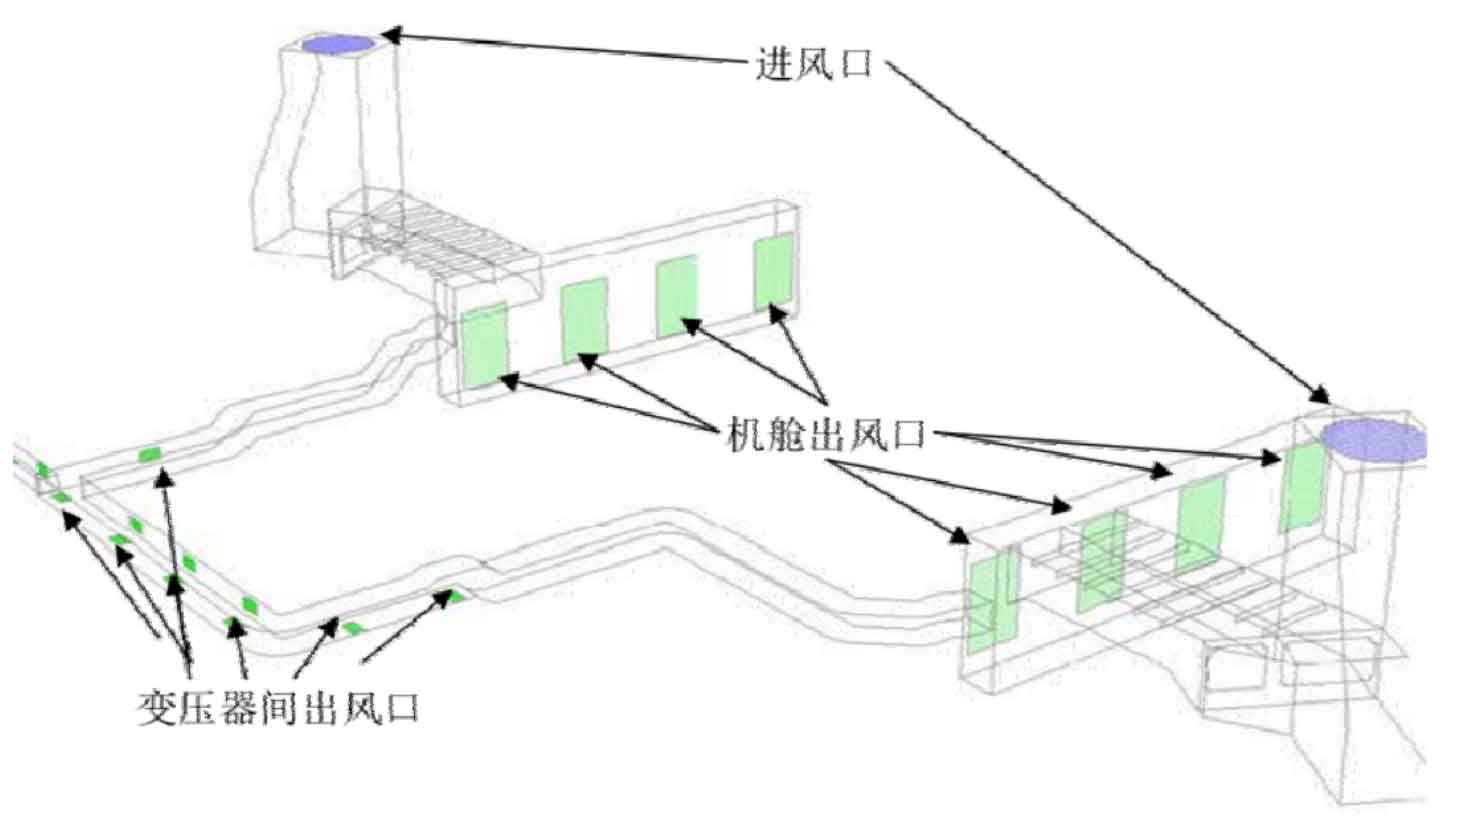
Based on the model in Figure 11, establish the model and grid in ICEM, and select k- ε The RNG turbulence model uses the SIMPLE algorithm to numerically simulate the air flow inside the structural air duct under different ventilation rates. The simulated pipeline resistance results are compared with the estimated pipeline resistance based on engineering practice. The comparison results are shown in Table 2.1. The numerical simulation resistance values are basically consistent with the actual estimated resistance values, with an error percentage of within 6%, indicating that the numerical calculation method used in this study of the air duct is relatively reliable, It can be used for calculating the flow field inside the subsequent cooling air duct.
| Working conditions | 1 | 2 | 3 | 4 | 5 | 6 |
| Ventilation volume (104 m ^ 3/h) | 15 | 16 | 17 | 18 | 19 | 20 |
| Numerical simulation resistance value (Pa) | 863.2 | 1067.8 | 1178.7 | 1260.3 | 1503.9 | 1632.6 |
| Actual estimated resistance value (Pa) | 913.5 | 1037.8 | 1170.2 | 1313.8 | 1463.4 | 1623.8 |
Summary
Based on the analysis of the structural model of the container energy storage system, a modular thermal management scheme is proposed, which involves independent heat treatment of the battery pack and cooling air duct. Secondly, the cooling pipeline is designed in the form of “main air duct+riser” to ensure personalized air supply for the battery box. In addition, grid independence verification was conducted on the numerical calculation methods involved in this article, and algorithm validation was conducted on the CFD numerical simulation methods of battery boxes and cooling pipes, providing a research foundation for subsequent thermal simulation of battery systems.
With the development and popularization of computer technology, CFD technology has undergone rapid development. Due to its advantages of low cost and easy operation in solving fluid flow problems, it is widely used in various engineering fields. This chapter first presents the overall physical model of the container, proposes a thermal management scheme based on the structural characteristics of the container energy storage system, and analyzes the working mechanism of thermal management. Secondly, elaborate on the simulation methods and mathematical models used in the calculation. On this basis, algorithm validation and grid independence testing are conducted to provide a technical foundation for the simulation and exploration of heat transfer and flow patterns in energy storage battery systems.