
From my perspective as a researcher deeply invested in spectroscopic electrochemistry, the quest to understand and improve energy storage systems is fundamentally a quest to observe and control matter at the molecular and atomic scale during operation. Among the arsenal of characterization techniques, electrochemical Raman spectroscopy stands out as a uniquely powerful, in-situ, and non-invasive fingerprinting tool. Its synergy with electrochemical control allows for real-time, dynamic interrogation of processes within complex systems like the li ion battery. This article explores the profound application of this technique in dissecting the structural and chemical evolution of advanced anode materials, moving beyond traditional graphite to the frontiers of silicon and transition metal oxides. I will delve into its principles, showcase its pivotal findings through formulas and tables, and outline the trajectory of this indispensable methodology in powering the future of li ion battery technology.
The foundation of Raman spectroscopy lies in the inelastic scattering of light, a quantum mechanical phenomenon predicted by Smekal and experimentally discovered by C.V. Raman. When monochromatic light of frequency \( \nu_0 \) interacts with a molecule, most photons are elastically scattered (Rayleigh scattering). However, a tiny fraction undergoes inelastic scattering, gaining or losing energy corresponding to the vibrational or rotational energy levels of the molecule. The energy shift, known as the Raman shift (\( \Delta \tilde{\nu} \) in cm\(^{-1}\)), provides a vibrational fingerprint of the chemical bonds and crystal lattice. The intensity of a Raman band for a fundamental transition can be described by:
$$ I \propto I_0 \cdot (\tilde{\nu}_0 \pm \Delta\tilde{\nu})^4 \cdot N \cdot \left( \frac{\partial \alpha}{\partial Q} \right)^2 $$
where \( I_0 \) is the incident laser intensity, \( N \) is the number of scatterers, and \( \frac{\partial \alpha}{\partial Q} \) is the change in polarizability with respect to the normal mode coordinate \( Q \). This dependence on polarizability change makes Raman spectroscopy complementary to infrared spectroscopy.
The marriage of Raman spectroscopy with electrochemistry, pioneered by Fleischmann, Hendra, and Van Duyne, revolutionized surface science. The discovery of surface-enhanced Raman scattering (SERS), where Raman signals are amplified by orders of magnitude on nanostructured noble metals, provided unprecedented sensitivity for studying adsorbates. However, the limitation to a few SERS-active metals (Au, Ag, Cu) hindered its universal application in battery research, where transition metal oxides and silicon are prevalent. The advent of shell-isolated nanoparticle-enhanced Raman spectroscopy (SHINERS) broke this barrier. By encapsulating a SERS-active core in an ultrathin, chemically inert shell (e.g., SiO2 or Al23), these nanoparticles can be deposited on virtually any material, providing a versatile “smart dust” for universal signal enhancement. This evolution has made electrochemical Raman spectroscopy a cornerstone for operando investigation in the li ion battery field.
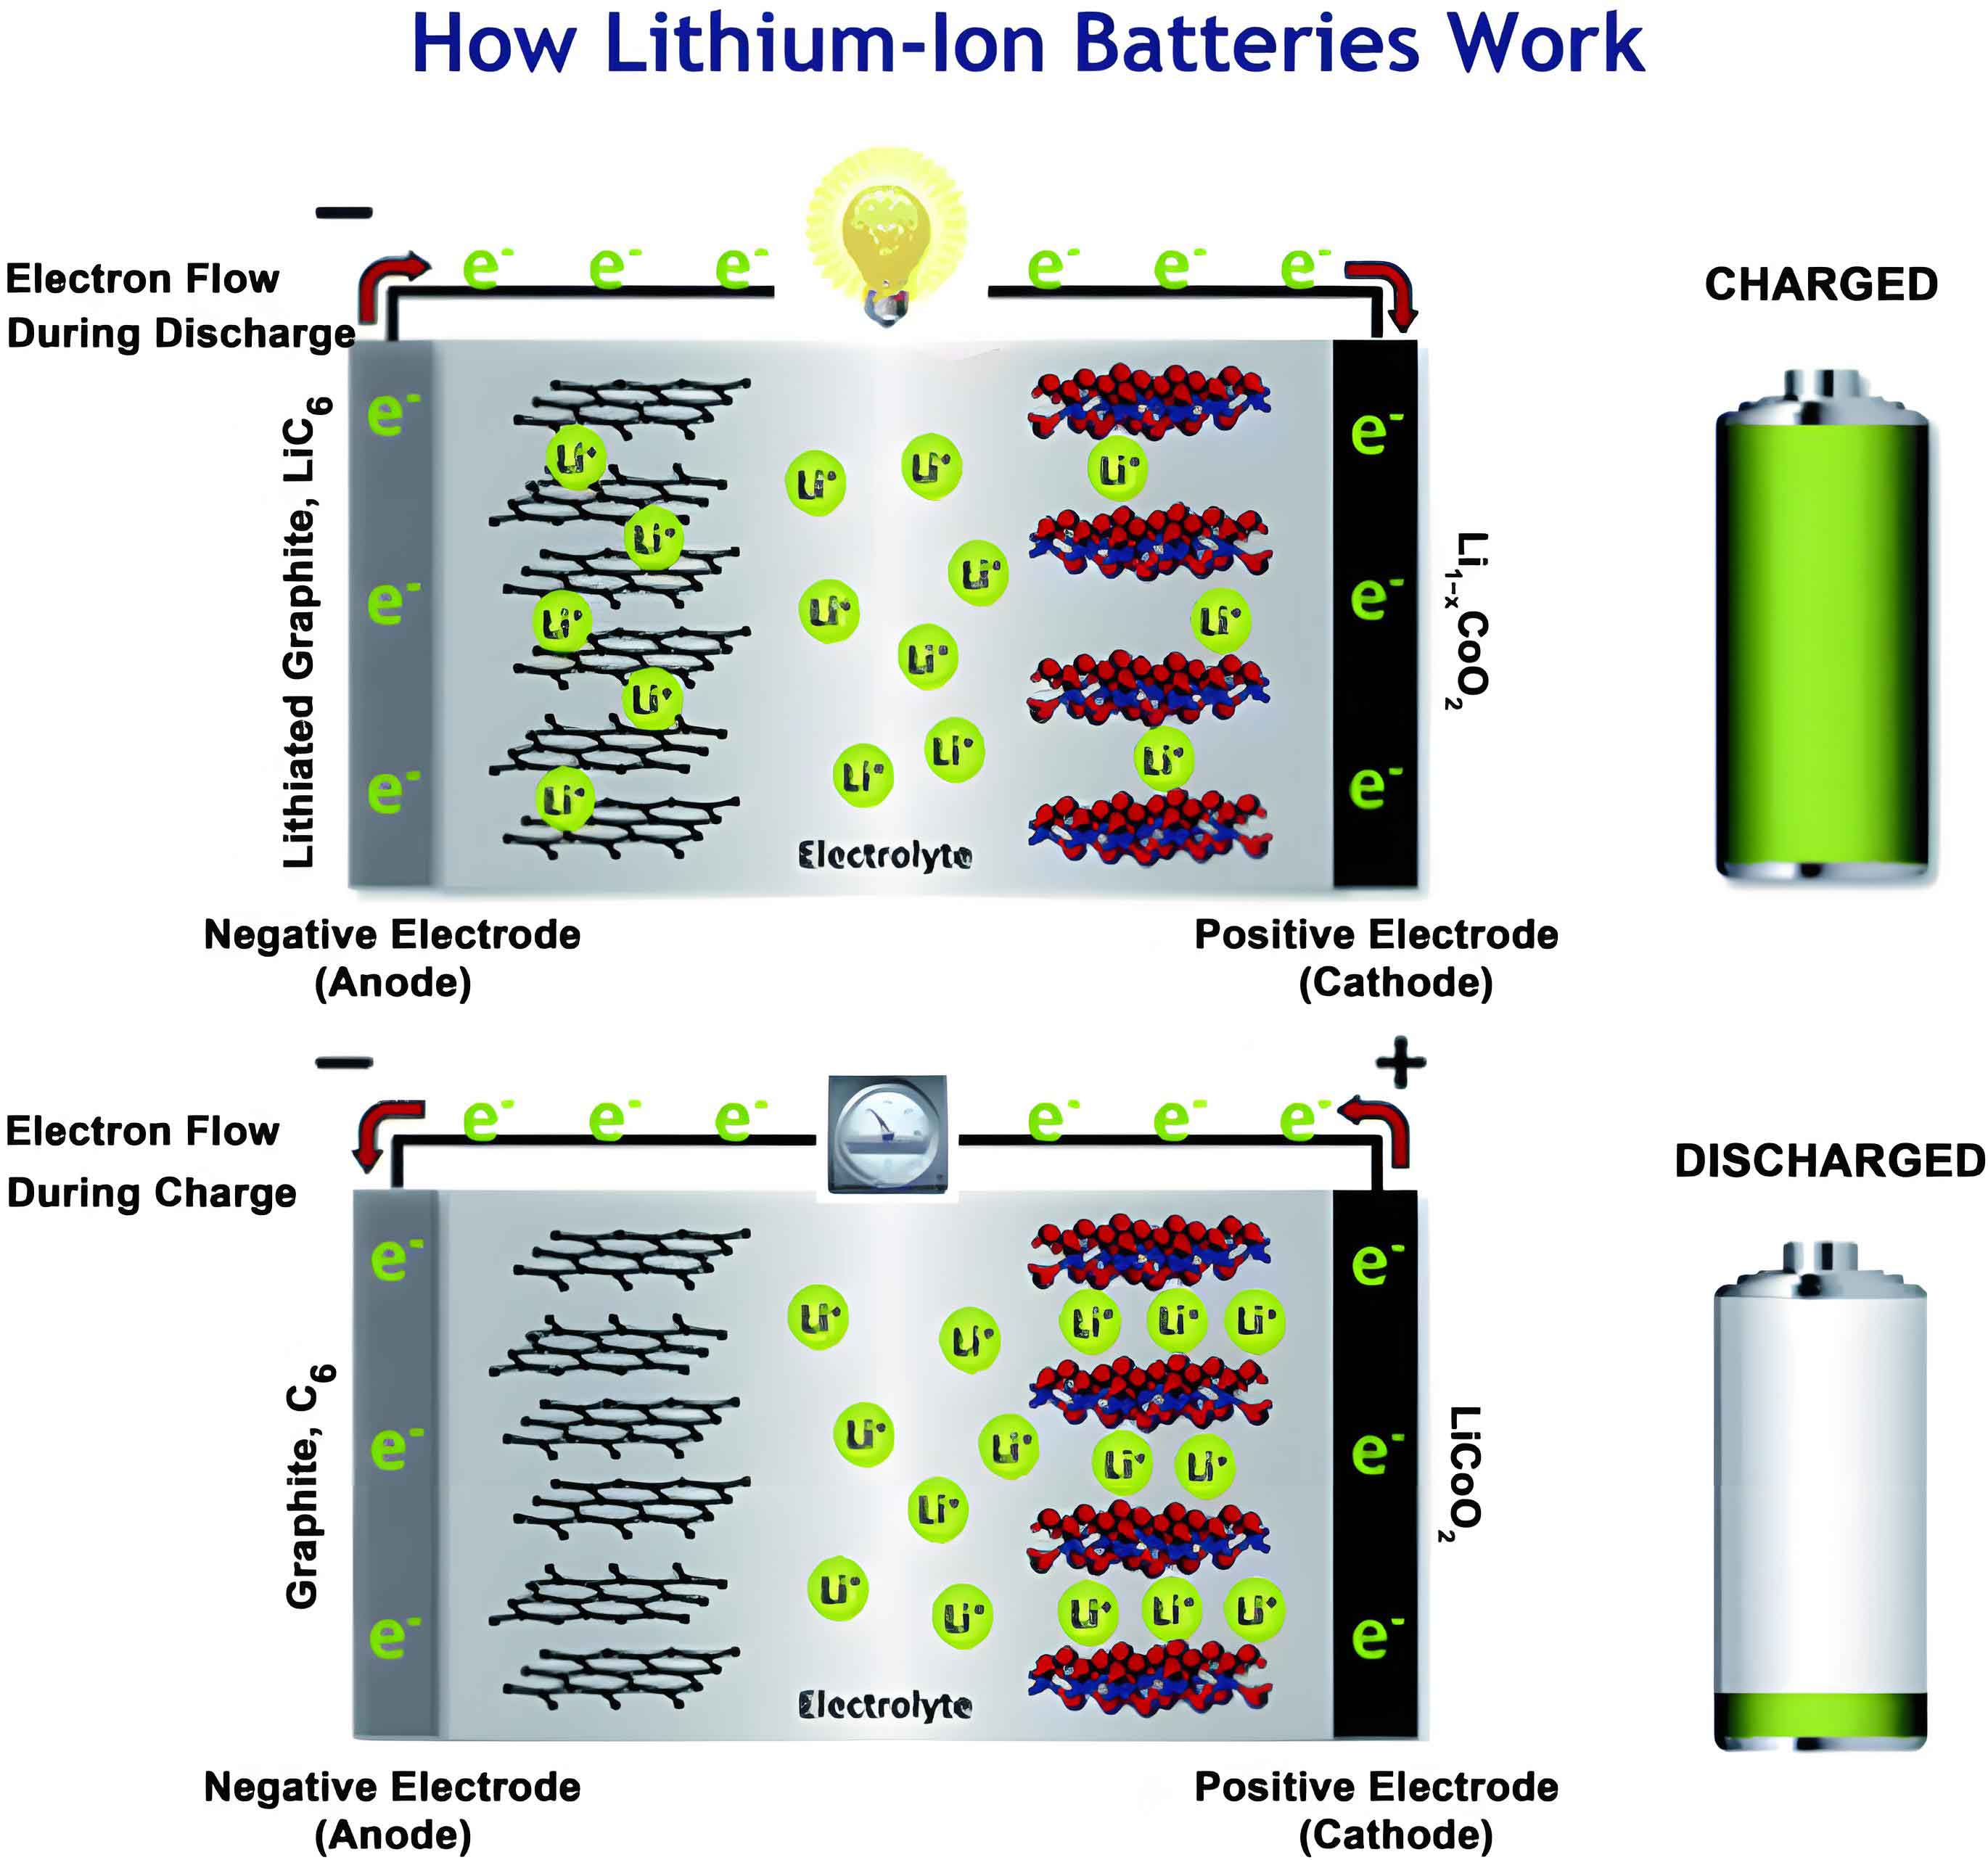
The li ion battery operates on the fundamental principle of reversible shuttling of Li+ ions between a cathode and an anode. The anode, typically graphite in commercial cells, undergoes intercalation:
$$ \text{C}_6 + x\text{Li}^+ + x\text{e}^- \rightleftharpoons \text{Li}_x\text{C}_6 $$
While successful, its theoretical capacity (372 mAh g-1) is a bottleneck for next-generation high-energy-density applications. This has spurred intense research into alternative anode materials with higher capacities, such as silicon (alloying: Si + xLi+ + xe– ⇌ LixSi, theoretical ~4200 mAh g-1) and transition metal oxides (conversion: MxOy + 2yLi+ + 2ye– ⇌ xM + yLi2O). However, these materials suffer from severe volume changes, unstable solid-electrolyte interphase (SEI), and poor conductivity. Understanding their dynamic structural evolution under realistic electrochemical conditions is paramount, and this is where electrochemical Raman spectroscopy becomes an irreplaceable diagnostic tool.
Decoding Carbonaceous Anodes: Beyond the D and G Bands
For carbon-based anodes in a li ion battery, Raman spectroscopy is exquisitely sensitive to disorder, crystallite size, and strain induced by Li+ intercalation. The spectrum is dominated by two first-order bands: the G band (~1580 cm-1) corresponding to the in-plane vibrational mode of sp2-hybridized carbon atoms (E2g symmetry in graphite), and the D band (~1350 cm-1), a breathing mode of A1g symmetry activated by defects or disorder.
| Material Type | Key Raman Features | Evolution During Lithiation | Inferred Storage Mechanism |
|---|---|---|---|
| Graphite / MCMB | Sharp G band, weak D band. 2D band (~2700 cm-1) shape indicates layer number. | G band splits into E2g2(Li) and E2g2(C) due to staging; peaks shift and broaden reversibly. | Intercalation into graphitic layers, forming staged LiCx compounds. Follows Daumas-Hérold model with reversible lattice distortion. |
| Graphene / Reduced Graphene Oxide | D/G intensity ratio (ID/IG) indicates defect density. 2D band position and FWHM. | D and G bands shift to lower wavenumbers (softening) upon lithiation, then recover. Shift may be partially irreversible in pure sheets. | Adsorption on basal planes and edges, intercalation between sheets. Metal nanoparticles (e.g., Ag) can pin sheets, improving reversibility. |
| Hard Carbon | Broad, overlapping D and G bands; high ID/IG ratio indicates high disorder. | Broad bands show subtle shifts and reversible intensity changes. New low-frequency features may appear from confined Li. | Complex mechanism: adsorption in nanopores, intercalation between disordered graphene domains (“house-of-cards” model), and potentially nanocluster formation. |
The quantitative analysis often involves the Tuinstra-Koenig relation to estimate the in-plane crystallite size \( L_a \) in nanometers:
$$ L_a(\text{nm}) \approx \frac{C(\lambda)}{(I_D/I_G)} $$
where \( C(\lambda) \) is a wavelength-dependent constant (~4.4 nm for a 532 nm laser). Operando studies on graphite show a clear staging sequence during Li intercalation, with the G band splitting and shifting, confirming the formation of distinct LiC12, LiC18, etc., phases. For hard carbon, a material critical for sodium-ion and potentially next-generation li ion battery anodes, operando Raman has been instrumental in debating its storage mechanism, revealing that both pore-filling and interlayer insertion contribute to capacity.
Probing the Stressful Life of Silicon Anodes
Silicon’s colossal volume expansion (>300%) during lithiation in a li ion battery is its greatest challenge. Raman spectroscopy is not just a chemical probe here; it is a powerful nano-mechanical stress gauge. The first-order Raman peak of crystalline silicon (c-Si) at ~520 cm-1 (for 532 nm excitation) corresponds to the triply degenerate optical phonon mode. Mechanical stress breaks this degeneracy and shifts the peak position. For a general stress state \( \sigma_{ij} \), the shift \( \Delta \omega \) is given by a linear combination:
$$ \Delta \omega = \Pi_{ij} \sigma_{ij} $$
where \( \Pi_{ij} \) are the piezo-spectroscopic coefficients. For practical cases in battery electrodes, simplifications are often applied. For example, under biaxial stress in thin films or particles, the relationship can be simplified to:
$$ \Delta \omega = \lambda \cdot \epsilon $$
where \( \lambda \) is a calibrated stress coefficient (approximately -4.4 cm-1/GPa for hydrostatic pressure) and \( \epsilon \) is the strain.
| Material/Geometry | Operando Raman Observation | Stress State Analysis | Mechanical Implication for the Li-Ion Battery |
|---|---|---|---|
| Si Nanoparticles | Peak shifts from initial tensile stress (~0.2 GPa) to compressive stress (~0.3 GPa) in the core during early lithiation. | Surface oxide removal causes initial tension. Formation of amorphous LixSi shell compresses the crystalline core. | Core-shell stress gradient drives fracture and pulverization upon cycling, degrading performance. |
| Crystalline Si (c-Si) Wafer / Particle | Formation of distinct spectral phases: a-LixSi (broad feature ~480 cm-1), crystalline Li15Si4 (sharp peaks), and strained c-Si. | Maximum tensile stress found at the interface between c-LixSi and c-Si layers, leading to plastic deformation. | Anisotropic lithiation and high interfacial stress cause crack initiation and propagation, leading to capacity fade. |
| Si Nanowires / Engineered Structures | Peak shift magnitude and direction vary with crystallographic orientation (e.g., <110>, <111>). | Different crystallographic planes exhibit anisotropic expansion, inducing complex, orientation-dependent stress fields. | Engineering Si morphology and crystallography can mitigate stress concentrations and improve cyclability in the li ion battery. |
Operando micro-Raman mapping can spatially resolve these stress distributions, revealing how cracks nucleate and propagate. This information is invaluable for validating multiphysics models and designing stress-tolerant architectures, such as yolk-shell structures or porous networks, which are essential for creating a durable silicon-based li ion battery.
Illuminating Conversion and Alloying in Transition Metal Oxides
Beyond carbon and silicon, a plethora of transition metal oxides (TMOs) and multi-metal oxides are explored for the li ion battery anode. Their mechanisms involve conversion reactions or combined intercalation-conversion processes. Raman spectroscopy effectively tracks the breakage of metal-oxygen bonds, phase transformations, and the formation of metallic species and Li2O.
For a generic conversion reaction:
$$ \text{M}_x\text{O}_y + 2y\text{Li}^+ + 2y\text{e}^- \rightleftharpoons x\text{M} + y\text{Li}_2\text{O} $$
The Raman spectrum of the crystalline MxOy phase (with characteristic M-O stretching and bending modes) diminishes or disappears upon discharge (lithiation), often replaced by a broad, featureless background indicative of nanometric metallic clusters M and amorphous Li2O. Upon charging, the reformation of metal-oxygen bonds can be observed, though often yielding a different oxide phase (e.g., CoO instead of Co3O4) or a more disordered structure.
| Material | Initial Raman Peaks (cm-1) | Evolution During Discharge (Lithiation) | Reversibility Upon Charge | Key Insight for Li-Ion Battery Performance |
|---|---|---|---|---|
| Co3O4 | ~195 (F2g), ~480 (Eg), ~520 (F2g), ~690 (A1g) | Peak intensities drop sharply; new broad features appear. Peaks vanish at full discharge. | Peaks reappear but often with altered relative intensities, indicating structural rearrangement. | Irreversible phase changes and particle agglomeration contribute to capacity fade. Carbon coating improves reversibility. |
| ZnCo2O4 (Spinel) | ~195, ~480, ~520, ~690 (similar to Co3O4>) | Peaks disappear as oxide reduces to Zn + Co nanoclusters + Li2O. Formation of Li-Zn alloy possible. | Re-oxidation to ZnO and Co3O4, not ZnCo2O4. Raman tracks this phase separation. | Demonstrates the complex, often non-reconstructive nature of conversion reactions in a li ion battery. |
| Disordered Li3+xV2O5 | Broad bands for V-O modes (~930 cm-1 for V=O). | Band intensity decreases, new peak at ~932 cm-1 emerges (V4+=O). | Highly reversible changes in all V-O bands. | High reversibility correlates with excellent rate performance, as disorder facilitates fast Li+ diffusion. |
| Na2Ti2O5@RGO (for SIBs, analogous to LIBs) | 278, 448, 716 cm-1 (Ti-O and Na-O-Ti vibrations). | Peaks weaken or disappear upon Na+ insertion (sodiation). | Peaks fully recover to initial state. | High structural reversibility underpins excellent cycling stability, a principle transferable to titanate anodes for li ion battery. |
These observations are crucial. They reveal that the often-poor cyclability of TMO anodes is linked to irreversible structural changes and progressive disorder introduced during the conversion reaction. Raman spectroscopy guides the design of nanocomposites, carbon coatings, and tailored morphologies that constrain these detrimental changes and enhance the life of the li ion battery.
Future Trajectories and Concluding Perspective
While electrochemical Raman spectroscopy has dramatically advanced our understanding of li ion battery anodes, its evolution is far from complete. The future lies in pushing its spatial, temporal, and chemical sensitivity frontiers while solving practical integration challenges.
First, the perennial issue of fluorescence from organic electrolytes can swamp weak Raman signals. Advanced techniques like shifted-excitation Raman difference spectroscopy (SERDS) or the use of quasi-elastic neutron scattering (QENS) for complementary analysis are promising paths. Second, conventional operando cells requiring optical windows and modified electrodes (e.g., drilled separators) introduce artefacts. The development of truly non-invasive, fiber-optic Raman probes embedded within commercial-format pouch or cylindrical cells is a critical step toward real-world, in-operando diagnostics for li ion battery management systems.
Third, the most chemically rich yet elusive region in a working li ion battery is the electrode-electrolyte interface, specifically the Solid Electrolyte Interphase (SEI). Its composition, dynamics, and heterogeneity dictate coulombic efficiency, lifetime, and safety. Conventional Raman often lacks the sensitivity for this nanometer-thin layer. Here, the power of (SHINERS) becomes transformative. By sprinkling SHINERS nanoparticles on the anode surface, one can obtain enhanced Raman signals from the molecular constituents of the SEI (e.g., Li2CO3, ROCO2Li, polymers) during formation and cycling, providing the much-needed molecular-level insight into this “holy grail” of battery interfaces.
Finally, correlative operando microscopy is the future. Integrating Raman with techniques like atomic force microscopy (Raman-AFM) to correlate chemical change with mechanical property evolution, or with X-ray diffraction (XRD) to link local molecular structure with long-range crystal order, will provide a holistic, multi-modal picture of degradation. The integration of machine learning for rapid analysis of large hyperspectral Raman datasets will accelerate the discovery of structure-property relationships.
In conclusion, from my viewpoint, electrochemical Raman spectroscopy has grown from a specialized surface science tool into a central pillar of operando battery analytics. Its unique ability to provide fingerprint chemical and mechanical insights in real-time and under operating conditions makes it indispensable for unraveling the complex behaviors of next-generation anode materials. As we strive to develop the high-energy, long-life, and safe li ion battery of the future, this technique will continue to illuminate the path forward, one vibrational spectrum at a time.