
With the rapid deployment of renewable energy systems, lithium iron phosphate (LiFePO₄) batteries have become a cornerstone for large-scale energy storage due to their stability and cost-effectiveness. However, thermal runaway (TR) remains a critical safety concern, often leading to fires or explosions. This study evaluates the effectiveness of multi-parameter sensors in detecting TR and proposes optimized monitoring strategies for LiFePO₄ battery storage compartments.
Sensor Performance and Thermal Runaway Dynamics
Five composite sensors (A–E) integrating hydrogen (H₂), carbon monoxide (CO), carbon dioxide (CO₂), volatile organic compounds (VOC), smoke, temperature, and pressure detection modules were tested in a 40-foot energy storage compartment. Key findings include:
| Sensor Type | Detection Principle | Response Time (s) | Peak Accuracy |
|---|---|---|---|
| H₂ (Catalytic Combustion) | Oxidation-driven thermal change | 1462 | ±5% FS |
| VOC (Photoionization) | UV-induced ionization | 750 | ±2% FS |
| CO (Electrochemical) | Redox current measurement | 1665 | ±3% FS |
VOC sensors demonstrated the earliest TR detection capability (600 s pre-TR) due to electrolyte vaporization and decomposition of battery surface materials. The photoionization VOC sensor outperformed electrochemical variants with 85% faster response. Catalytic combustion H₂ sensors detected gas 100 s earlier than electrochemical equivalents, validating their suitability for early warning systems.
Thermal Runaway Propagation Analysis
The diffusion dynamics of TR byproducts were modeled using Fick’s law:
$$ \frac{\partial Y_i}{\partial t} = D_{ij} \nabla^2 Y_i + S_i $$
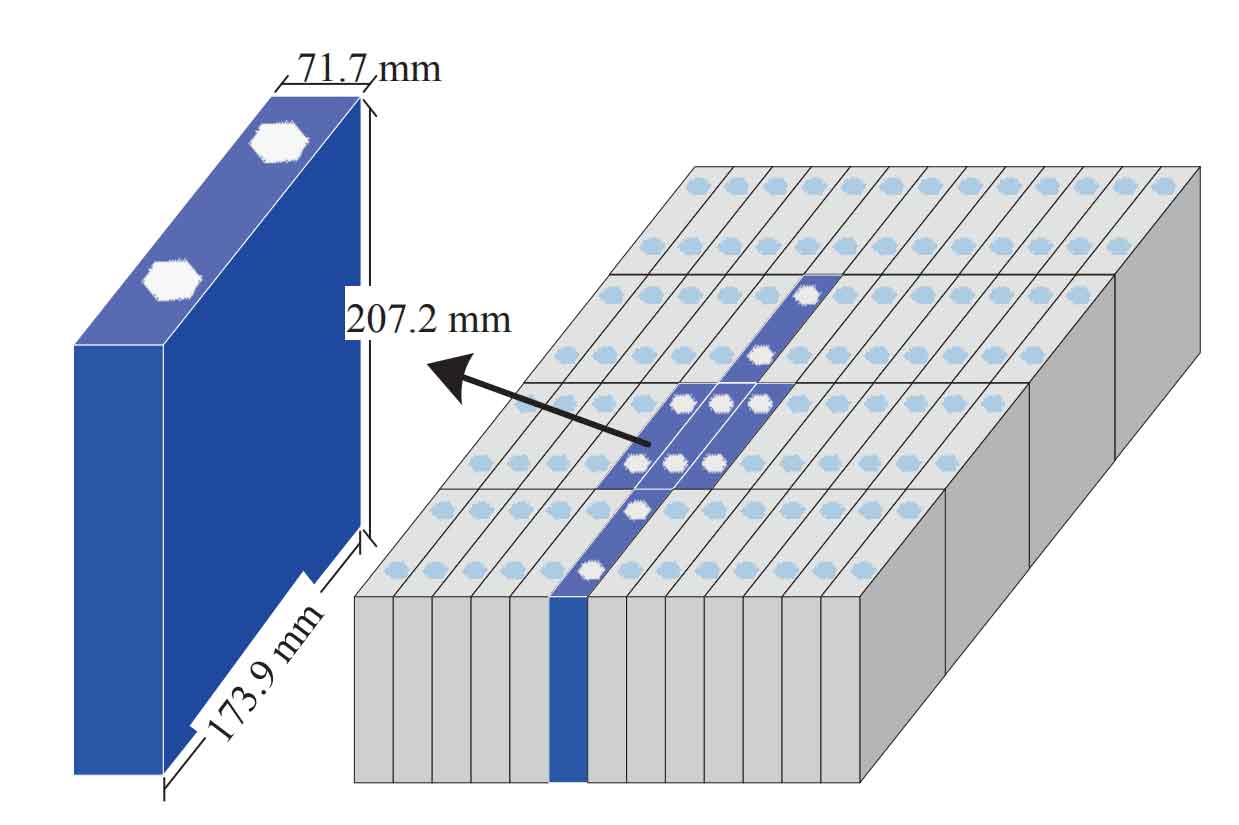
Where \( Y_i \) represents mass fraction of species \( i \), \( D_{ij} \) the binary diffusion coefficient, and \( S_i \) the source term from TR reactions. Edge-initiated TR exhibited 23% faster gas propagation (\( v_{edge} = 28.26 \, \text{mm/s} \)) compared to central ignition (\( v_{center} = 23.48 \, \text{mm/s} \)) due to wall confinement effects.
Impact of Ignition on Detection Parameters
Post-TR ignition significantly altered gas concentrations:
| Parameter | Non-Ignition Peak | Ignition Peak | Change Factor |
|---|---|---|---|
| CO | 684 ppm | >1000 ppm | 1.46× |
| VOC | 10,000 ppm | 5,778 ppm | 0.58× |
| Temperature Rise | 0.10°C/min | 0.78°C/min | 7.8× |
Ignition enhanced combustion products (CO/CO₂) while reducing VOC through oxidative consumption. Ceiling temperature sensors became effective fire indicators post-ignition (\( \Delta T > 0.5°C/s \)), whereas pressure sensors showed negligible response in non-ignition scenarios.
Optimal Sensor Deployment Strategy
Propagation velocity calculations determined ideal detector spacing:
$$ v = \frac{2400}{t_{n+1} – t_n} $$
For VOC-dominated early detection:
- Edge zones: 0.64–1.28 m spacing
- Central zones: 0.92–1.85 m spacing
A multi-stage alert protocol is proposed:
- Stage 1 (VOC > 50 ppm): Pre-TR warning
- Stage 2 (H₂ > 500 ppm + CO > 100 ppm): TR confirmation
- Stage 3 (Smoke > 1,000 mg/m³ + ΔT > 1°C/s): Fire mitigation activation
Conclusion
This work establishes catalytic combustion H₂ and photoionization VOC sensors as optimal for lithium iron phosphate battery TR monitoring. The hierarchical detection strategy enables 600 s early warning capability, critical for preventing cascading failures in energy storage systems. Future studies will explore sensor fusion algorithms and aging effects in practical deployments.
$$ \text{TR Risk Index} = \sum_{i=1}^n w_i \cdot \frac{C_i}{C_{i,threshold}} $$
Where \( w_i \) represents weighting factors for H₂, VOC, and thermal parameters, providing a unified safety metric for grid-scale LiFePO₄ installations.