1. Introduction
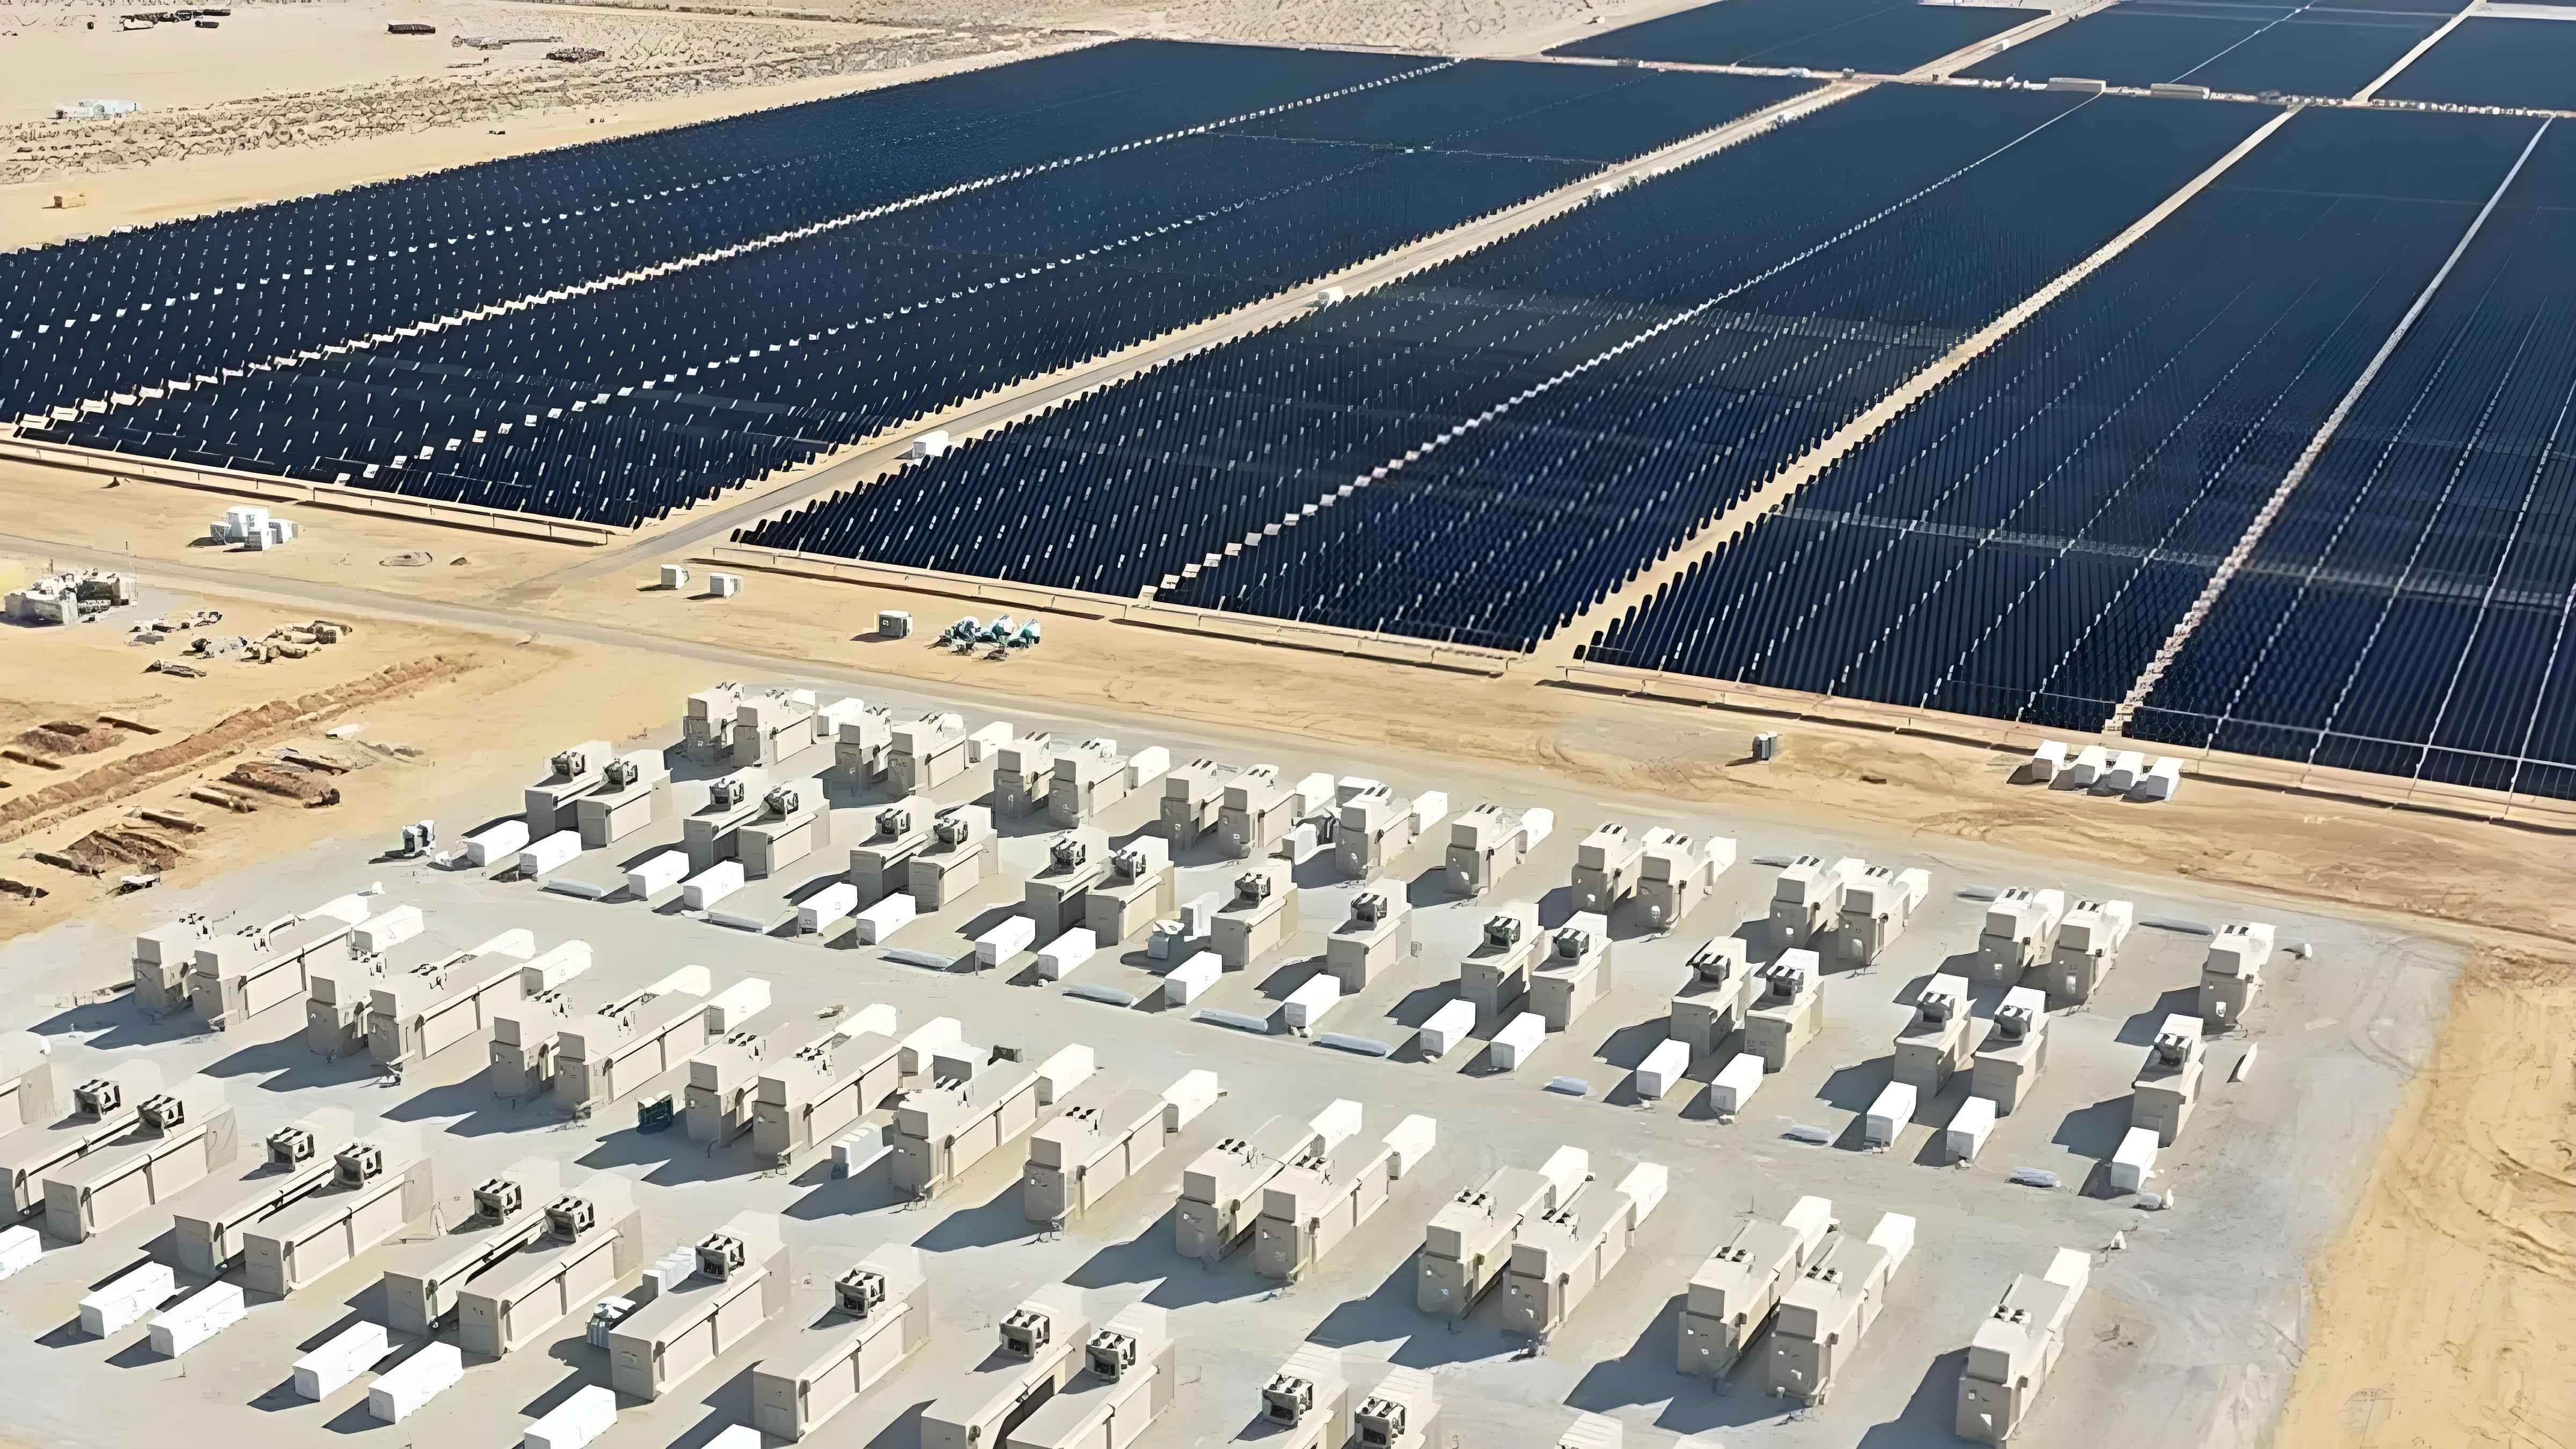
With the global shift toward green and low-carbon economies, solar energy storage has emerged as a cornerstone of sustainable development. As a leading energy technology enterprise in China, HT Company has strategically transitioned to distributed photovoltaic (PV) projects to align with national policies and enhance competitiveness. This study evaluates the economic benefits of HT Company’s PV projects, focusing on cost structures, revenue mechanisms, and externalities such as environmental protection and corporate image enhancement. By integrating solar energy storage solutions, HT aims to balance internal profitability with ecological sustainability.

2. Direct Economic Benefits of PV Projects
2.1 Cost Factors
The total cost of distributed PV projects comprises three components: initial investment, operation and maintenance (O&M) costs, and financial expenses.
Table 1: Cost Structure of Distributed PV Projects
| Cost Category | Components | Weight (%) |
|---|---|---|
| Initial Investment | PV modules (46%), balance-of-system (30%), soft costs (24%) | 100% |
| O&M Costs | Labor, equipment replacement, depreciation | 1–3% of initial investment |
| Financial Costs | Bank loans (5%), equity financing (6–8%), bond issuance (4.8–7%) | Variable |
Key Formula: Initial Investment CostCinitial=Cmodules+Cbalance+CsoftCinitial=Cmodules+Cbalance+Csoft
where Cmodules=46%×CinitialCmodules=46%×Cinitial, Cbalance=30%×CinitialCbalance=30%×Cinitial, and Csoft=24%×CinitialCsoft=24%×Cinitial.
2.2 Revenue Factors
Revenue streams include electricity savings, feed-in tariffs, and government subsidies. The annual revenue (RtRt) is calculated as:Rt=S1⋅Qt+α⋅P1⋅Qt+(1−α)⋅P2⋅QtRt=S1⋅Qt+α⋅P1⋅Qt+(1−α)⋅P2⋅Qt
where:
- S1S1: Subsidy rate (¥0.32/kWh in Beijing)
- QtQt: Annual electricity generation (kWh)
- αα: Self-consumption ratio (50% assumed)
- P1P1: Industrial electricity price (¥0.8861/kWh)
- P2P2: Grid purchase price (¥0.3844/kWh)
Table 2: Revenue Calculation for a 20-Year Project
| Year | Generation (MWh) | Self-Consumption (MWh) | Revenue (¥10k) |
|---|---|---|---|
| 1 | 1,713 | 1,370 | 167.87 |
| 5 | 1,675 | 1,340 | 162.64 |
| 10 | 1,627 | 1,302 | 133.56 |
| 20 | 1,534 | 1,227 | 123.34 |
3. External Benefits of Solar Energy Storage
3.1 Environmental Impact
PV projects reduce reliance on coal-fired power, lowering emissions of CO₂, SO₂, and NOₓ. For HT’s Beijing project:
- Annual CO₂ reduction: 13,994.4 tons
- Lifetime SO₂ reduction: 1,153.96 tons
Table 3: Environmental Benefits (Annual Basis)
| Metric | Reduction (tons) | Economic Value (¥10k) |
|---|---|---|
| Standard Coal Saved | 4,036.86 | — |
| CO₂ Emissions Avoided | 13,994.4 | 80.21 |
| SO₂ Emissions Avoided | 179.46 | 681.10 |
3.2 Corporate Image and Employment
- Job Creation: Shift from traditional energy roles to specialized PV technicians.
- Public Awareness: Enhanced community engagement in renewable energy adoption.
4. Economic Evaluation System
4.1 Indicator System Design
A hierarchical evaluation framework was developed using the Analytic Hierarchy Process (AHP) and fuzzy comprehensive evaluation.
Table 4: Economic Evaluation Indicators
| Tier-1 Indicator | Tier-2 Indicators | Weight (%) |
|---|---|---|
| Profitability | NPV, IRR, Payback Period, ROE, ROA | 56.82 |
| Debt Repayment | Debt-to-Asset Ratio, Current Ratio, ICR | 22.63 |
| Operational Efficiency | Total Asset Turnover, Current Asset Turnover | 15.62 |
| Financing Capacity | Financing Methods, Interest Rates | 4.93 |
Formula: AHP Weight Calculationωi=∏j=1naijn∑i=1n∏j=1naijnωi=∑i=1nn∏j=1naijn∏j=1naij
where aijaij represents the relative importance of factor ii over jj.
4.2 Fuzzy Comprehensive Evaluation
The fuzzy evaluation matrix (RR) and weight vector (WW) were combined to assess project performance.
Formula: Fuzzy Evaluation ScoreS=W∘R=(∑i=1nwi⋅ri1,∑i=1nwi⋅ri2,… )S=W∘R=(i=1∑nwi⋅ri1,i=1∑nwi⋅ri2,…)
Table 5: Evaluation Results for HT’s Project
| Scenario | Profitability | Debt Repayment | Operational Efficiency | Overall Score | Rating |
|---|---|---|---|---|---|
| With Subsidy (¥6.5/W) | 91.67 | 79.78 | 82.50 | 90.79 | Excellent |
| No Subsidy (¥4.5/W) | 82.68 | 78.33 | 81.88 | 82.25 | Good |
5. Case Study: HT’s Beijing Project
5.1 Project Overview
- Location: Beijing’s Daxing District
- Capacity: 1.7 MW rooftop PV system
- Irradiation: 2,287 annual sunshine hours
5.2 Key Financial Metrics
- NPV: ¥1,148.89k (with subsidy) vs. ¥110.45k (no subsidy)
- IRR: 10.65% (with subsidy) vs. 8.36% (no subsidy)
- Payback Period: 7.57 years (with subsidy) vs. 9.46 years (no subsidy)
Formula: Net Present ValueNPV=∑t=0n(CI−CO)t(1+i)tNPV=t=0∑n(1+i)t(CI−CO)t
where CICI=cash inflow, COCO=cash outflow, ii=discount rate (8%).
6. Strategic Recommendations
To enhance the viability of solar energy storage projects:
- Technological Innovation: Increase R&D investment to reduce module costs and improve efficiency.
- Financing Models: Promote green bonds and asset-backed securities (ABS) to diversify funding sources.
- Policy Advocacy: Lobby for dynamic subsidy mechanisms and tax incentives.
7. Conclusion
HT Company’s PV projects demonstrate significant economic and environmental benefits, particularly when integrated with solar energy storage systems. While subsidies remain critical for short-term profitability, long-term success hinges on technological advancements and innovative financing. This study provides a replicable framework for evaluating distributed PV projects, contributing to global efforts in sustainable energy transition.
