
In recent years, the rapid advancement of energy storage technology has been pivotal in supporting global transitions toward renewable energy and grid stability. Among various energy storage solutions, lithium-ion batteries, particularly LiFePO4 batteries, have gained widespread adoption due to their high energy density, long cycle life, and enhanced safety profiles compared to other chemistries. However, thermal safety remains a critical concern that limits the large-scale deployment of these systems. LiFePO4 battery modules with liquid cooling systems offer superior thermal management by maintaining uniform temperature distributions, yet they are not immune to thermal runaway events caused by abusive conditions such as overcharging. Early detection and warning of thermal runaway are essential to prevent catastrophic failures, ensuring the reliability and safety of energy storage installations. In this study, I explore an innovative early warning method based on detecting sudden changes in air-pressure signals within sealed liquid-cooled LiFePO4 battery modules. By leveraging embedded barometric pressure sensors, I aim to capture the moment when a battery’s safety valve opens—a precursor to thermal runaway—and provide timely alerts. This approach capitalizes on the fact that the release of gases during battery degradation induces rapid pressure fluctuations in the confined module space. Through a combination of experimental overcharge tests and computational fluid dynamics (CFD) simulations, I validate the effectiveness of this method, analyze the characteristics of pressure signal propagation, and offer practical guidelines for sensor selection and placement. The findings contribute to enhancing the safety protocols for LiFePO4 battery-based energy storage systems, potentially mitigating risks associated with thermal runaway.
The core principle behind this early warning technique hinges on the physical changes that occur within a LiFePO4 battery during abusive operations. Under normal conditions, a LiFePO4 battery operates within a safe voltage and temperature range. However, during overcharge, side reactions such as electrolyte decomposition, lithium plating, and electrode breakdown generate heat and gases like hydrogen (H₂), ethylene (C₂H₄), carbon monoxide (CO), and carbon dioxide (CO₂). These gases accumulate inside the battery, increasing internal pressure until the safety valve opens to prevent explosion. This valve opening event releases a burst of gas into the module’s sealed environment, causing a sudden spike in air pressure. By monitoring this pressure change, I can detect the onset of thermal runaway long before temperatures reach critical levels. The ideal gas law provides a foundational model for understanding this phenomenon:
$$ PV = nRT $$
where \( P \) is the pressure, \( V \) is the volume of the module, \( n \) is the number of moles of gas, \( R \) is the universal gas constant, and \( T \) is the temperature. When gas is released from the LiFePO4 battery, \( n \) increases abruptly, leading to a rapid rise in \( P \) if \( V \) and \( T \) are relatively constant initially. This pressure change can be detected with high-sensitivity sensors, offering a reliable warning signal. Additionally, the kinetics of gas generation can be described using Arrhenius-type equations, which relate reaction rates to temperature:
$$ k = A e^{-\frac{E_a}{RT}} $$
where \( k \) is the rate constant, \( A \) is the pre-exponential factor, \( E_a \) is the activation energy, and \( T \) is the absolute temperature. As temperature rises during overcharge, \( k \) increases exponentially, accelerating gas production and pressure buildup. By integrating such models, I can better interpret the pressure signals and optimize detection algorithms.
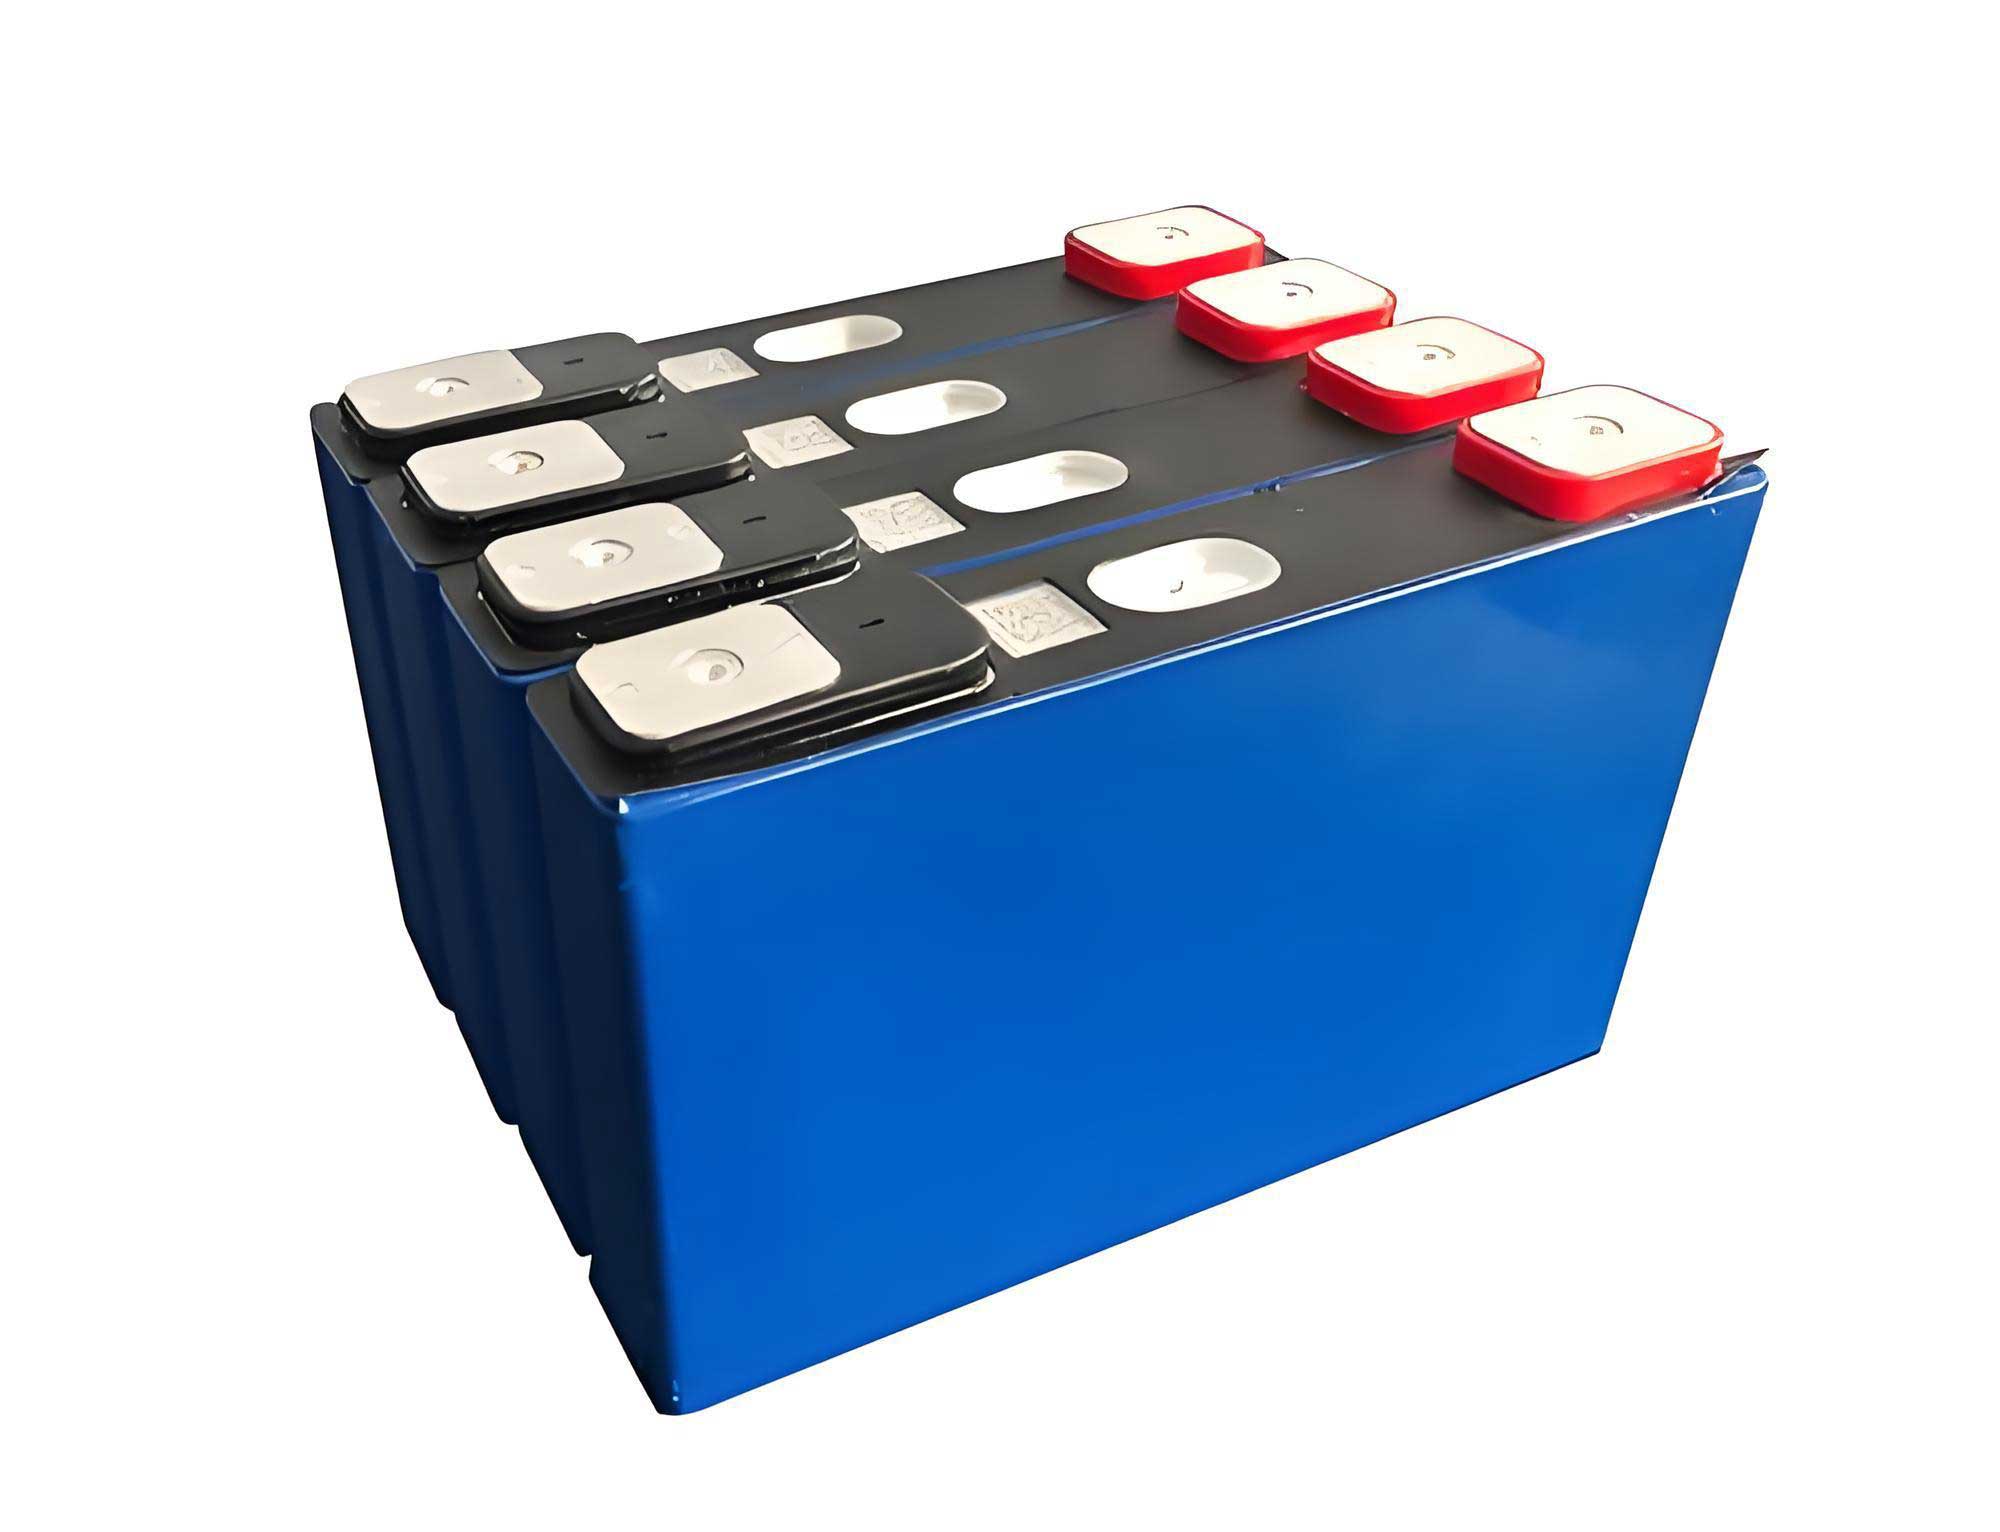
To empirically investigate this concept, I designed and conducted overcharge experiments on a liquid-cooled LiFePO4 battery module. The module had dimensions of 1 m × 0.72 m × 0.25 m, yielding a total internal volume of approximately 0.18 m³. It housed 48 LiFePO4 prismatic cells, each with a nominal capacity of 13 Ah, arranged in a 4×12 configuration. The liquid cooling system consisted of channels circulating a coolant to maintain thermal homogeneity, but during tests, the module was sealed to simulate real-world enclosed conditions. I selected two individual LiFePO4 battery cells at different positions within the module for overcharging at a 1 C rate (13 A) until thermal runaway occurred. The cells were initially at 0% state of charge (SOC). Key parameters monitored included cell surface temperature, safety valve temperature, voltage, and air pressure at multiple points inside the module.
For pressure detection, I employed BMP280 barometric pressure sensors, chosen for their low cost, compact size, high accuracy (±1 Pa resolution), and suitability for embedded applications. Four sensors were mounted on the front panel of the module at strategic locations labeled #1 to #4, as illustrated in the experimental setup. Sensor #1 was positioned near the top-right, #2 at the top-center, #3 at the bottom-right, and #4 at the bottom-center. These placements allowed me to study spatial variations in pressure signals. The sensors operated at a sampling frequency of 4 Hz (0.25 s per sample), providing sufficient temporal resolution to capture rapid pressure changes. Data from the sensors, along with temperature and voltage readings, were recorded using a data acquisition system. External cameras and recorders documented the visual and thermal progression of the tests.
The overcharge process for the first LiFePO4 battery cell revealed insightful patterns. During normal charging, the temperature increased gradually, reaching about 32.2°C at 100% SOC (around 3600 s). Beyond this point, overcharge led to accelerated temperature rise due to internal side reactions. At 4519 s, the safety valve opened, indicated by a sudden drop in valve temperature (approximately 3°C) and a concurrent spike in pressure readings. At this moment, the cell surface temperature was 75°C, with a heating rate of 0.2°C/s. The pressure sensors detected an abrupt increase in air pressure, followed by a decay pattern. The cell eventually reached its peak temperature at 4943 s, marking complete thermal runaway, about 424 s after valve opening. The pressure data showed a distinct waveform: an initial exponential decay-like spike corresponding to the valve opening, succeeded by a slower, broader peak attributed to sustained gas release. This pattern underscores the two-phase nature of gas emission in a failing LiFePO4 battery.
To quantify the pressure response, I analyzed the sensor data at the valve opening instant. The table below summarizes key metrics for each sensor during the first overcharge test:
| Pressure Sensor | Response Delay (s) | Peak Pressure Rise (Pa) | Rise Time (s) | Recovery Time (s) |
|---|---|---|---|---|
| #1 | 1.75 | 272.5 | 0.50 | 2.00 |
| #2 | 0.25 | 289.1 | 0.50 | 2.00 |
| #3 | 1.75 | 263.9 | 0.50 | 2.00 |
| #4 | 1.75 | 265.8 | 0.50 | 2.00 |
Sensor #2 exhibited the shortest response delay (0.25 s) and the highest peak pressure rise (289.1 Pa), suggesting it was the most sensitive location. All sensors recorded similar rise times (0.5 s) and recovery times (2 s), indicating consistent pressure wave propagation. The pressure increase averaged around 200 Pa, which is significant given the module’s volume. This confirms that pressure signals can provide early warning, as the detection occurred when the LiFePO4 battery was at a relatively low temperature and well before thermal runaway.
The second overcharge test on another LiFePO4 battery cell yielded similar but more intense results. The safety valve opened at 5151 s, with a cell surface temperature of 82.1°C and a heating rate of 0.3°C/s. The pressure spikes were larger, averaging 500 Pa, likely due to more advanced internal degradation. The cell reached peak temperature at 5339 s, only 188 s after valve opening, indicating a faster progression to thermal runaway. The pressure waveform showed two consecutive spikes, implying multiple gas release events. Sensor data for this test is summarized below:
| Pressure Sensor | Response Delay (s) | Peak Pressure Rise (Pa) | Rise Time (s) | Recovery Time (s) |
|---|---|---|---|---|
| #1 | 0.75 | 560.8 | 0.75 | 3.75 |
| #2 | 0.25 | 581.0 | 0.75 | 3.75 |
| #3 | 1.00 | 548.1 | 1.00 | 3.50 |
| #4 | 0.50 | 557.7 | 1.00 | 3.75 |
Again, sensor #2 demonstrated superior performance with the shortest delay and highest peak. The rise and recovery times were slightly longer than in the first test, possibly due to different gas dynamics. These results emphasize that the severity of the LiFePO4 battery’s condition affects the pressure signal magnitude, but the detection capability remains robust across scenarios.
Based on the experimental findings, I derived initial guidelines for sensor deployment. The pressure signals were detectable within 1.75 s or less, with the best response at higher positions on the front panel (e.g., sensor #2). The pressure rise typically occurred within 0.5–1 s, implying that a sampling frequency of at least 2 Hz is needed to capture the peak accurately. Moreover, to avoid missing the event entirely, a minimum frequency of 0.5 Hz is required. The pressure increase ranged from 200 to 500 Pa for these 13 Ah LiFePO4 battery cells, so sensors with a resolution better than 50 Pa and a range covering at least 1 kPa are advisable. These insights form a basis for optimizing early warning systems in liquid-cooled LiFePO4 battery modules.
To complement the experiments and gain deeper insights into pressure distribution, I performed computational fluid dynamics (CFD) simulations using ANSYS Fluent. I created a 1:1 scale model of the liquid-cooled LiFePO4 battery module, representing the internal air domain as a closed volume. A single LiFePO4 battery cell was designated as the fault cell, with a circular vent (2 cm diameter) on its top surface to simulate the safety valve. Gas release was modeled based on typical compositions from LiFePO4 battery degradation: H₂ (30 mol%), C₂H₄ (12 mol%), CO (6 mol%), and CO₂ (52 mol%). The injection velocity followed an exponential decay function, starting at an initial value \( v_0 \) and decreasing over time:
$$ v(t) = v_0 e^{-\alpha t} $$
where \( v(t) \) is the velocity at time \( t \), \( v_0 \) is the initial velocity, and \( \alpha \) is a decay constant. The gas was released vertically upward, consistent with typical valve orientations. Simulations were conducted to examine pressure propagation and spatial variations.
The first simulation focused on a single fault cell at a fixed location. Results showed that pressure spread rapidly throughout the module, reaching a peak average increase of about 200 Pa within 0.02 s after valve opening. The 3D pressure distribution indicated that the region directly above the valve experienced the highest pressure, but differences across the module were small (less than 20 Pa), due to the confined space and efficient wave propagation. A vertical cross-section through the valve axis illustrated the pressure evolution over time. I also analyzed pressure at six virtual monitoring points on the front panel (v1 to v6, from top-left to bottom-right). The data revealed that points at higher elevations (v1, v2) recorded slightly higher pressures than lower ones (v5, v6), aligning with experimental observations. Horizontal variations were minimal in this ideal simulation, but real-world factors like turbulence could introduce asymmetry.
To assess the impact of fault cell location, I ran six simulations with the fault cell at different positions within the LiFePO4 battery array. The pressure responses at three representative monitoring points were compared. The table below summarizes the peak pressure rises for each case, normalized to the average value:
| Fault Cell Position | Peak Pressure at Point A (Pa) | Peak Pressure at Point B (Pa) | Peak Pressure at Point C (Pa) | Notes |
|---|---|---|---|---|
| #1 (Top-front) | 215 | 210 | 208 | Near front panel |
| #2 (Middle-front) | 205 | 220 | 215 | Central axis |
| #3 (Bottom-front) | 198 | 195 | 200 | Lower section |
| #4 (Top-rear) | 190 | 185 | 188 | Farther from front |
| #5 (Middle-rear) | 180 | 175 | 178 | Rear central |
| #6 (Bottom-rear) | 170 | 168 | 172 | Most distant |
Cells closer to the front panel and center produced larger pressure signals at the monitoring points, with differences up to 45% compared to distant cells. This suggests that sensor placement should account for potential fault locations, but since thermal runaway can initiate anywhere in a LiFePO4 battery module, a distributed sensor network might be beneficial.
Another simulation series varied the initial gas release velocity \( v_0 \) to model different LiFePO4 battery capacities or degradation states. I tested \( v_0 = 40 \, \text{m/s} \), \( 60 \, \text{m/s} \), and \( 80 \, \text{m/s} \). The peak pressure rises scaled proportionally with \( v_0 \), as described by the momentum equation:
$$ \Delta P \propto \rho v_0^2 $$
where \( \Delta P \) is the pressure rise and \( \rho \) is the gas density. The recovery times remained similar across cases, indicating that the duration of the pressure event is less sensitive to release velocity. For instance, with \( v_0 = 80 \, \text{m/s} \), the peak pressure exceeded 400 Pa, whereas with \( v_0 = 40 \, \text{m/s} \), it was around 200 Pa. This underscores that larger LiFePO4 battery cells or more severe faults yield stronger signals, facilitating detection but requiring sensors with appropriate dynamic ranges.
Integrating experimental and simulation results, I can formulate comprehensive recommendations for implementing air-pressure-based early warning in liquid-cooled LiFePO4 battery modules. The detection mechanism is highly effective, providing alerts when the LiFePO4 battery temperature is below 100°C and heating rates are under 0.5°C/s, typically hundreds of seconds before full thermal runaway. This advance warning time allows for preventive measures such as load shedding, cooling activation, or emergency shutdown. Key parameters for sensor selection include a sampling frequency greater than 2 Hz to capture waveform details, a resolution better than 50 Pa, and a range that accommodates expected pressure rises (e.g., 0–1 kPa for modules with 10–20 Ah LiFePO4 battery cells). Sensors should be placed at elevated positions on module panels, preferably away from the centerline to maximize signal strength, as observed with sensor #2 in tests. Multiple sensors can enhance reliability by covering spatial variations and providing redundancy.
The underlying physics can be further elaborated using fluid dynamics models. The pressure wave propagation in the module can be approximated by the acoustic wave equation:
$$ \frac{\partial^2 P}{\partial t^2} = c^2 \nabla^2 P $$
where \( c \) is the speed of sound in air (about 343 m/s at room temperature). Given the module dimensions, the time for a pressure wave to traverse the entire volume is on the order of milliseconds, explaining the rapid signal detection. Additionally, the gas release from the LiFePO4 battery can be modeled as a transient source term in the mass conservation equation:
$$ \frac{\partial \rho}{\partial t} + \nabla \cdot (\rho \mathbf{u}) = \dot{m} $$
where \( \rho \) is air density, \( \mathbf{u} \) is velocity vector, and \( \dot{m} \) is the mass source rate from the battery. Solving these equations numerically, as in CFD simulations, helps predict pressure distributions and optimize sensor layouts.
In practice, implementing this early warning system involves embedding pressure sensors into the module’s monitoring circuitry. The sensors should be protected from environmental hazards like condensed electrolytes or high temperatures, possibly using protective housings or selecting ruggedized models. Data processing algorithms can be developed to distinguish valve-opening events from noise, such as by setting thresholds on pressure derivatives or applying pattern recognition. For instance, a sudden pressure increase exceeding 100 Pa within 0.5 s could trigger an alarm. Calibration under normal operating conditions is essential to account for background pressure fluctuations due to cooling system operation or ambient changes.
The benefits of this approach extend beyond LiFePO4 battery modules to other lithium-ion battery systems with sealed enclosures, such as those used in electric vehicles or stationary storage. However, LiFePO4 batteries are particularly relevant due to their widespread use in large-scale energy storage, where safety is paramount. By integrating pressure sensing with existing BMS (Battery Management System) functionalities, a multi-parameter safety framework can be established, combining voltage, temperature, and pressure monitoring for comprehensive risk mitigation.
In conclusion, my research demonstrates that air-pressure signal detection is a viable and effective method for early warning of thermal runaway in liquid-cooled LiFePO4 battery modules. Through controlled overcharge experiments, I observed that safety valve opening causes detectable pressure spikes of 200–500 Pa within seconds, while the LiFePO4 battery is still at moderate temperatures. CFD simulations provided insights into pressure distribution, confirming that sensors placed higher on module panels yield stronger signals. The technique offers a proactive safety measure, potentially preventing fires and explosions in energy storage installations. Future work could explore miniaturized sensor arrays, machine learning for signal classification, and integration with active suppression systems. As the adoption of LiFePO4 battery technology grows, such innovative safety solutions will be crucial for ensuring reliable and secure energy storage infrastructure.