
1. Introduction
The global energy landscape is undergoing a fundamental transformation, driven by the urgent need to reduce carbon emissions and achieve sustainable development. Solar energy, as one of the most abundant and clean renewable resources, has experienced dramatic growth, and photovoltaic (PV) power generation systems now contribute a significant share of the world’s electricity mix. In every solar inverter system, the inverter itself is the core power conversion unit that directly influences overall system efficiency, reliability, cost, and physical footprint. The design of modern solar inverters has become increasingly challenging because the relationships among efficiency, lifetime, power density, cost, and electromagnetic interference (EMI) are strongly coupled and often conflicting.
The adoption of wide-bandgap (WBG) devices such as silicon carbide (SiC) MOSFETs has introduced new opportunities and new challenges. SiC devices possess superior material properties, including a high critical electric field, high saturation electron drift velocity, and high thermal conductivity. These properties enable higher switching frequencies, lower switching losses, and higher allowable junction temperatures. Consequently, SiC-based solar inverters can achieve higher power density and efficiency compared with conventional silicon-based converters. Nevertheless, the higher switching speeds and frequencies also exacerbate EMI issues, and the thermal coupling among tightly packed components may adversely affect the lifetime of the system. Therefore, a comprehensive multi-objective optimization approach is necessary to balance all of these conflicting criteria.
In this chapter, I present a systematic multi-objective optimization design method for a solar inverter based on a newly proposed algorithm named DQ-NSGAIII. The main contributions are as follows:
- A three-level modeling framework is established, consisting of component-level models (loss, thermal, lifetime), device-level models (efficiency, lifetime, power density, special cost, and EMI constraint), and product-level models (technical advantage and profit).
- An improved evolutionary algorithm, DQ-NSGAIII, is proposed by integrating quasi-opposition-based learning (QBL), an enhanced differential evolution (DE) operator, and a strengthened dominance relation (SDR) into the standard NSGA-III framework.
- A customized optimization workflow is developed and applied to a 140 kW three-phase active neutral-point-clamped (ANPC) solar inverter, resulting in a four-dimensional Pareto front.
- Experimental prototypes are constructed and tested to validate the efficiency model and the common-mode EMI reduction.
2. Three-Level Modeling of the Solar Inverter
2.1 Topology Selection
Several three-level inverter topologies were compared in terms of device count, voltage stress, and loss distribution. For high-power and high-efficiency solar inverter applications, the ANPC topology was selected. The ANPC inverter consists of six active switches per phase, with two SiC MOSFETs operating at high switching frequency and four Si IGBTs operating at line frequency. A hybrid 2 SiC + 4 Si configuration was used to balance performance and cost. The selected nominal specifications are summarized in the following table.
| Parameter | Value | Unit |
|---|---|---|
| Rated input power | 140 | kW |
| DC bus voltage | 1200 | V |
| Phase output voltage (RMS) | 380 | V |
| Phase output current (RMS) | 120 | A |
| Modulation index | 0.9 | – |
| Power factor | 1 | – |
| Ambient temperature | 30 | °C |
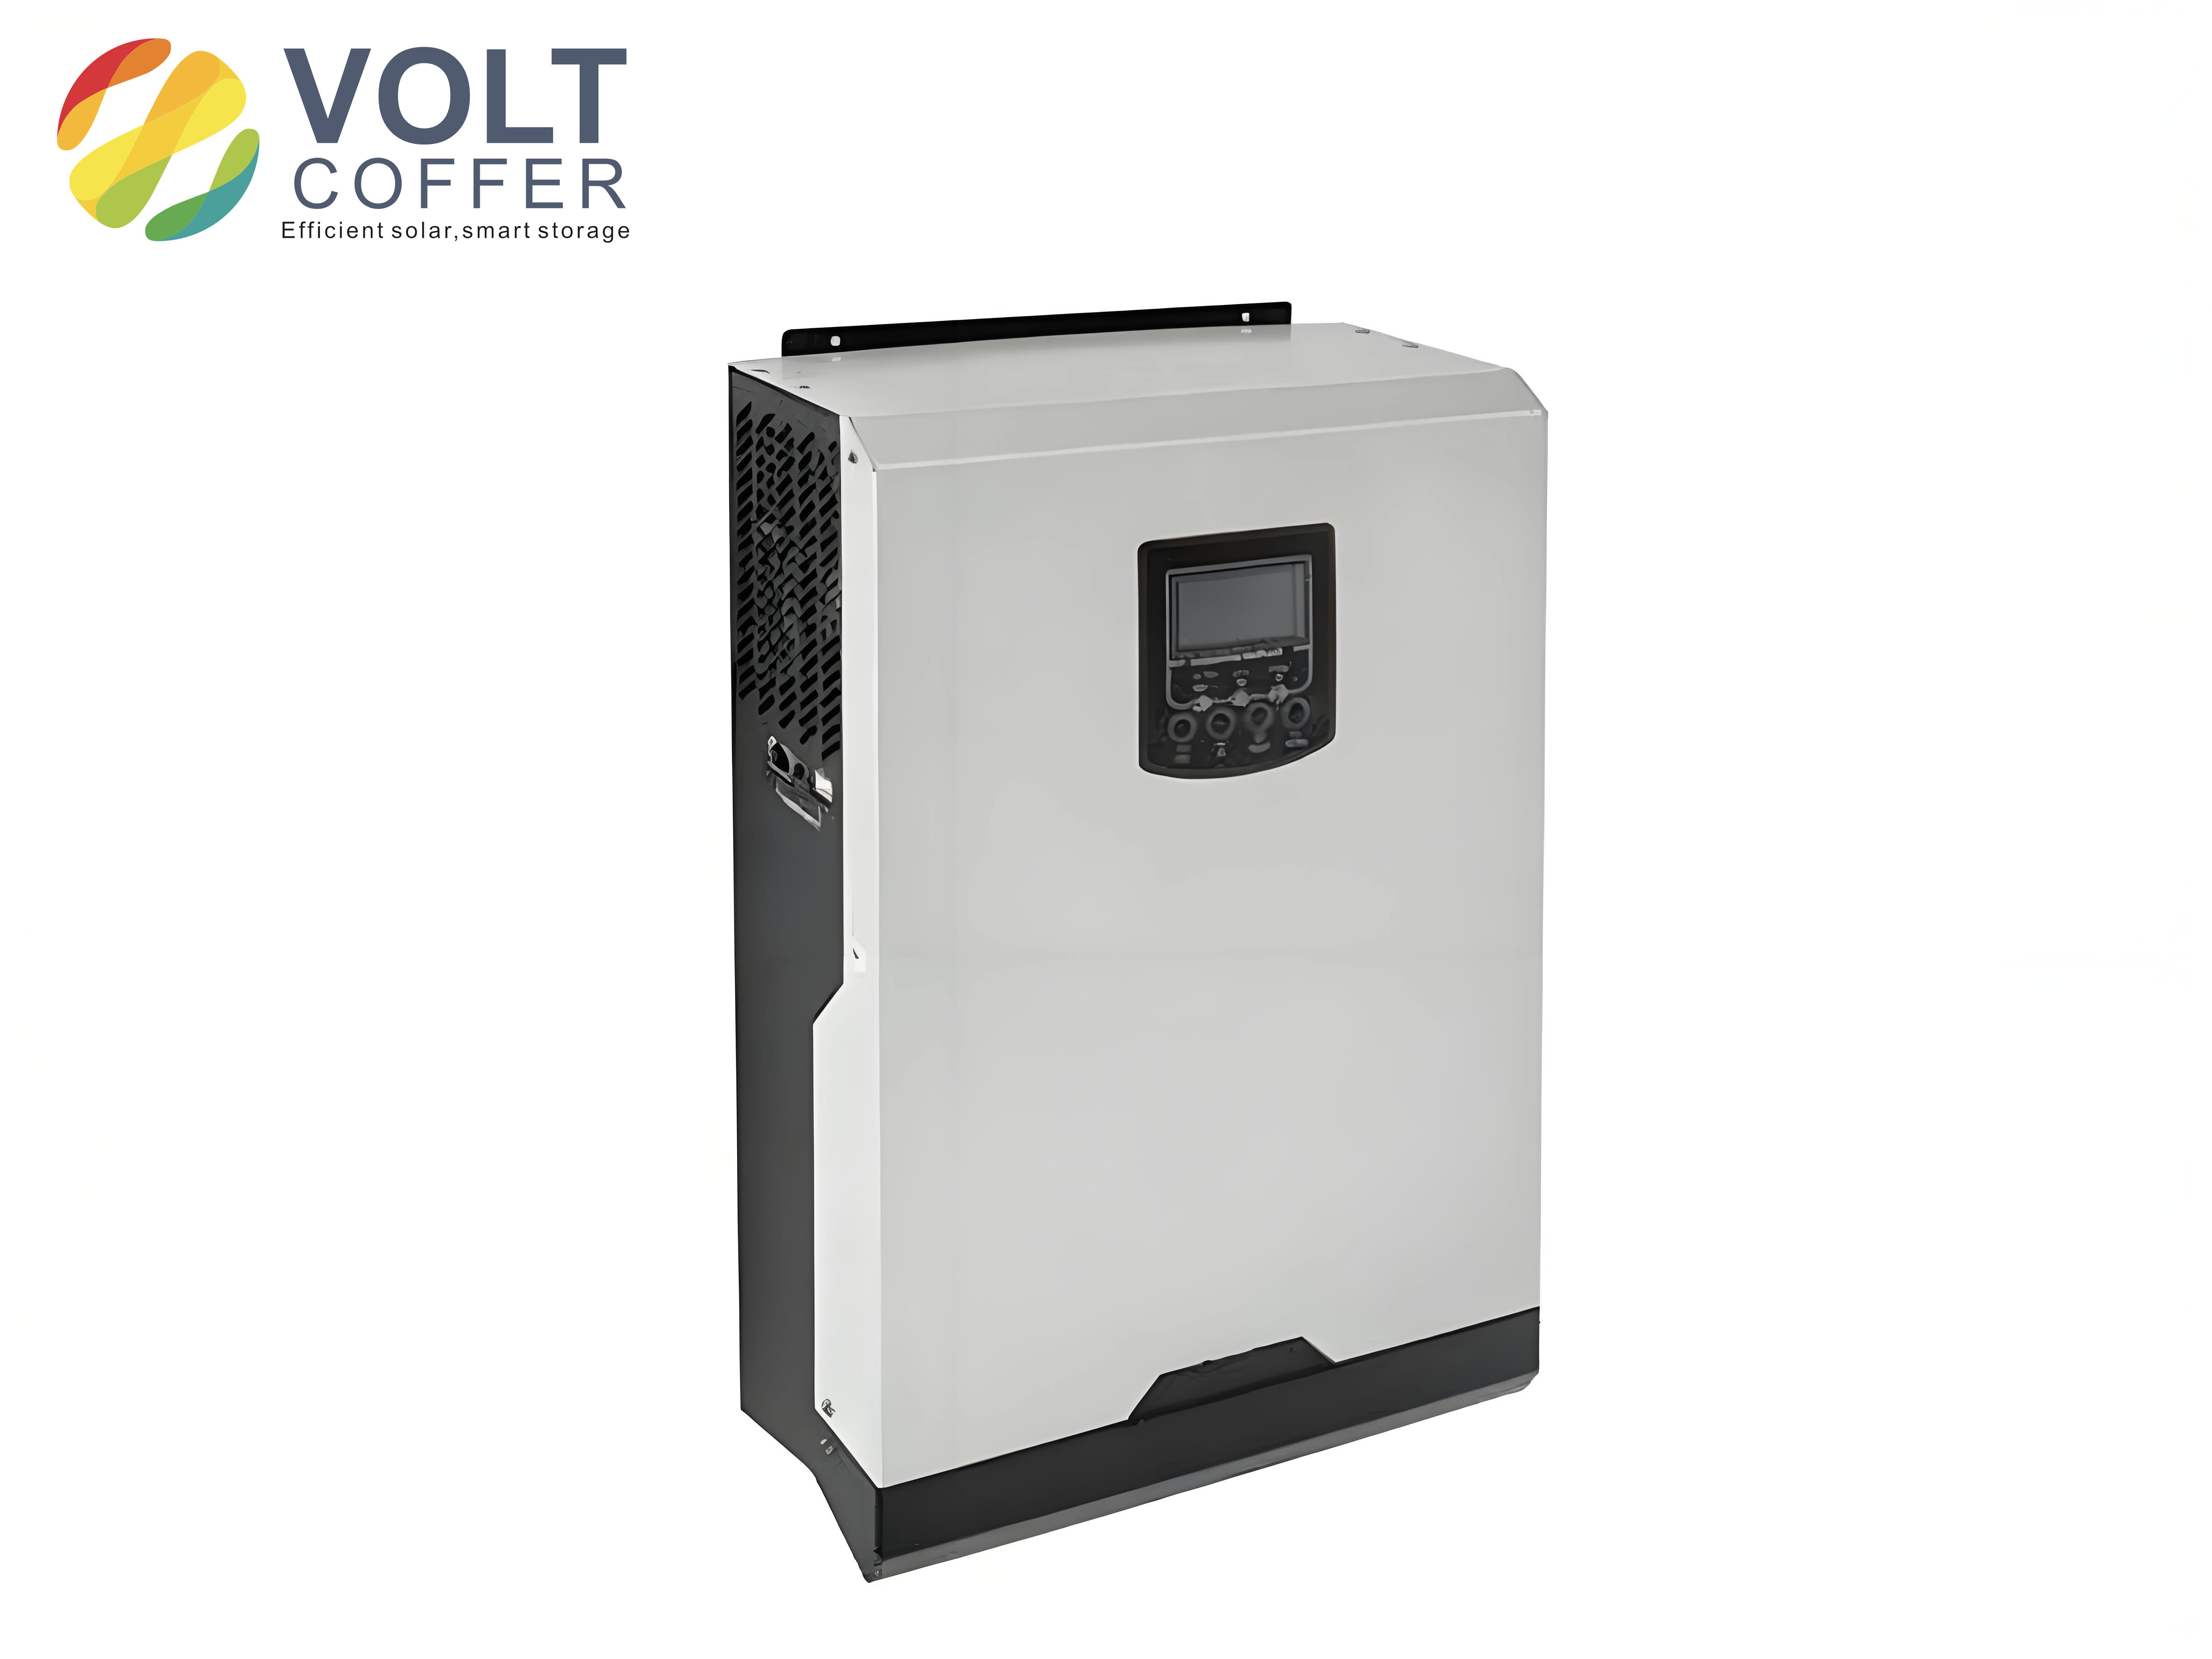
2.2 Component-Level Models
2.2.1 Switching Loss Model
For a selected ANPC power module, the conduction losses of the IGBTs and MOSFETs were calculated using curve-fitted output characteristics. The IGBT conduction loss in phase A is expressed as:
$$
P_{\mathrm{IGBT}} = \frac{1}{2\pi} \int_{0}^{\pi} v_{\mathrm{CE}}(i_c) \cdot i_c(t) \cdot d(\omega t)
$$
where \(v_{\mathrm{CE}}(i_c)\) is the saturation voltage fitted from the datasheet. For the high-frequency SiC MOSFETs, the total loss includes conduction and switching losses:
$$
P_{\mathrm{MOSFET}} = P_{\mathrm{cond, MOSFET}} + P_{\mathrm{sw, MOSFET}}
$$
The switching loss is determined by the stored energies \(E_{\mathrm{on}}\) and \(E_{\mathrm{off}}\) at the operating current:
$$
P_{\mathrm{sw, MOSFET}} = f_{\mathrm{sw}} \left(E_{\mathrm{on}} + E_{\mathrm{off}}\right)
$$
The total semiconductor loss for the three-phase ANPC inverter is:
$$
P_{\mathrm{semi}} = 3 \left(P_{\mathrm{IGBT}} + P_{\mathrm{MOSFET}}\right)
$$
2.2.2 Thermal Model and Junction Temperature
To estimate the device lifetime, an accurate junction temperature profile is necessary. The thermal network is modeled using Foster networks. The junction temperature of the SiC MOSFET \(T_j\) is calculated as:
$$
T_j = T_a + P_{\mathrm{MOSFET}} \cdot Z_{\mathrm{th(j-c)}} + \left(P_{\mathrm{module}} + P_{\mathrm{diode}}\right) \cdot Z_{\mathrm{th(c-s)}} + P_{\mathrm{module}} \cdot Z_{\mathrm{th(s-a)}}
$$
where \(Z_{\mathrm{th(j-c)}}\), \(Z_{\mathrm{th(c-s)}}\), and \(Z_{\mathrm{th(s-a)}}\) are the thermal impedances. The thermal impedance network is shown as a Foster network of multiple RC stages.
2.2.3 Lifetime Model
The lifetime of the solar inverter is dominated by the most aged SiC MOSFET, which experiences high-frequency thermal cycling. The Rainflow counting method is used to extract the temperature swing \(\Delta T_j\), the mean junction temperature \(T_{jm}\), and the number of cycles \(n_i\). The number of cycles to failure is predicted by a Coffin–Manson type model:
$$
N_f (T_{jm}, \Delta T_j) = A \cdot \Delta T_j^{\alpha} \cdot \exp\left(\frac{E_a}{k_B T_{jm}}\right)
$$
where \(A\) and \(\alpha\) are empirical constants, \(E_a\) is the activation energy, and \(k_B\) is Boltzmann’s constant. Then, Miner’s linear damage accumulation rule is applied:
$$
D = \sum_{i} \frac{n_i}{N_{f,i}}
$$
and the predicted lifetime \(L_f\) is given by:
$$
L_f = \frac{1}{D}
$$
2.2.4 Inductor Model
The LCL filter design includes the inverter-side inductor \(L_1\), the grid-side inductor \(L_2\), and the filter capacitor \(C_f\). The inductor design procedure uses the \(A_p\) product method and considers both non-crystal and iron-silicon alloy cores. The inductor volume and losses are functions of core geometry, number of turns, fill factor, and switching frequency. The core loss model is described by:
$$
P_{\mathrm{core}} = K_c f_{\mathrm{sw}}^{\alpha} B_{\max}^{\beta} V_L
$$
where \(K_c\), \(\alpha\), and \(\beta\) are material constants, and \(V_L\) is the core volume. The winding loss is calculated with the DC resistance and the skin effect factor.
2.3 Device-Level Models
Four device-level performance metrics were formulated as maximization objectives.
2.3.1 Efficiency
The system efficiency is defined as:
$$
\eta = \frac{P_{\mathrm{out}}}{P_{\mathrm{in}}} = \frac{P_{\mathrm{in}} – P_{\mathrm{loss}}}{P_{\mathrm{in}}}
$$
where \(P_{\mathrm{loss}}\) includes semiconductor losses, inductor losses, and capacitor losses.
2.3.2 Lifetime
The system lifetime is approximated by the lifetime of the SiC MOSFET \(S_{a2}\):
$$
L_f = \frac{1}{\sum_{i} n_i / N_{f,i}}
$$
2.3.3 Power Density
The power density is computed as:
$$
\rho = \frac{P_{\mathrm{out}}}{V_{\mathrm{total}}} = \frac{P_{\mathrm{out}}}{N_T V_T + N_L V_L + N_{\mathrm{heat}} V_{\mathrm{heat}}}
$$
where \(V_T\), \(V_L\), and \(V_{\mathrm{heat}}\) are the volumes of a power module, inductor, and heat sink, respectively. \(N_T\), \(N_L\), and \(N_{\mathrm{heat}}\) are the corresponding numbers.
2.3.4 Special Cost
The cost objective is transformed into a maximization problem by defining the special cost as:
$$
\sigma = \frac{P_{\mathrm{out}}}{C_{\mathrm{total}}}
$$
where \(C_{\mathrm{total}}\) is the total cost of power modules, inductors, and heat sinks.
2.3.5 EMI Constraint
The common-mode EMI is suppressed using an impedance balance method. A balance inductor \(L_0\), a capacitor \(C=1\,\mathrm{nF}\), and a resistor \(R=2\,\mathrm{kΩ}\) are added between the AC terminal and the DC bus midpoint. The CM noise voltage is evaluated over the frequency range of 150 kHz to 30 MHz. Solutions that violate the EMI standard are discarded.
2.4 Product-Level Models
To support actual product development, two additional metrics are introduced.
2.4.1 Technical Advantage
The technical advantage is defined as a weighted sum of normalized efficiency, lifetime, and power density:
$$
Y_1 = \lambda_1 F_1 + \lambda_2 F_2 + \lambda_3 F_3
$$
with \(\lambda_1=0.5\), \(\lambda_2=0.25\), \(\lambda_3=0.25\). The normalization of efficiency is:
$$
F_1 = \frac{\eta – \eta_{\min}}{\eta_{\max} – \eta_{\min}}
$$
2.4.2 Profit
The product-level profit is assessed by the net present value (NPV) method. The average annual profit is:
$$
Y_2 = \frac{\sum_{t=1}^{T} \frac{B_t – C_t}{(1+i)^t}}{T}
$$
where \(B_t\) is the electricity generation income, \(C_t\) is the annual cost, \(i=5\%/\)year, and \(T\) is the expected lifetime set to 10 years. The maintenance cost \(C_m\) is calculated from the predicted device lifetime:
$$
C_m = \frac{C_A}{Y_{\mathrm{life}}} \cdot C_{\mathrm{rep}}
$$
where \(C_{\mathrm{rep}}\) is the replacement cost and \(Y_{\mathrm{life}}\) is the prediction of lifetime.
3. Proposed DQ-NSGAIII Algorithm
3.1 Baseline Algorithms and Limitations
NSGA-II is widely used for two- or three-objective problems but suffers severe performance degradation when the number of objectives increases. The dominance ratio decreases exponentially with the number of objectives, making the selection pressure extremely low. MOEA/D decomposes a multi-objective problem into scalar subproblems, but it is sensitive to weight vector design and struggles with irregular Pareto fronts. NSGA-III uses reference points to maintain diversity and is suitable for many-objective optimization, but its random initialization, simulated binary crossover, and Pareto-dominance relation can lead to poor convergence and high computational cost on complex power electronics problems.
3.2 Algorithmic Improvements
3.2.1 Quasi-Opposition-Based Learning Initialization
The initial population is generated by a two-step process. First, a random population is created. Then, for each decision variable \(x_i\), the quasi-opposite value is calculated as:
$$
x_i^{qo} = a_i + b_i – x_i + \mathcal{U}\left(-m_i, m_i\right)
$$
where \(m_i = (b_i – a_i) / 2\). The combined population is sorted by Pareto dominance, and the best \(N\) individuals are selected as the initial population. This method improves the diversity of the initial population and accelerates convergence.
3.2.2 Improved Differential Evolution Crossover
The standard SBX crossover is replaced by a modified DE operator. For a target vector \(x_i\), the donor vector \(v_i\) is generated by:
$$
v_{i,j} = x_{r1,j} + F \cdot \left(x_{r2,j} – x_{r3,j}\right)
$$
where \(r_1\), \(r_2\), and \(r_3\) are distinct indices selected from the neighborhood of the best individual to ensure both exploration and exploitation. The crossover factor is \(CR=0.9\), and the scaling factor is \(F=0.5\). The DE operator is used in the early 30% of generations to accelerate convergence, while the GA-based crossover is used afterward to maintain population diversity and reduce runtime.
3.2.3 Strengthened Dominance Relation
To improve selection pressure in high-dimensional objective spaces, the conventional Pareto dominance relation is replaced by the strengthened dominance relation (SDR). SDR considers the angle between individuals. A solution \(p\) dominates \(q\) if:
$$
\mathrm{angle}(p,q) \leq \bar{\theta}
$$
and the convergence value of \(p\) is better than that of \(q\), where \(\bar{\theta}\) is the threshold angle. SDR helps eliminate crowded non-dominated solutions and balances convergence and diversity. The overall flowchart of DQ-NSGAIII is shown in the algorithm framework.
3.3 Performance Comparison on Test Problems
The DQ-NSGAIII algorithm was compared with NSGA-II, NSGA-III, and MOEA/D on DTLZ1 to DTLZ4 test functions, with numbers of objectives \(M = 3,5,8,10,15\). The inverted generational distance (IGD) metric was used for quantitative evaluation:
$$
IGD(P, P^*) = \frac{\sum_{v \in P^*} d(v, P)}{|P^*|}
$$
where \(P^*\) is the true Pareto front and \(d(v, P)\) is the Euclidean distance from \(v\) to the nearest point in \(P\). Lower IGD corresponds to better convergence and diversity. The experimental settings are listed below.
| Parameter | Value |
|---|---|
| Population size | 100 |
| Number of generations | 100 |
| Crossover probability | 0.9 |
| Mutation probability | 1/D |
| Crossover distribution index | 20 |
| Mutation distribution index | 20 |
| DE crossover factor | 0.9 |
| DE scaling factor | 0.5 |
The IGD comparison results are summarized in the following table, where the best values are highlighted.
| Function | M | NSGA-III | MOEA/D | NSGA-II | DQ-NSGAIII |
|---|---|---|---|---|---|
| DTLZ1 | 3 | 3.27e-1 | 1.14e-1 | 2.02e-1 | 8.94e-2 |
| DTLZ1 | 5 | 6.69e-1 | 3.43e-1 | 2.13e+0 | 1.69e-1 |
| DTLZ1 | 8 | 7.54e-1 | 3.64e-1 | 3.16e+1 | 3.38e-1 |
| DTLZ2 | 3 | 5.50e-2 | 5.50e-2 | 6.95e-2 | 5.49e-2 |
| DTLZ2 | 5 | 2.17e-1 | 2.13e-1 | 3.41e-1 | 2.17e-1 |
| DTLZ3 | 3 | 1.03e+1 | 1.70e+1 | 8.69e+0 | 5.28e+0 |
| DTLZ3 | 5 | 2.10e+1 | 1.68e+1 | 5.76e+1 | 9.88e+0 |
| DTLZ4 | 3 | 1.50e-1 | 4.18e-1 | 1.55e-1 | 5.52e-2 |
| DTLZ4 | 5 | 3.12e-1 | 6.59e-1 | 3.00e-1 | 2.20e-1 |
The results show that DQ-NSGAIII achieves the best IGD values in most cases, especially on DTLZ1 and DTLZ4, validating the effectiveness of the proposed improvements.
4. Multi-Objective Optimization Design Framework and Case Study
4.1 Optimization Framework
The proposed design flow consists of three phases. In the first phase, the input parameters are defined, including system specifications, component databases, and design variable ranges. The design space is denoted as \(\Omega = \{x \in \mathbb{R}^D\}\). In the second phase, the device-level objective functions are evaluated, and the DQ-NSGAIII algorithm performs evolutionary operations. The four-dimensional Pareto front is obtained after the maximum generation count. In the third phase, the product-level metrics are computed, and a two-dimensional Pareto front is generated to support final decision-making.
4.2 Design Variables and Constraints
The design variables and their ranges are listed below.
| Variable | Range | Step | Unit | Type |
|---|---|---|---|---|
| Switching frequency \(f_{sw}\) | 10–65 | 1 | kHz | Continuous |
| Current ripple coefficient \(\gamma_c\) | 5–30 | 1 | % | Continuous |
| Window utilization factor \(k_u\) | 0.3–0.45 | 0.05 | – | Continuous |
| Maximum flux density \(B_{max}\) | 1.0–1.3 | 0.1 | T | Continuous |
| Power module type | 1 or 2 | – | – | Discrete |
| Core material | 1 or 2 | – | – | Discrete |
The junction temperature of each power device must not exceed the maximum allowable value. Solutions that fail this constraint are rejected.
4.3 Relationship Analysis Among Objectives
Before presenting the final Pareto front, pairwise and triplewise relationships among the four objectives were analyzed. The following conclusions were drawn:
- The magnet material separates the Pareto front into two clusters. Non-crystal cores achieve higher efficiency and lower volume, while iron-silicon cores offer lower cost.
- The switching frequency is a critical design knob. Increasing \(f_{sw}\) reduces the required inductor size and improves power density, but increases switching losses, creating a trade-off.
- The system efficiency first rises and then falls with increasing frequency due to the opposing effects of switching loss and core loss.
- A higher power density generally leads to higher thermal coupling and reduced lifetime, confirming the conflict between \(\rho\) and \(L_f\).
- The feasible set is non-convex, which is typical for power electronics optimization problems.
4.4 Four-Dimensional Pareto Front
The DQ-NSGAIII algorithm was run with a population size of 100 and 100 generations. The hypervolume and runtime analysis indicated that the Pareto front converges with these settings. The four objectives were normalized to avoid scaling issues. The resulting Pareto front is visualized using parallel coordinates, where the minimum values of efficiency, lifetime, power density, and special cost are 98.06%, 0.2 years, 16 kW/dm³, and 100 kW/$, respectively. The maximum values are 98.68%, 88.5 years, 47 kW/dm³, and 188 kW/$.
Selected solutions are summarized in the following table.
| Solution | \(f_{sw}\) (kHz) | \(\gamma_c\) (%) | \(\eta\) (%) | \(L_f\) (years) | \(\rho\) (kW/dm³) | Cost ($) | \(T_j\) (°C) |
|---|---|---|---|---|---|---|---|
| Max \(\eta\) | 28 | 19 | 98.68 | 13.7 | 17 | 1400 | 107 |
| Max \(L_f\) | 10 | 14 | 97.84 | 88.5 | 12 | 1945 | 92 |
| Max \(\rho\) | 49 | 17 | 98.25 | 4.6 | 47 | 795 | 125 |
| Max \(\sigma\) | 65 | 29 | 97.91 | 1.4 | 34 | 749 | 135 |
| Compromise | 23 | 23 | 98.62 | 17.9 | 18 | 1478 | 103 |
A radar chart helps compare the relative performance of these candidate solutions. The final implementation uses the solution with the maximum technical advantage. The corresponding design parameters are: \(f_{sw}=33\) kHz, \(\gamma_c=28\%\), \(k_u=0.45\), \(B_{max}=1.3\) T, power module type 1, and core material type 1. The total loss is \(P_{loss}=1900\) W, efficiency is 98.64%, lifetime is 8.7 years, power density is 17.5 kW/dm³, and cost is 1340 $.
The loss breakdown of the final design is presented in the following table.
| Loss component | Value (W) | Percentage |
|---|---|---|
| IGBT conduction | 197 | 10.38% |
| MOSFET conduction | 366 | 19.25% |
| MOSFET switching | 248 | 13.08% |
| Inductor \(L_1\) | 549 | 28.91% |
| Inductor \(L_2\) | 539 | 28.39% |
5. Experimental Verification
5.1 Prototype Construction
A 140 kW three-phase ANPC solar inverter prototype was constructed following the optimized design. The prototype consists of three single-phase ANPC power modules, a DC-link capacitor board, an autonomous power supply, a DSP+FPGA control board, gate driver boards, signal conditioning boards, LCL filters, and an EMI filter board. The overall power density of the cabinet is 1.61 kW/dm³. Because the laboratory power supply was limited to 18 kW, the verification was conducted at several low-power points.
5.2 Waveform Measurements
The prototype was first tested under no-load conditions. The gate voltages of all six switches were observed to match the expected sequence. The high-frequency switch \(S_3\) operates at 40 kHz with a turn-on time of 720 ns and a turn-off time of 540 ns. Under load with a three-phase resistor bank of \(R_{load}=6.5 \, \Omega\), the inverter-side current \(I_{out1}\) and load current \(I_{out2}\) were measured. The LCL filter effectively reduces the current ripple, and the load current waveform is nearly sinusoidal. The actual ripple coefficient was \(\gamma_c=0.42\), which was used to estimate the theoretical efficiency.
5.3 Efficiency Validation
Eight low-power operating points were defined to verify the efficiency model. The efficiency was measured with a high-precision power analyzer after stable operation for one minute. The comparison between measured and theoretical efficiencies is shown in the following table.
| Test point | \(P_{in}\) (kW) | \(V_{DC}\) (V) | \(f_{sw}\) (kHz) | Theoretical \(\eta\) (%) | Measured \(\eta\) (%) |
|---|---|---|---|---|---|
| A | 11.07 | 500 | 25 | 98.67 | 98.39 |
| B | 11.00 | 500 | 30 | 98.65 | 98.42 |
| C | 10.91 | 500 | 35 | 98.61 | 98.45 |
| D | 10.86 | 500 | 40 | 98.57 | 98.49 |
| E | 6.93 | 400 | 40 | 98.26 | 98.33 |
| F | 8.78 | 450 | 40 | 98.33 | 98.39 |
| G | 10.86 | 500 | 40 | 98.39 | 98.43 |
| H | 13.14 | 550 | 40 | 98.43 | 98.68 |
The measured efficiency matches the theoretical prediction within an error of approximately 0.25%. The small discrepancy is attributed to high-frequency winding losses caused by the skin and proximity effects, unmodeled losses in the DC-link capacitors and AC filter capacitors, parasitic resistances of the interconnections, and the temperature dependence of semiconductor conduction losses.
In addition, the efficiency trend with respect to switching frequency and input power was consistent: the efficiency decreases with higher switching frequency and increases with higher input power in the low-power region.
5.4 Common-Mode EMI Suppression
The common-mode EMI of the prototype was evaluated using a line impedance stabilization network (LISN) and a spectrum analyzer. The balance inductance \(L_0=5.3 \, \mu H\), capacitor \(C=1 \, nF\), and resistor \(R=2 \, kΩ\) were added according to the impedance balance method. The measured CM noise spectrum over 150 kHz to 30 MHz shows a reduction of about 20 dBμV in the range of 150 kHz to 5 MHz. Above 15 MHz, the CM noise slightly increases due to impedance imbalance, but the overall EMI performance remains acceptable for the target application.
6. Conclusion
In this work, a systematic multi-objective optimization design method for a solar inverter based on the DQ-NSGAIII algorithm was presented. The main achievements are summarized as follows:
- A three-level modeling framework was established, enabling the simultaneous evaluation of efficiency, lifetime, power density, special cost, and EMI compliance for a 140 kW ANPC solar inverter.
- A new evolutionary algorithm DQ-NSGAIII was developed, incorporating quasi-opposition-based learning, an improved differential evolution operator, and a strengthened dominance relation. The algorithm demonstrated superior IGD performance compared with NSGA-II, NSGA-III, and MOEA/D on DTLZ test problems.
- The proposed optimization framework successfully obtained a four-dimensional Pareto front and a product-level two-dimensional Pareto front, providing useful decision-making support for product development.
- Experimental results on a hardware prototype confirmed the accuracy of the efficiency model and the effectiveness of the common-mode EMI suppression method.
Future work will focus on improving the loss model by considering temperature-dependent conduction losses and high-frequency effects, integrating more accurate mission-profile-based lifetime prediction, and extending the proposed method to other solar inverter topologies and grid-connected applications.