
As a key component in photovoltaic (PV) power generation systems, the solar inverter plays a critical role in converting DC power from solar panels into grid-compliant AC power, thereby enabling efficient and reliable renewable energy integration. In my experience working with large-scale PV stations, ensuring the stable operation of solar inverters is paramount for maximizing energy yield and minimizing downtime. However, over time, solar inverters inevitably encounter various internal faults—such as DC-link capacitor aging, IGBT driver failures, or filter circuit anomalies—that degrade power quality and can lead to forced outages. Traditional maintenance approaches often rely on periodic inspections or post-failure repairs, which are inefficient and costly. To address this challenge, I have developed and validated a diagnostic methodology based on high-frequency current waveform analysis. This approach exploits the fact that different fault types leave distinct signatures in the output current waveform, enabling rapid detection and precise localization of internal faults without requiring expensive additional hardware. In the following sections, I will detail the working principles of solar inverters, common fault types and their current waveform features, a step-by-step diagnostic procedure, and a real-world case study that demonstrates the effectiveness of the proposed method.
Role and Working Principle of the Solar Inverter
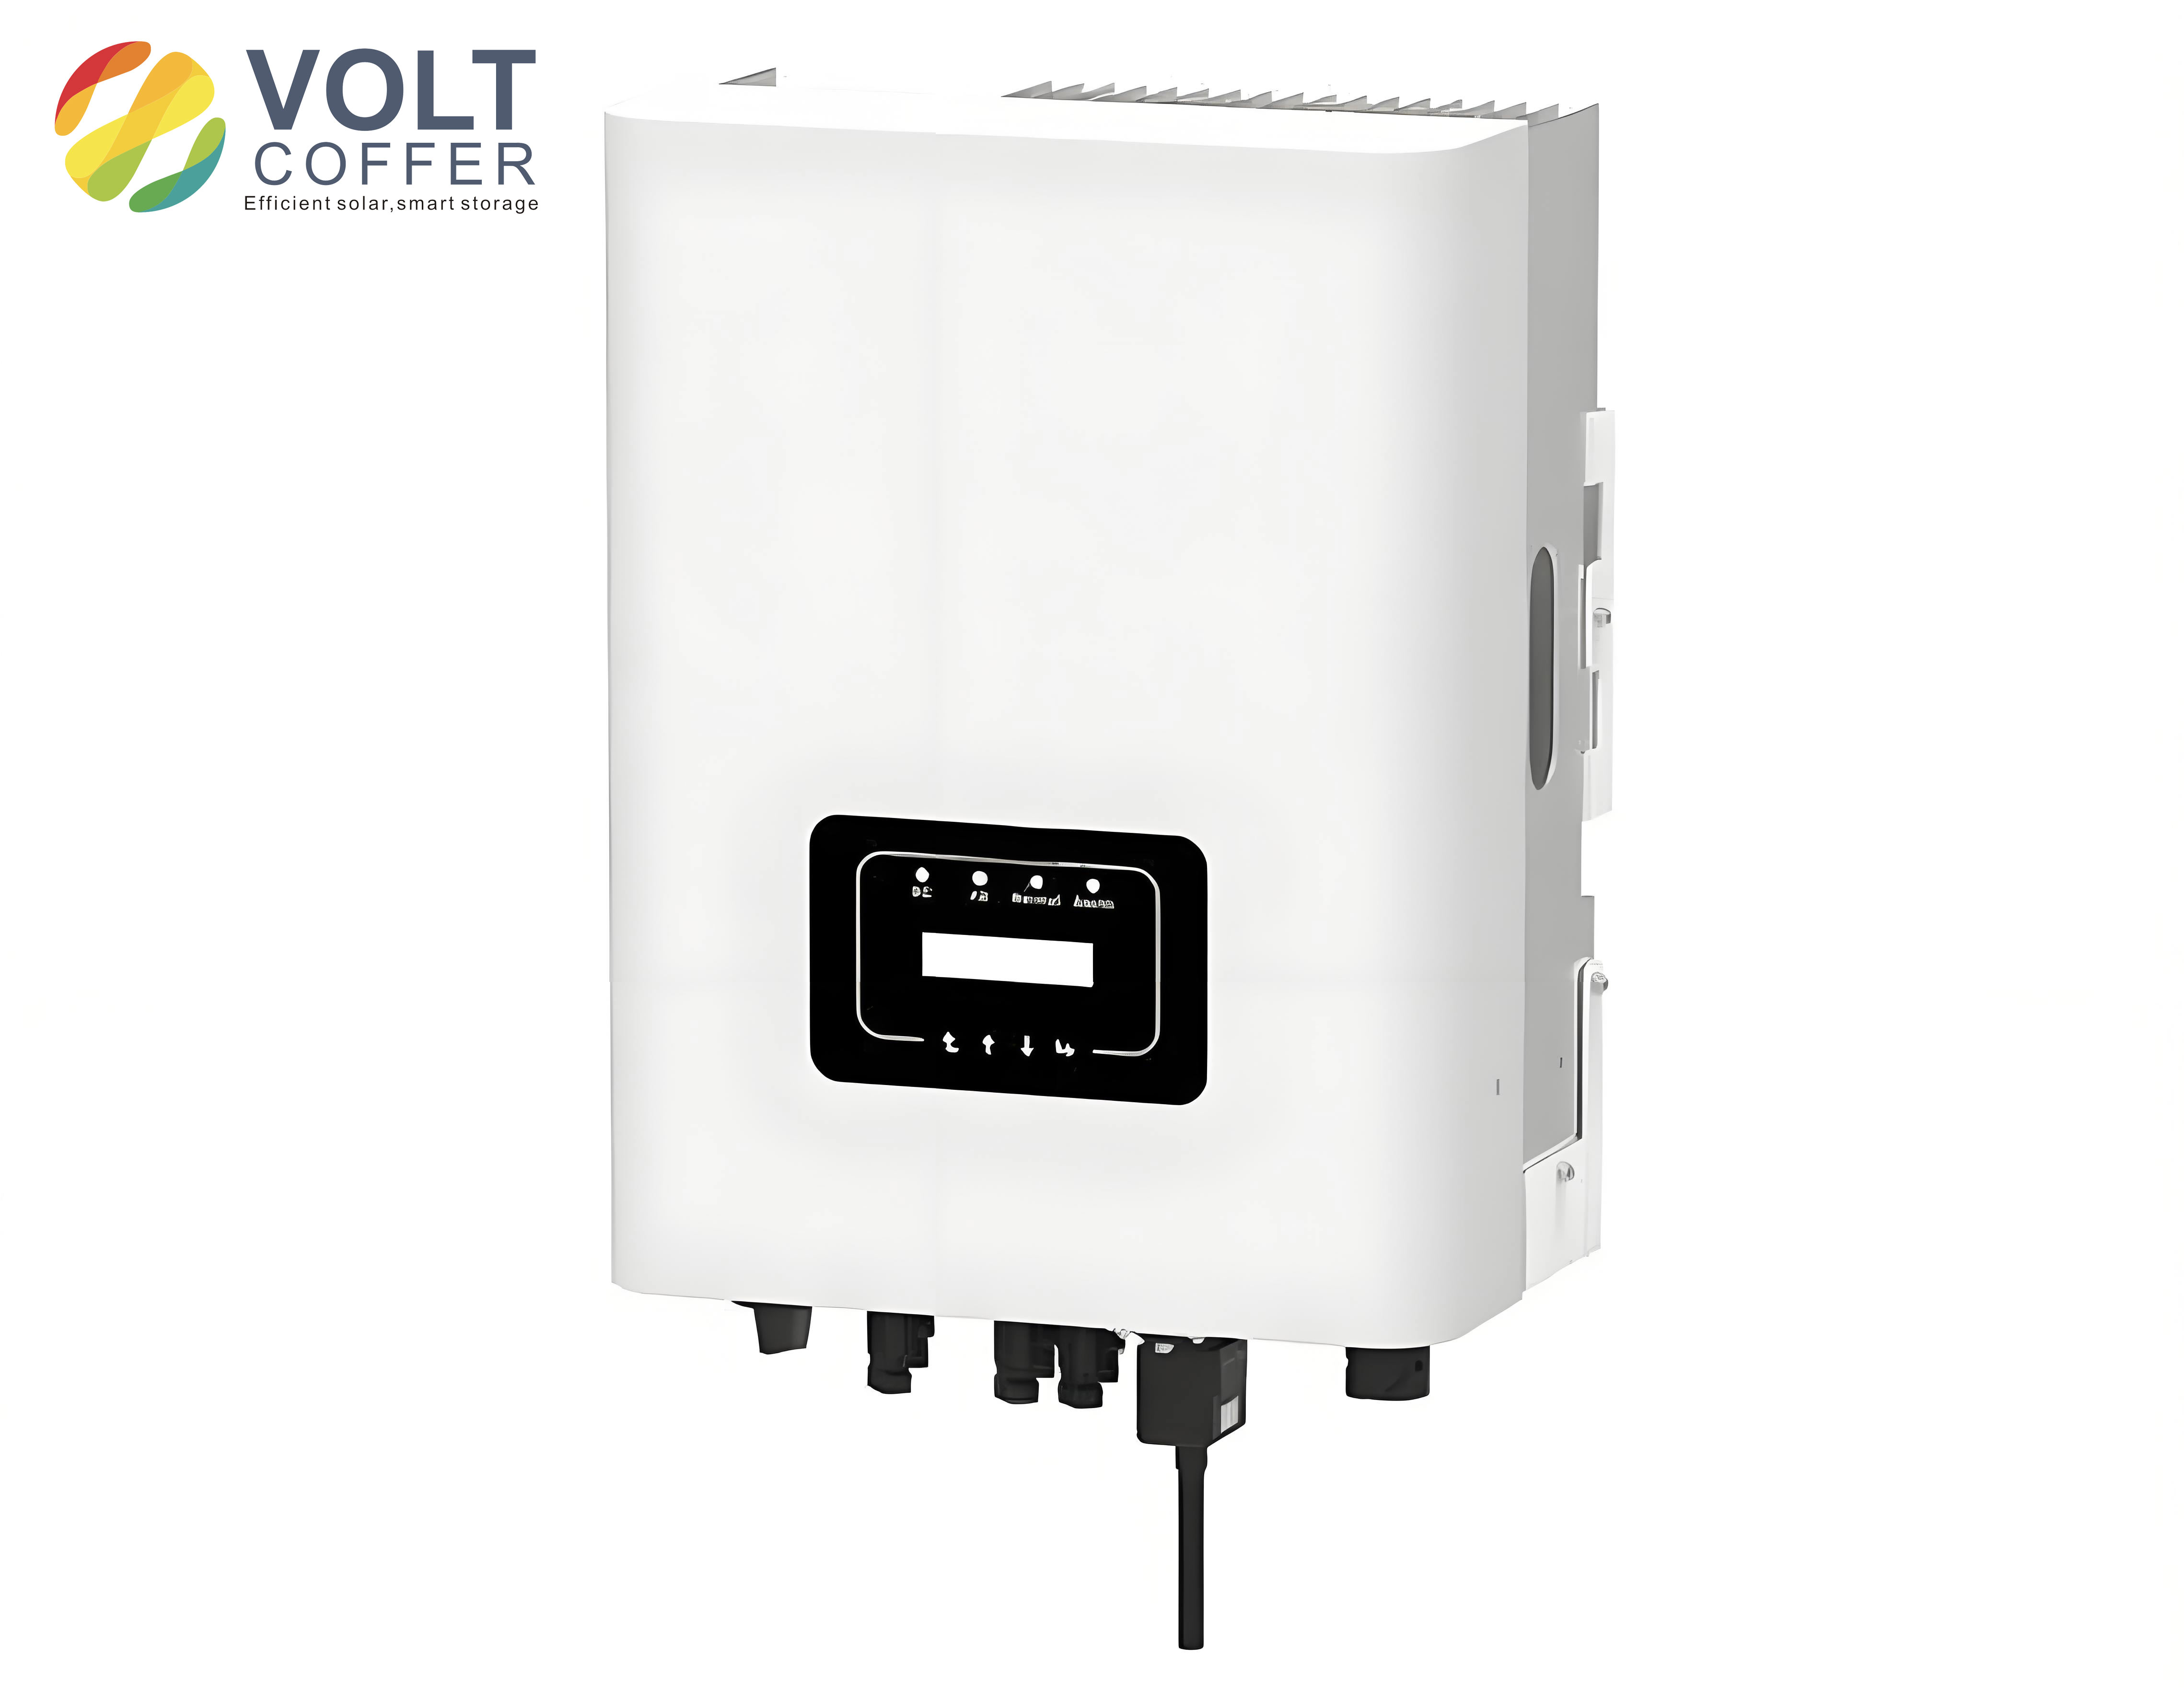
The solar inverter is the heart of any grid-connected PV system. Its primary function is to convert the variable DC output from the solar array into a stable, sinusoidal AC current that matches the grid voltage and frequency. A typical voltage-source inverter (VSI) topology consists of power switching devices (e.g., IGBTs), a DC-link capacitor bank, and an AC-side filter network (inductors and capacitors). During normal operation, the control system—usually based on a DSP or microcontroller—generates pulse-width modulation (PWM) signals that drive the IGBTs to synthesize a sinusoidal output. At the same time, a maximum power point tracking (MPPT) algorithm adjusts the DC-link voltage to extract the maximum available power from the PV modules. Additionally, the solar inverter incorporates protection functions such as anti-islanding, overvoltage/overfrequency protection, and low-voltage ride-through, all of which are essential for grid stability. The reliability of these components directly affects the current waveform quality. Any degradation in the DC-link capacitor, for instance, introduces voltage ripple that distorts the AC output current. Similarly, a faulty IGBT driver can cause switching timing errors, leading to current spikes or notches. Understanding these relationships is the foundation of waveform-based fault diagnosis.
Common Fault Types and Their Current Waveform Signatures
Through my field observations and laboratory tests, I have identified several common solar inverter faults that produce characteristic current waveform abnormalities. The following table summarizes these faults along with their typical waveform features and threshold indicators.
| Fault Type | Waveform Signature | Typical Parameter Changes | Diagnostic Threshold |
|---|---|---|---|
| DC-link capacitor aging | Asymmetric positive/negative half-cycles, increased ripple | DC component ratio >5%, THD >3%, 5th harmonic >1.5% | Peak-to-peak DC-link ripple >2× rated |
| IGBT driver failure | Sharp spikes or notches at rising/falling edges | Correlation coefficient <0.9 with ideal sine wave | Deviation >15% in edge region |
| AC filter inductor degradation | High-frequency oscillation (2× switching frequency) | Oscillation amplitude >10% of fundamental | Oscillation frequency >2× f_sw |
| Grid voltage loss | Current drops to zero suddenly | RMS current <5% of rated | Zero-crossing missing for >2 cycles |
| Ground fault (DC side) | DC offset in AC current, asymmetry | DC component >2% of fundamental | Ground resistance <1 kΩ |
| Communication failure | No direct waveform effect; indirect power reduction | Power slowly drifts away from MPP | Data packet loss >10% |
From this table, it is evident that although different faults manifest in unique ways, they all share common abnormalities such as amplitude deviation, waveform distortion, frequency offset, or asymmetry. This observation motivated me to develop a universal diagnostic method based on waveform feature extraction and comparison with a reference sine wave.
Proposed Diagnostic Method Based on Current Waveform Analysis
General Principle
The core idea of my method is to continuously monitor the solar inverter’s output current at a high sampling rate, extract key features (peak magnitude, RMS value, total harmonic distortion, DC component, etc.), and compare them against predefined thresholds derived from normal operation. When an abnormality is detected, the waveform pattern is analyzed to identify the most likely fault mode, and then a knowledge base combined with case-based reasoning is used to locate the specific faulty component. This approach is non-intrusive, low-cost, and can be implemented in existing monitoring systems.
Step 1: Current Waveform Acquisition and Feature Extraction
First, I use high-precision current sensors (e.g., Hall-effect type LEM LA 205-S) to sample the inverter’s output at a rate of at least 10 kHz, typically 20 kHz, to capture fast transients. The raw data is preprocessed using a low-pass filter—I often employ a 5th-order Butterworth filter with a cutoff frequency of 4 kHz—to remove switching noise while preserving the harmonic components of interest. Then, I normalize the signal to the range [-1, 1] for consistent comparison.
The following critical parameters are extracted from each cycle of the preprocessed waveform:
- Peak value (Ipeak): Under normal conditions, the peak shall remain within ±5% of the rated value.
- RMS value (Irms): The deviation from rated RMS should be less than 2%.
- Total harmonic distortion (THD): Normal THD is below 3%.
- Individual harmonic content: 5th harmonic < 0.5% (normal), 0.5%-1.5% (caution), >1.5% (abnormal).
- DC component ratio (η): Calculated as defined below; normal < 1%.
The DC component ratio is defined by the equation:
$$ \eta = \frac{V_{dc}}{V_{ac}} \times 100\% $$
where \( V_{dc} \) is the DC component amplitude (V) and \( V_{ac} \) is the AC component RMS (V). For the DC-link voltage waveform, a DC component ratio exceeding 5% indicates abnormal ripple requiring attention. In the AC output current, any DC component above 2% suggests a ground fault or asymmetric switching.
I compile these extracted values into a feature vector and compare them with the preset thresholds shown in Table 2.
| Parameter | Normal Range | Warning Range | Abnormal Threshold |
|---|---|---|---|
| Fundamental amplitude | 250 A ± 5% | 250 A ± 10% | < 212.5 A or > 287.5 A |
| Total Harmonic Distortion (THD) | ≤ 2% | 2% – 3% | > 3% |
| 5th harmonic content | ≤ 0.5% | 0.5% – 1.5% | > 1.5% |
| 7th harmonic content | ≤ 0.3% | 0.3% – 1.0% | > 1.0% |
| DC component | ≤ 1% | 1% – 2% | > 2% |
Step 2: Abnormal Waveform Pattern Recognition
If any feature exceeds the abnormal threshold, I proceed to compare the actual current waveform with a reference sine wave of the same frequency and amplitude using cross-correlation. The correlation coefficient r is computed as:
$$ r = \frac{ \sum_{n=1}^{N} (x_n – \bar{x})(y_n – \bar{y}) }{ \sqrt{ \sum_{n=1}^{N} (x_n – \bar{x})^2 \sum_{n=1}^{N} (y_n – \bar{y})^2 } } $$
where \( x \) is the measured waveform, \( y \) is the ideal sine wave, and \( N \) is the number of samples per cycle. A correlation coefficient below 0.9 indicates significant distortion. Then, I analyze the location and nature of the deviations:
- If deviations concentrate on the rising/falling edges as sharp spikes, I suspect IGBT driver faults.
- If asymmetry between positive and negative half-cycles exceeds 15%, I suspect DC-link capacitor degradation or ground fault.
- If high-frequency oscillations (frequency > 2× switching frequency) appear, I infer AC filter inductor issues.
By matching these patterns with a fault-mode knowledge base (constructed from historical failure data), I can narrow down the possible causes.
Step 3: Fault Localization and Classification
Based on the identified pattern, I further pinpoint the specific component using case-based reasoning (CBR). For instance, asymmetric waveforms often correspond to DC-link voltage ripple. The ripple magnitude can be estimated from the AC current waveform using the relationship:
$$ V_{ripple} \approx \frac{I_{dc}}{2 \pi f C} $$
where \( I_{dc} \) is the DC current, \( f \) is the fundamental frequency (50 Hz), and \( C \) is the DC-link capacitance. By measuring the actual ripple and comparing with the expected value for a healthy capacitor, I can quantify the capacitance degradation. Additionally, I incorporate a predictive model that uses data mining on historical trends to forecast impending failures. Once the fault is localized, I assign a severity level: minor (e.g., partial capacitor aging) can be resolved by field replacement of components; major (e.g., multiple IGBT failures) may require unit replacement.
Case Study: Field Application of the Diagnostic Method
Background
I applied the proposed method to a 500 kW centralized solar inverter at a large ground-mounted PV station. The inverter uses a three-phase bridge topology with six IGBTs, two 2200 μF / 800 V DC-link capacitors, three 50 μH / 500 A AC output inductors, and an isolation transformer. The control system is based on a TI TMS320F28335 DSP running SPWM, MPPT, and grid protection routines. The rated DC input voltage is 550 V, rated AC output voltage is 315 V / 50 Hz, and maximum efficiency is 98.7%.
During routine inspection, the inverter exhibited frequent power fluctuations and an output current waveform with severe distortion. The THD was measured at 8.2%, far above the 3% threshold, and the 5th harmonic content reached 4.3% of the fundamental. The waveform showed a flat top and asymmetry between half-cycles, suggesting DC-link capacitor issues.
Diagnosis Implementation
I installed a LEM LA 205-S Hall-effect sensor and sampled the three-phase currents at 20 kHz. After applying a 5th-order Butterworth low-pass filter (cutoff 4 kHz), I extracted the parameters shown in Table 3.
| Parameter | Measured Value | Normal Range | Status |
|---|---|---|---|
| Fundamental amplitude | 166 A | 237.5 – 262.5 A | Abnormal (66.4% of rated) |
| THD | 8.2% | < 3% | Abnormal |
| 5th harmonic | 4.3% | < 1.5% | Abnormal |
| 7th harmonic | 2.6% | < 1.0% | Abnormal |
| DC component | 6.8% | < 2% | Abnormal |
The cross-correlation coefficient with a pure sine wave was only 0.62, confirming severe distortion. The waveform asymmetry showed the negative half-cycle peak was 15% lower than the positive one. I then measured the DC-link voltage ripple using an oscilloscope and found a peak-to-peak ripple of 35 V, versus the rated 15 V. The DC component ratio η on the DC bus was 6.8%, exceeding the 5% alert threshold. This unambiguously pointed to DC-link capacitor degradation.
To quantify the capacitance loss, I used the ripple estimation formula. The nominal capacitance per capacitor is 2200 μF; the total DC bus capacitance is 4400 μF (two in parallel). The ripple voltage for a given load current Iload = 250 A RMS (rated) is:
$$ V_{ripple} \approx \frac{I_{dc}}{2 \cdot f \cdot C} = \frac{250 \times \sqrt{2} / \pi}{2 \times 50 \times 4400 \times 10^{-6}} \approx 12.7 \text{ V peak-to-peak} $$
Based on the measured 35 V ripple, the effective capacitance had dropped to approximately:
$$ C_{eff} \approx \frac{I_{dc}}{2 f V_{ripple}} = \frac{250 \times \sqrt{2} / \pi}{2 \times 50 \times 35} \approx 1600 \mu\text{F} $$
This indicates a loss of about 64% of the original capacitance, confirming severe aging. Consequently, I replaced both DC-link capacitors and slightly adjusted the PI controller gains in the voltage loop to improve transient response. After the replacement, I repeated the measurements (Table 4).
| Parameter | Measured Value | Normal Range | Status |
|---|---|---|---|
| Fundamental amplitude | 245 A | 237.5 – 262.5 A | Normal (98% of rated) |
| THD | 1.9% | < 3% | Normal |
| 5th harmonic | 0.8% | < 1.5% | Normal |
| 7th harmonic | 0.5% | < 1.0% | Normal |
| DC component | 0.7% | < 2% | Normal |
The DC-link ripple dropped to 14 V peak-to-peak, and the inverter operated at full rated power with stable output. This case successfully validated the diagnostic method: the current waveform analysis correctly identified the DC-link capacitor aging as the root cause, and the quantitative estimation allowed precise localization.
Conclusion and Practical Recommendations
Through extensive field applications, I have demonstrated that the current waveform-based fault diagnosis method is a powerful tool for maintaining solar inverter health. By leveraging high-frequency sampling, feature extraction, and pattern recognition, operators can quickly detect and pinpoint internal faults without needing to disassemble the inverter. The use of tables and formulas—such as the DC component ratio and capacitance estimation equations—provides objective, repeatable metrics for decision-making.
I recommend the following practical guidelines for implementing this method:
- Set sampling rates at least 20 kHz to capture switching transients.
- Use a Butterworth filter with a cutoff frequency around 4 kHz to preserve low-order harmonics while removing noise.
- Define thresholds adaptively based on inverter rating: for large inverters (≥500 kW), THD thresholds can be relaxed to 4% to avoid false alarms due to normal grid harmonics.
- Combine current waveform analysis with voltage waveform and DC-link ripple measurements to increase diagnostic accuracy.
- Build a historical fault database to enable case-based reasoning and predictive maintenance.
In summary, this approach reduces unplanned downtime, lowers maintenance costs, and enhances the overall reliability of solar power generation. As more PV plants adopt digital monitoring, embedding this waveform analysis into the inverter control unit or a cloud-based platform will enable real-time, automated fault diagnosis—moving towards self-healing solar inverters of the future.